Tron Price Forecast: TRX risks breaking year-long support as user, retail demand drops
- TRX approaches the year-long support trendline amid intense selling pressure.
- The derivatives data suggest a risk-off sentiment among traders.
- On-chain data indicates increased outflows from the Tron ecosystem as user demand wanes.

Tron (TRX) trades at $0.2800 by press time on Tuesday, under bearish pressure following a 5.64% loss on Monday. Technically, TRX risks breaking below a crucial support trendline while both derivatives and on-chain data suggest a decline in retail and user demand.
Waning demand for the Tron ecosystem
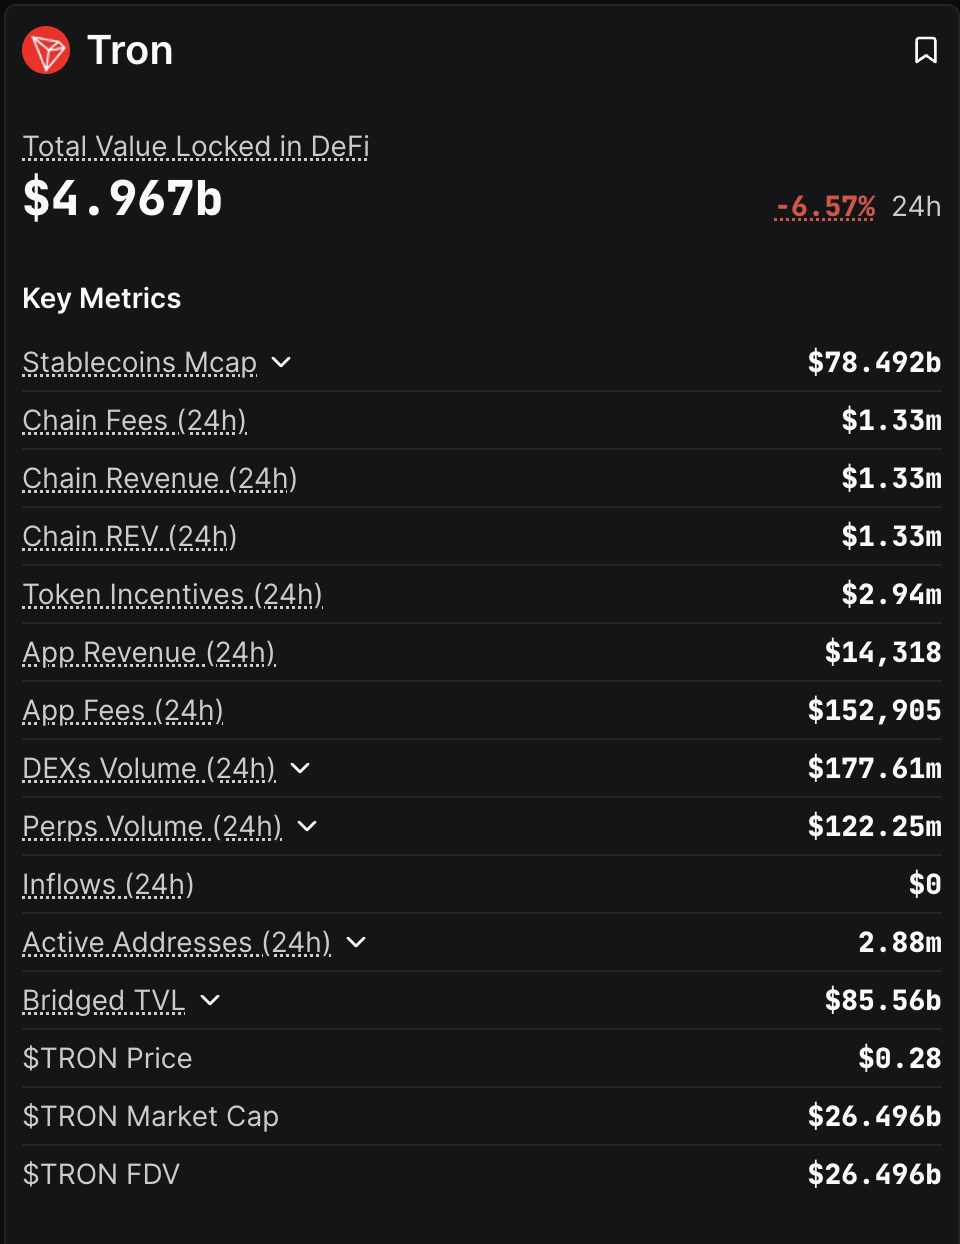
Tron, a network of Decentralized Finance (DeFi) protocols, is experiencing a decline in user interest as the broader crypto ecosystem faces a sell-off wave. According to DeFiLlama, the Total Value Locked (TVL) on the DeFi network is down 6.57% in the last 24 hours, dropping below the $5 billion mark to $4.967 billion. This suggests that users are withdrawing digital assets from the ecosystem, indicating a decline in interest.
Similarly, derivatives traders are becoming risk-averse and losing interest in Tron. CoinGlass data shows that the TRX futures Open Interest (OI) decreased by 1.68% over the last 24 hours to $290.50 million, indicating a reduction in outstanding futures contracts or their leverage-based value.
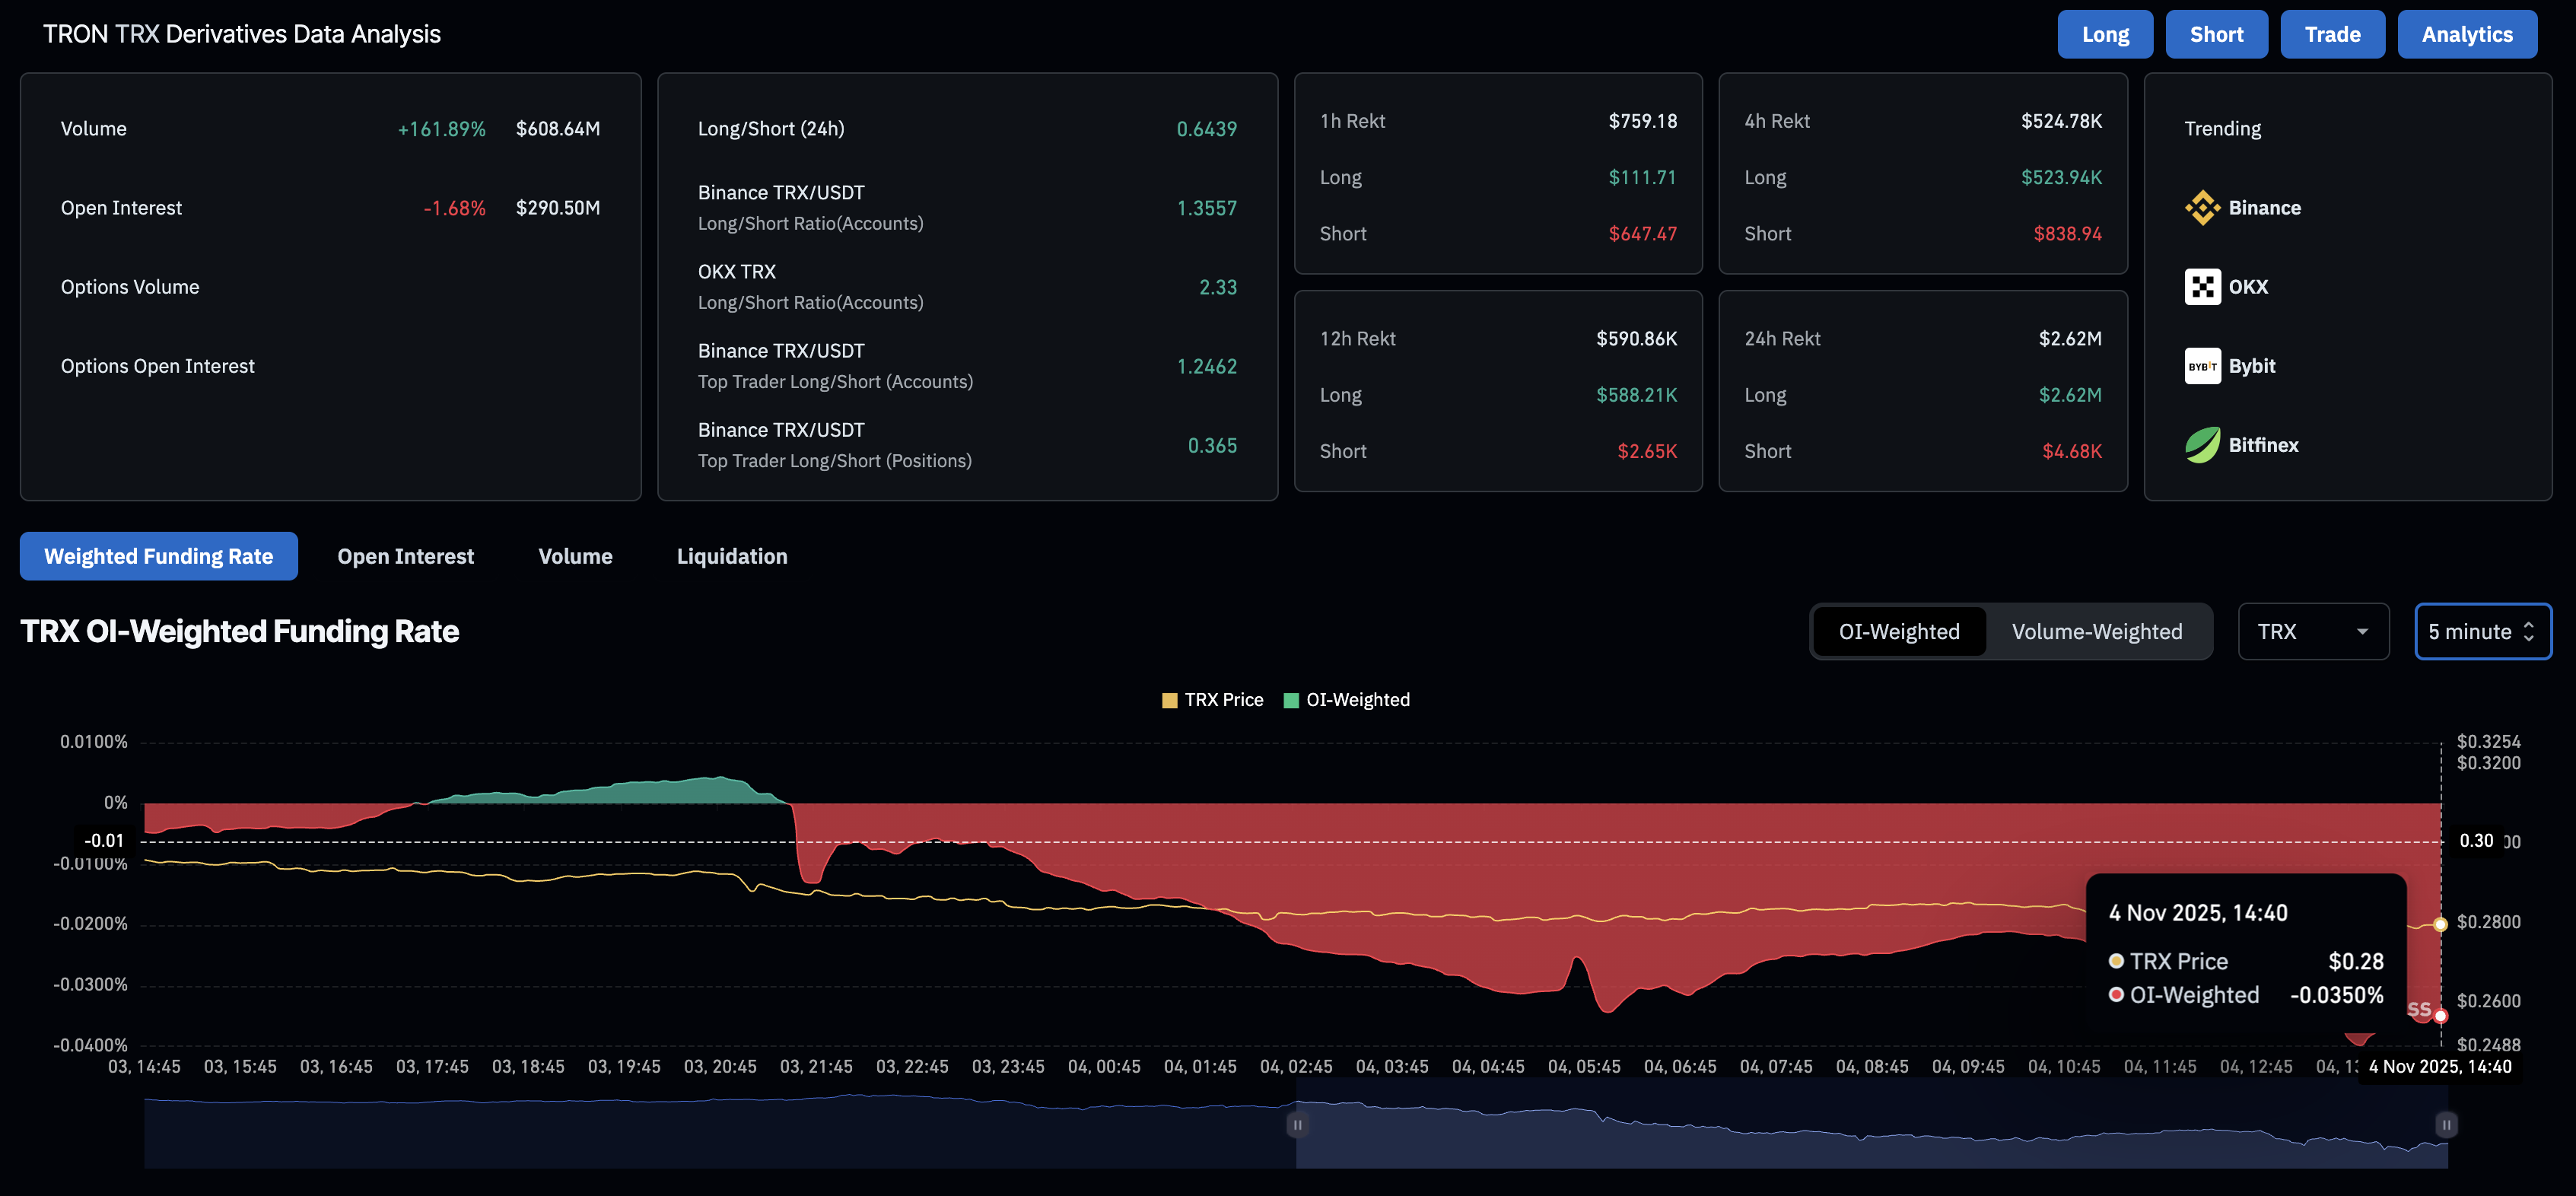
If the interest in the derivatives market and on-chain continues to decline, TRX could further lose its market value.
Technical outlook: Will Tron break below its year-long support trendline?
Tron trades below its 200-day Exponential Moving Average (EMA) at $0.3029, while the 50-day EMA crosses below the 100-day EMA, flashing a Death Cross pattern. This indicates a rise of bearish momentum in the short-term trend. Under sell-off pressure, TRX is approaching a long-standing support trendline at $0.2764, formed by connecting the February 3 and March 16-17 lows.
A decisive close below this trendline would likely result in further losses for Tron, with sellers aiming for $0.2632 and $0.2397, marked by the May 31 and April 18 lows, respectively.
The momentum indicators on the daily chart flash intense overhead pressure as the Relative Strength Index (RSI) at 26 enters the oversold zone, maintaining a downward slope. Moreover, the Moving Average Convergence Divergence (MACD) has flipped from its signal line for the third time since early October, suggesting that sell-off pressure is coming in successive waves.
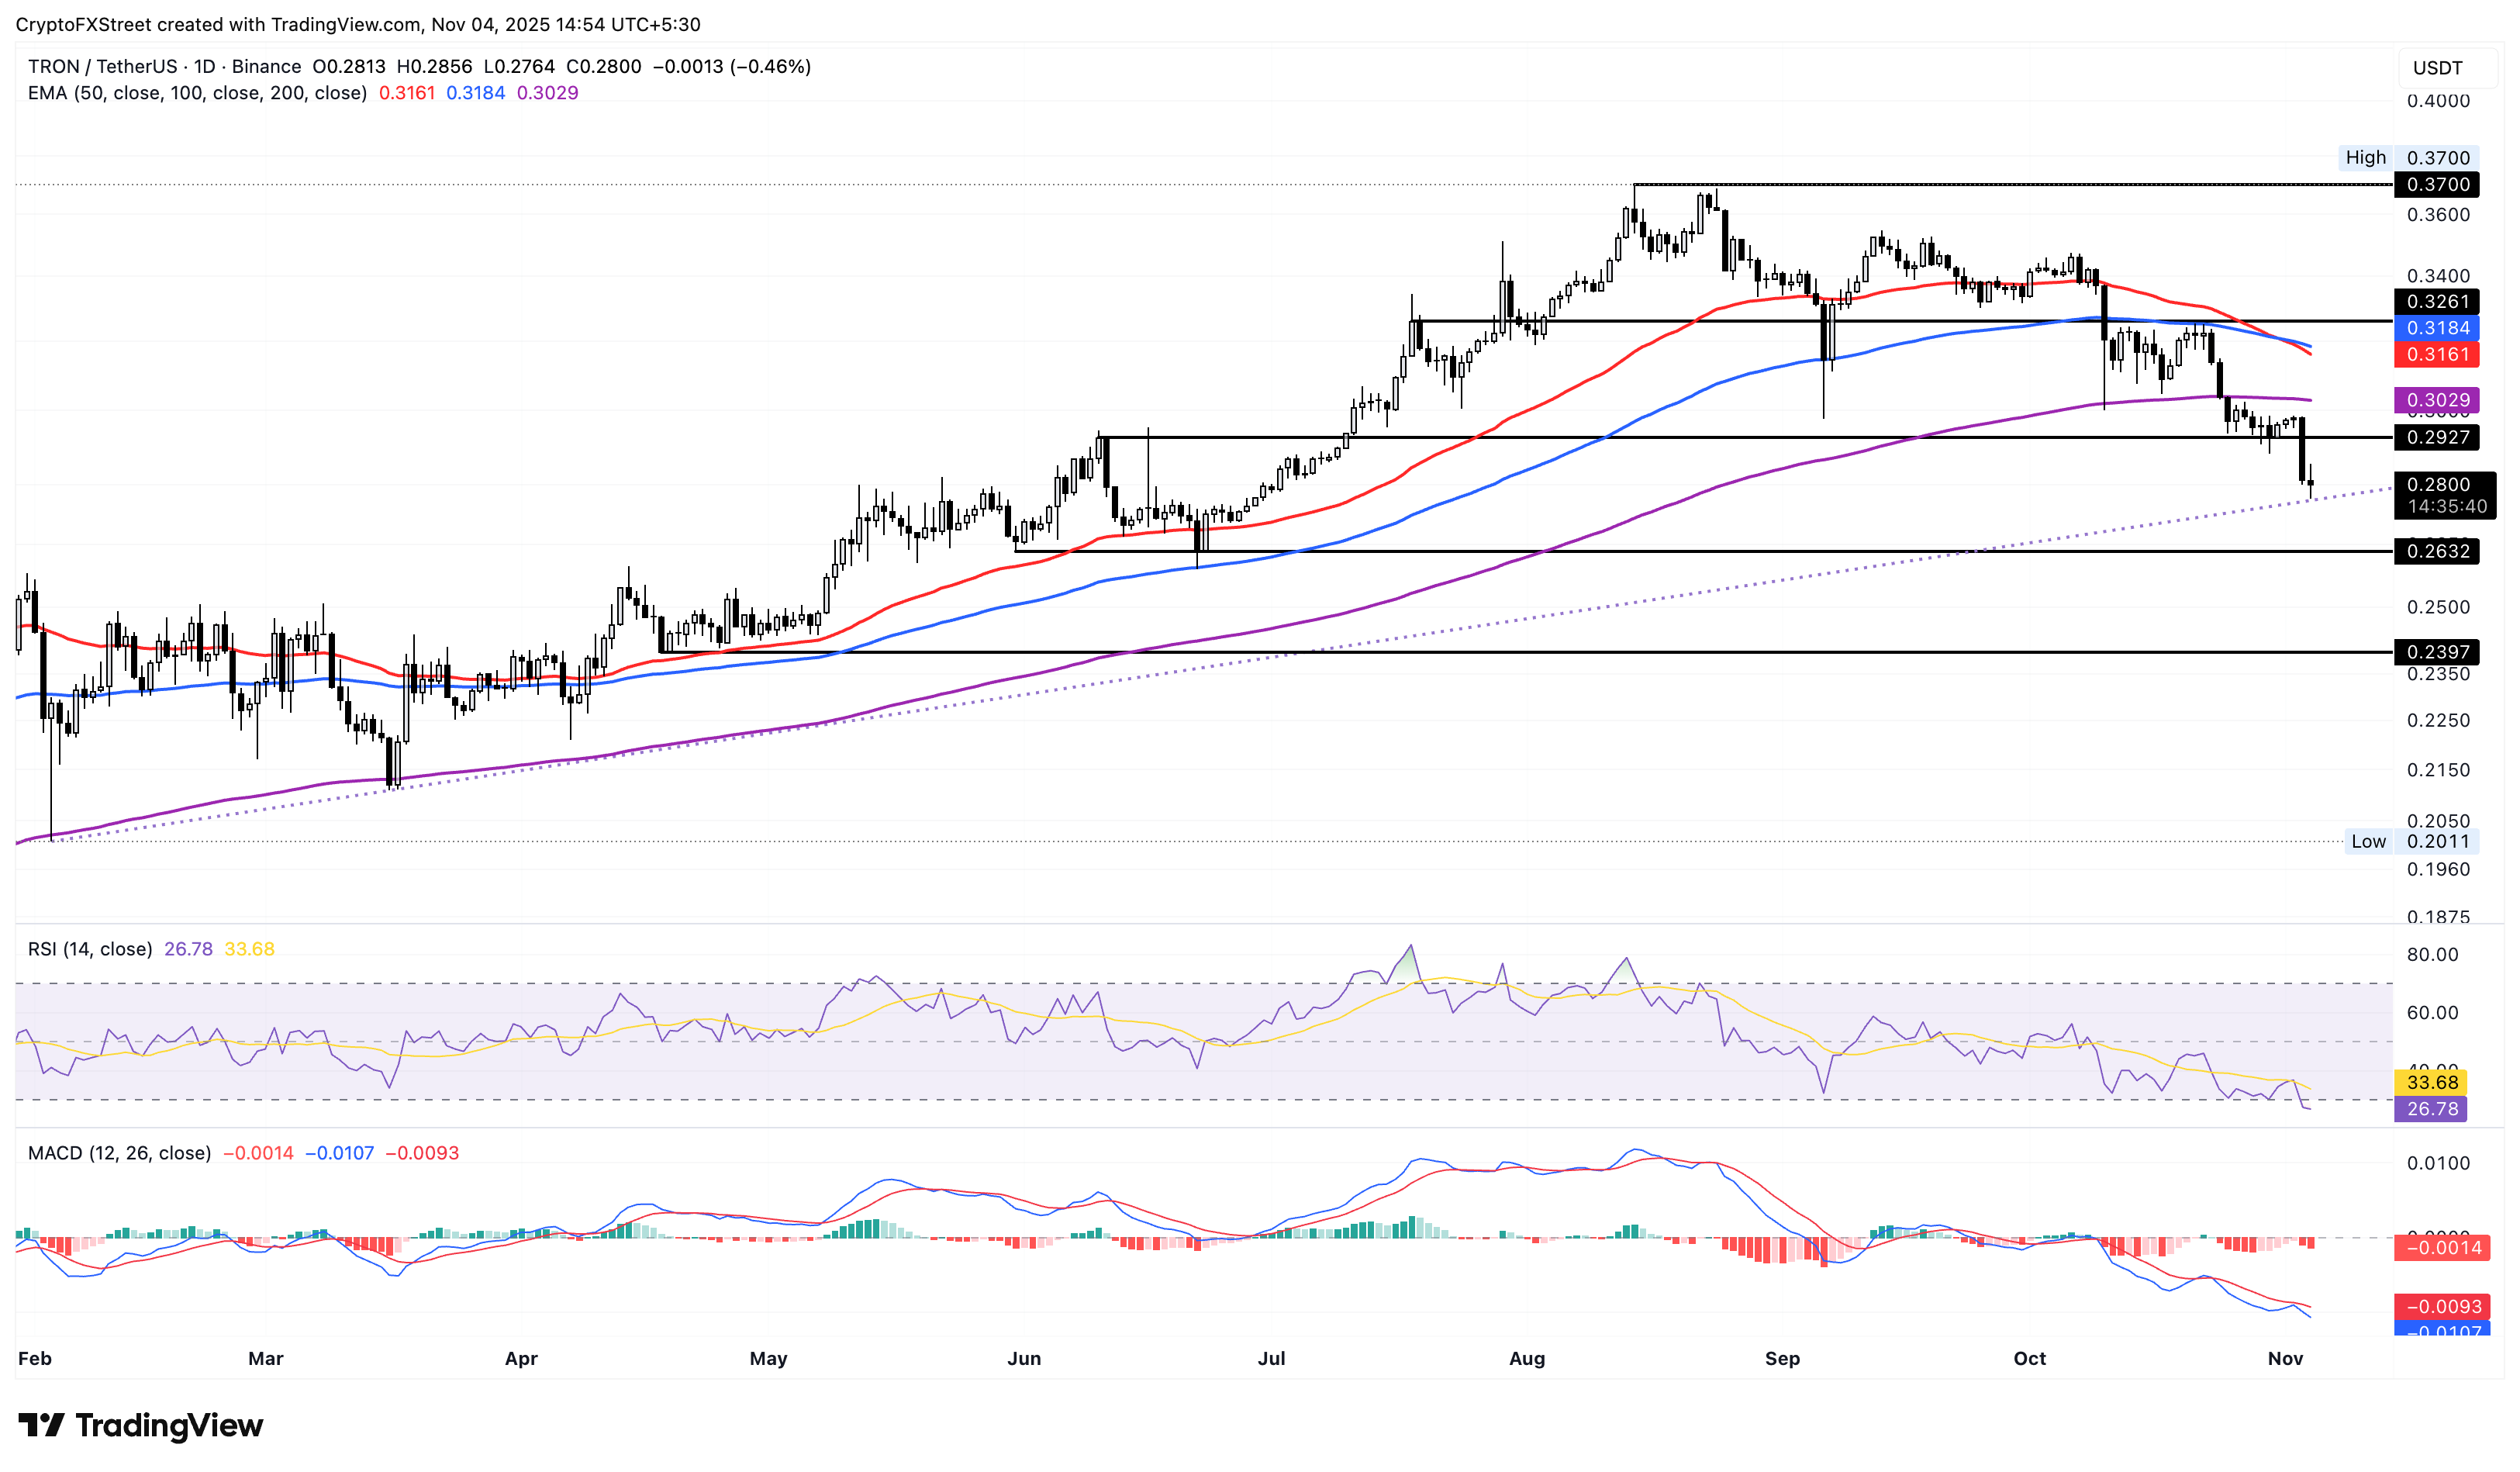
If Tron rebounds from $0.2764, the $0.2967 level flipped into a resistance after Monday’s correction, and the 200-day EMA at $0.3029 could oppose the recovery run.
Author

Vishal Dixit
FXStreet
Vishal Dixit holds a B.Sc. in Chemistry from Wilson College but found his true calling in the world of crypto.



