TRON Price Forecast: TRX eyes 40% breakout as Tether mints 1 billion USDT on the network
- TRX bullish structure aims for a 40% move to reach the record high of $0.4501, following a 54% rally from its April lows.
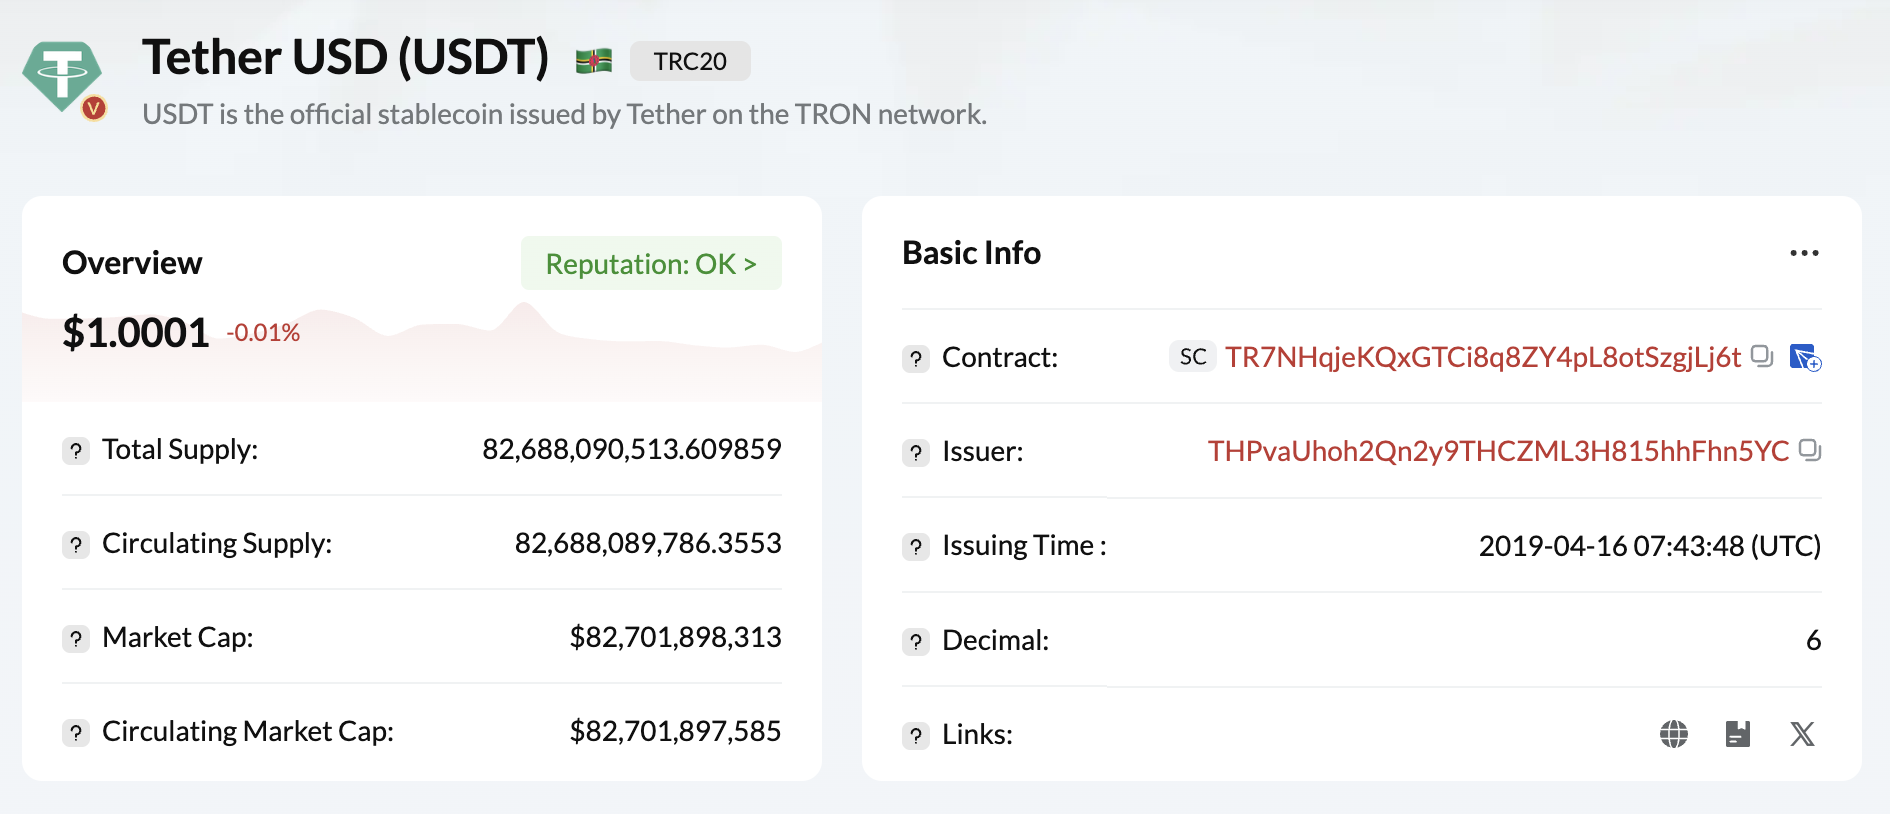
- Tether has minted an additional 1 billion USDT stablecoin tokens on the TRON blockchain, bringing the total supply to 83 billion USDT.
- Investor interest in TRX remains strong, backed by steady funding rate and elevated futures Open Interest.

TRON (TRX) price uptrend remains steady, trading at $0.3227 on Monday. The smart contracts token boasts a 54% rally from its April lows, with gains accrued since the beginning of July totaling 17%.
Interest in TRX appears to be steady, based on key trends and indicators in the derivatives market, particularly the futures funding rate and Open Interest (OI). At the same time, technical indicators reinforce the bullish grip, significantly increasing the likelihood of TRX extending the breakout to its record high of $0.4501.
Tether mints 1 billion USDT on the TRON blockchain
Tether, the company that issues the largest stablecoin USDT, has minted an additional 1 billion USDT on the TRON blockchain, according to on-chain data shared by Spot on Chain.
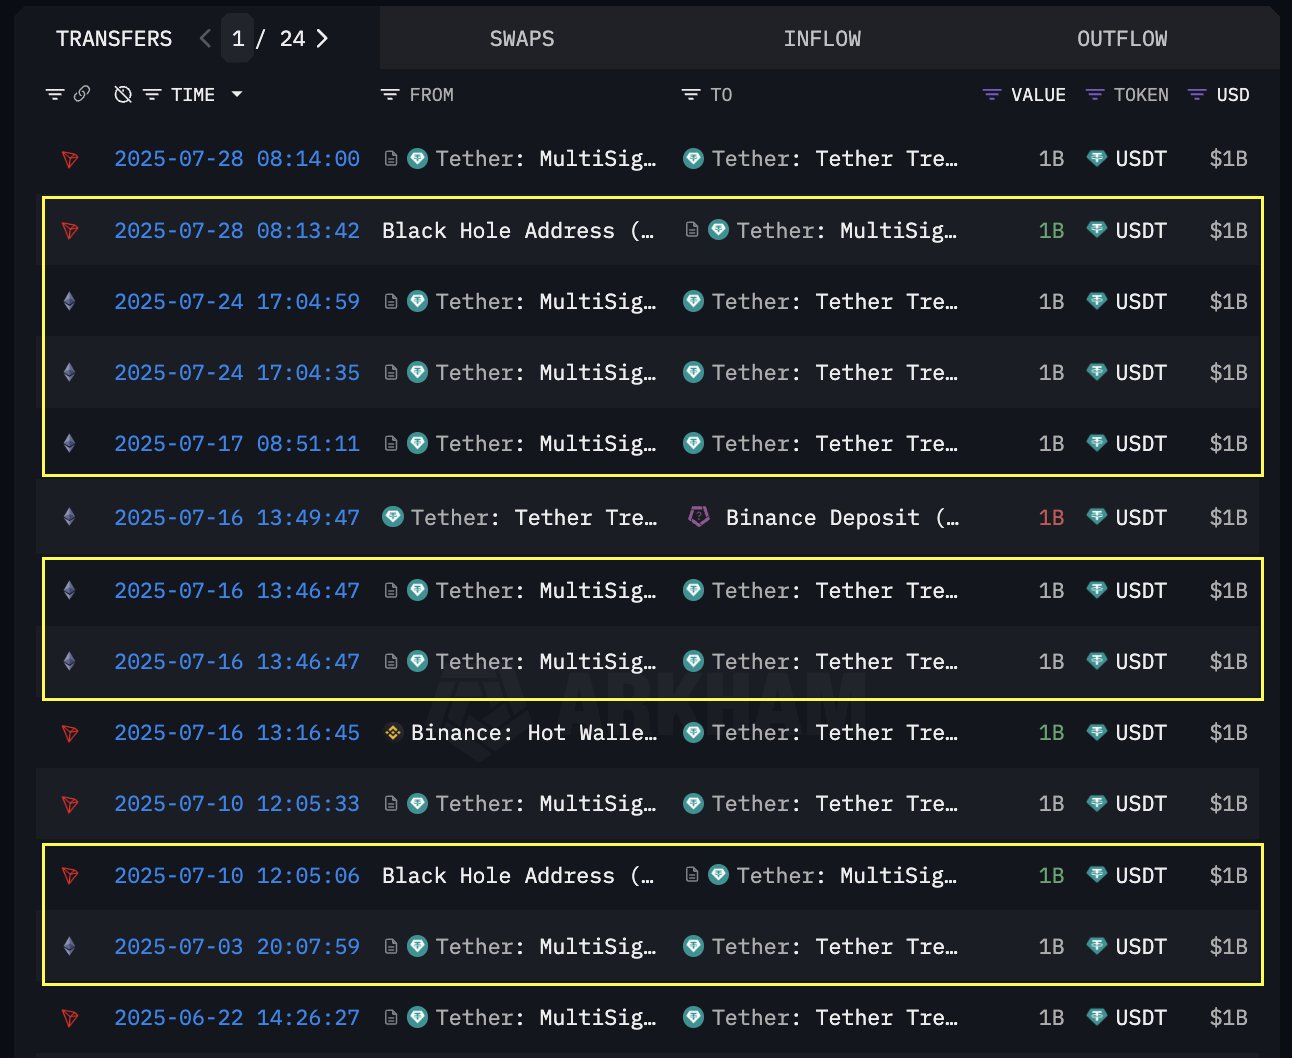
Tether USDT minting stats | Source: Spot On Chain
"Over the past 25 days, Tether has minted a total of 8 billion USDT on both TRON ($2 billion) and Ethereum ($6 billion)," Spot On Chain highlighted on X.
So far, USDT's circulating supply on the TRON protocol is approaching 83 billion tokens, underscoring the blockchain's role in Tether's ecosystem.
USDT market cap on TRON | Source: TronScan
Stablecoin demand is expected to surge in the coming months, following the passage of the GENIUS Act into US law earlier this month. The legislation aims to regulate the development and issuance of stablecoins in the US at both the state and federal government levels.
Consumer and stakeholder protection is at the core of the GENIUS Act, which is expected to bolster financial innovation and bridge the gap between the crypto industry and the traditional finance system.
As for TRON, interest in the token has been rising steadily as evidenced by the weighted funding rate chart below. The steady rise of this fundamental indicator suggests bullish momentum, backed by higher demand for long positions than short positions. This also means that more traders have a bullish bias, using leverage to bet on price increases.

TRON futures funding rate | Source: CoinGlass
A subsequent increase in the futures Open Interest (OI), which represents the notional value of all outstanding futures or options contracts, reinforces growing ecosystem confidence, especially with Tether increasing the supply of USDT stablecoin on the network.
After peaking at around $541 million on July 23, OI has averaged $492 million on Monday. Traders should monitor the chart below in the coming days to gauge investor confidence in TRX, especially with bulls eyeing a breakout to record highs of $0.4501.
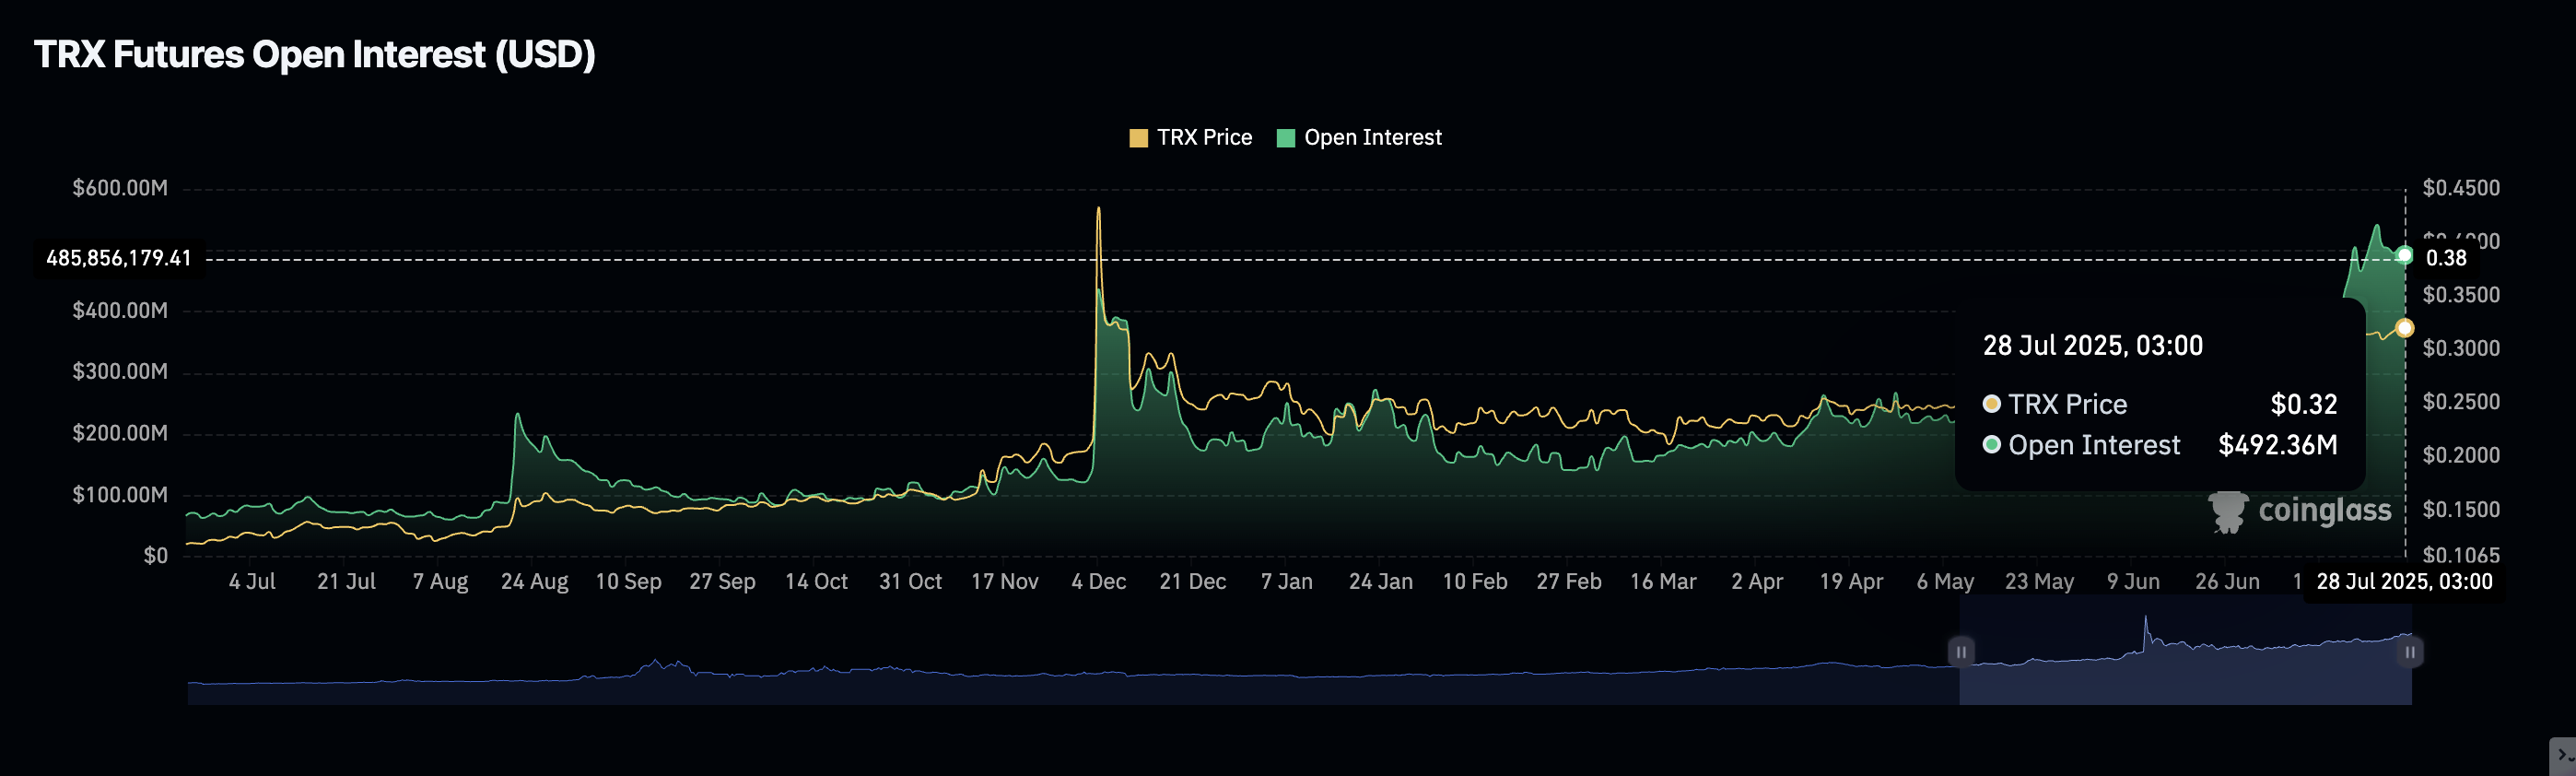
TRON Futures Open Interest | Source: CoinGlass
Technical outlook: TRX bulls retain control
TRON price remains bullish, underpinned by growing interest in the derivatives market, a steady increase in spot volume and robust technical signals.
The Moving Average Convergence Divergence (MACD) indicator suggests maintaining exposure, as a buy signal was triggered on July 7 when the blue line crossed above the red signal line on the 3-day chart.
TRON price's path of last resistance remains upward amid a steadily rising Relative Strength Index (RSI), which is currently overbought at 76, but shows no signs of exhaustion. This means bulls still have room to accelerate the token to higher levels, while aiming for the record high of $0.4501.
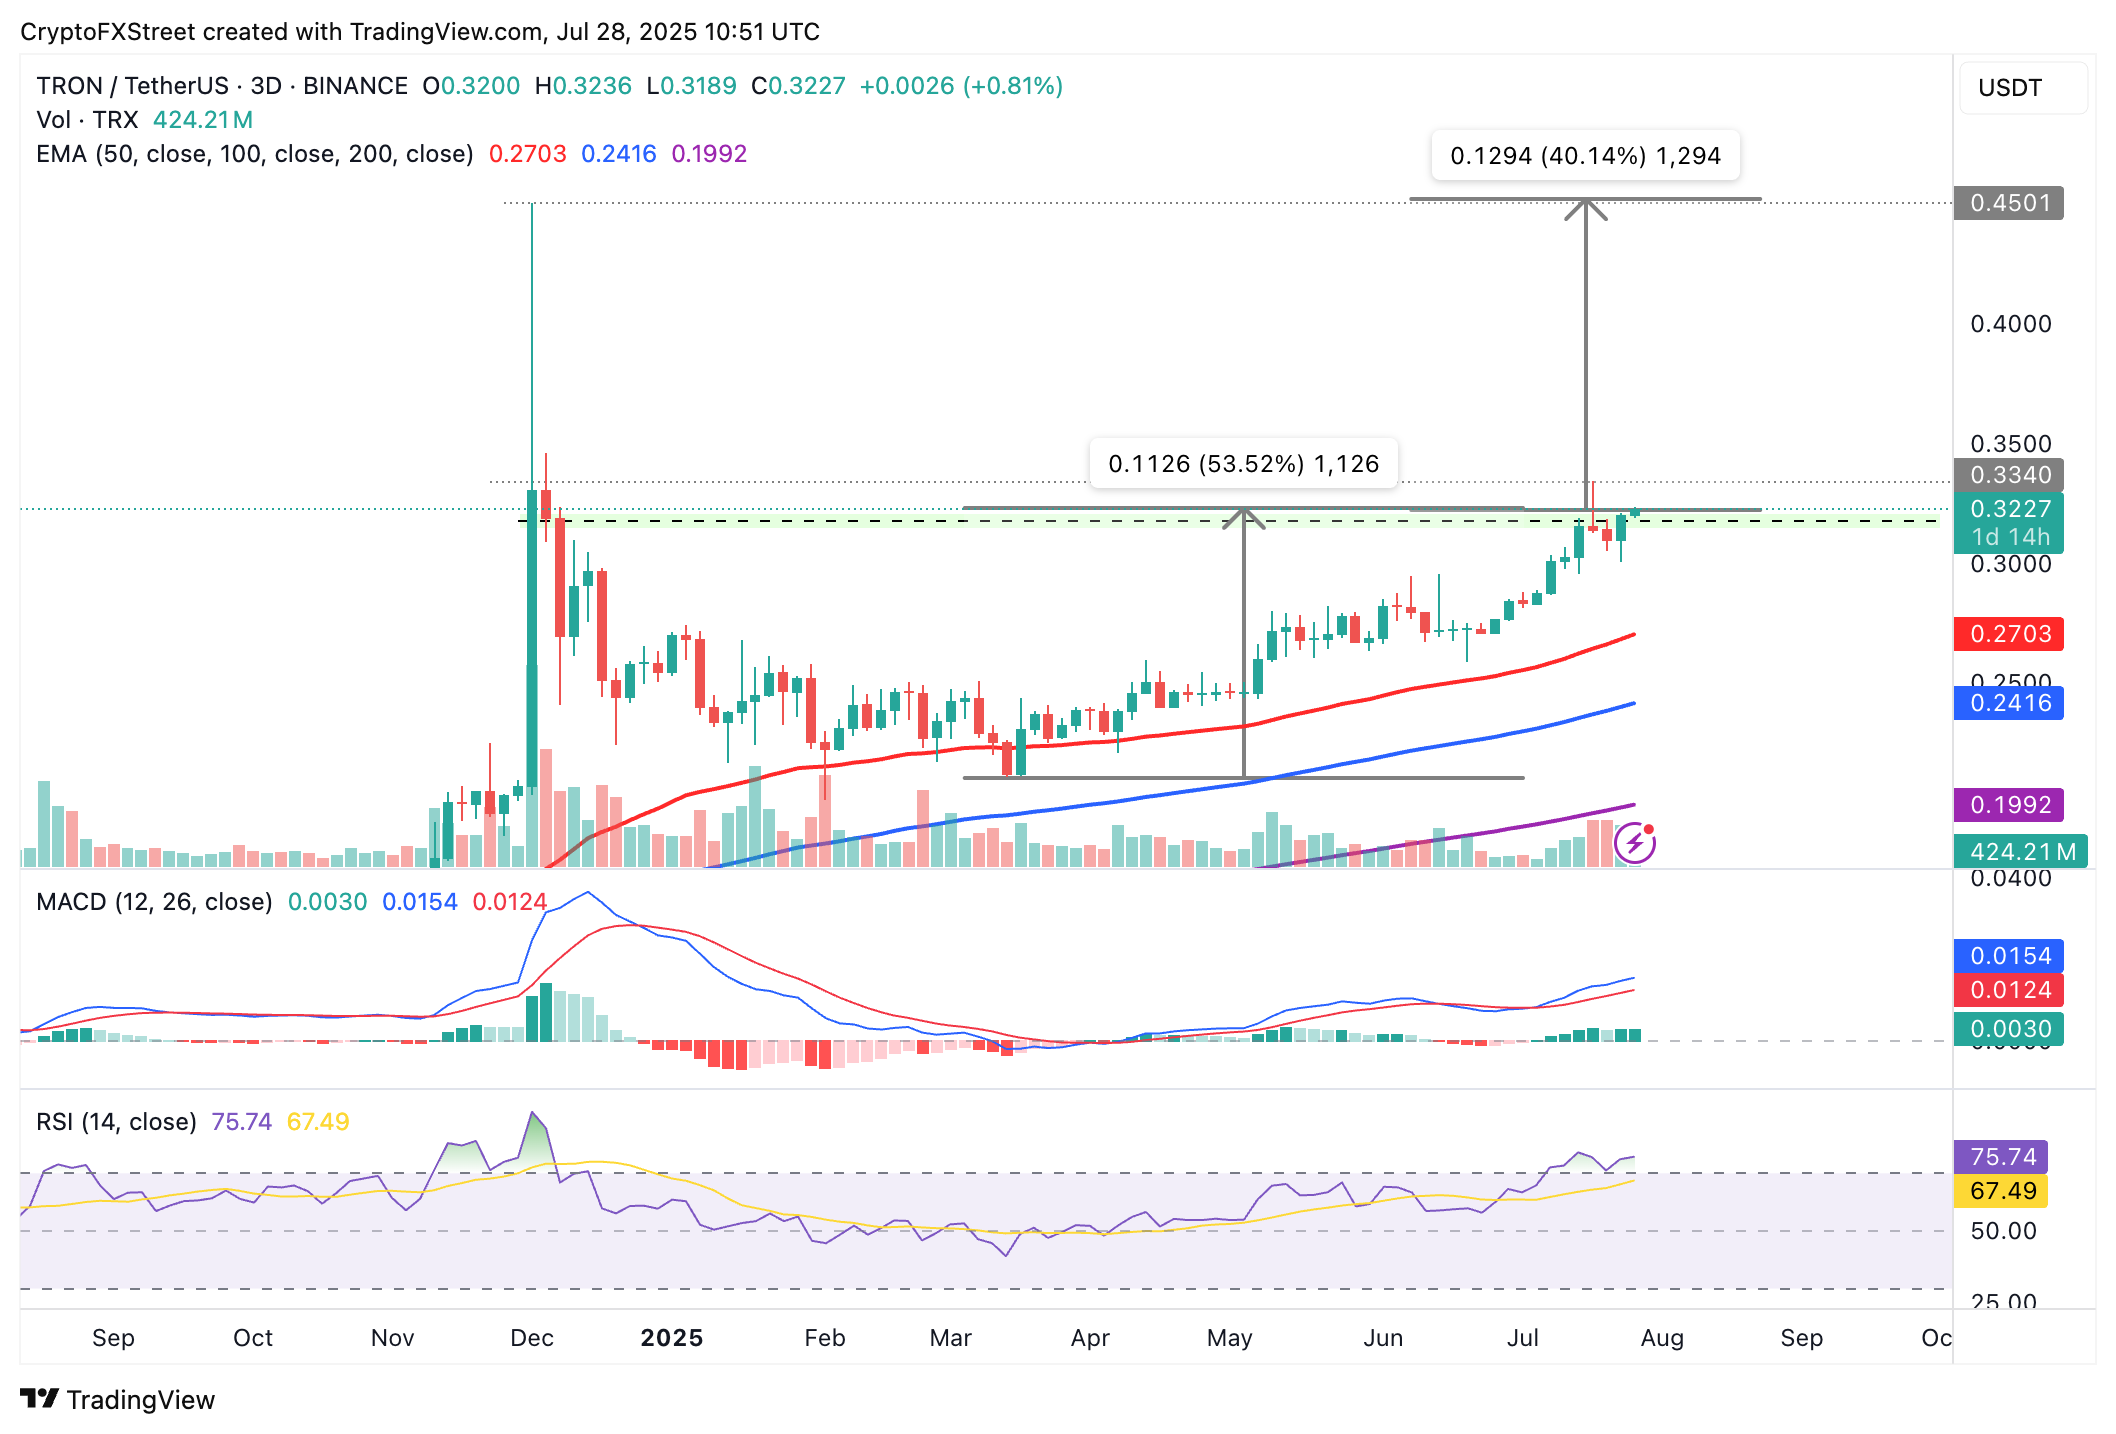
TRX/USDT 3-day chart
Since the RSI is overbought, traders should also temper their bullish expectations. Extremely overbought RSI levels are often a precursor to sudden pullbacks. In the event of an extended correction, traders may want to expand their scope to the 50-period Exponential Moving Average (EMA) at $0.2703, the 100-period EMA at $0.2416 and the 200-period EMA at $0.1992 for tentative support on the 3-day chart.
Open Interest, funding rate FAQs
Higher Open Interest is associated with higher liquidity and new capital inflow to the market. This is considered the equivalent of increase in efficiency and the ongoing trend continues. When Open Interest decreases, it is considered a sign of liquidation in the market, investors are leaving and the overall demand for an asset is on a decline, fueling a bearish sentiment among investors.
Funding fees bridge the difference between spot prices and prices of futures contracts of an asset by increasing liquidation risks faced by traders. A consistently high and positive funding rate implies there is a bullish sentiment among market participants and there is an expectation of a price hike. A consistently negative funding rate for an asset implies a bearish sentiment, indicating that traders expect the cryptocurrency’s price to fall and a bearish trend reversal is likely to occur.
Author

John Isige
FXStreet
John Isige is a seasoned cryptocurrency journalist and markets analyst committed to delivering high-quality, actionable insights tailored to traders, investors, and crypto enthusiasts. He enjoys deep dives into emerging Web3 tren


