Traders must be aware of this resistance cluster ahead of Zilliqa price
- Zilliqa price recovery after a 38% crash seems to be coming along well with a 16% upswing on May 10.
- Rejection at the 200-day and 100-day SMAs cluster at roughly $0.076 could trigger a 33% crash to $0.05.
- A daily candlestick close above $0.120 will invalidate the bearish thesis for ZIL.

Zilliqa price is in a relief rally after undergoing a massive sell-off since April 1. This move, like many others, is likely to be temporary due to the overall negative market outlook and the way the technicals are positioned.
Zilliqa price ready for round two
Zilliqa price touched a bearish breaker after a 47% upswing between May 3 and 5. This is a technical formation that develops after a demand zone between two higher highs is flipped into a resistance barrier.
For ZIL, the swing points in question are $0.118 and $0.230 formed on March 27 and April 1, respectively. On April 26 ZIL crashed 10% and produced a daily candlestick close below the $0.097 to $0.121 demand zone, flipping it into a bearish breaker.
Therefore, the eventual retest of this breaker on May 5, triggered a 38% crash to where ZIL price currently hovers at $0.072. Despite the overall bearish market outlook, altcoins seem to be bouncing well, which has caused ZIL to rally 16% for the day.
However, the price inefficiency aka Fair Value Gap (FVG), extending from $0.0104 to $0.0508 is unfilled. Therefore, the chances of ZIL dropping after this relief rally are high. Adding credence to this bearish reversal is the cluster of the 100-day and 200-day Simple Moving Average (SMA) at roughly $0.076.
Furthermore, the tough $0.080 hurdle also makes it hard for bulls to slip past and move higher. Hence, investors should be prepared for a quick turnaround in Zilliqa price as it crashes another 33% to $0.058, filling the FVG.
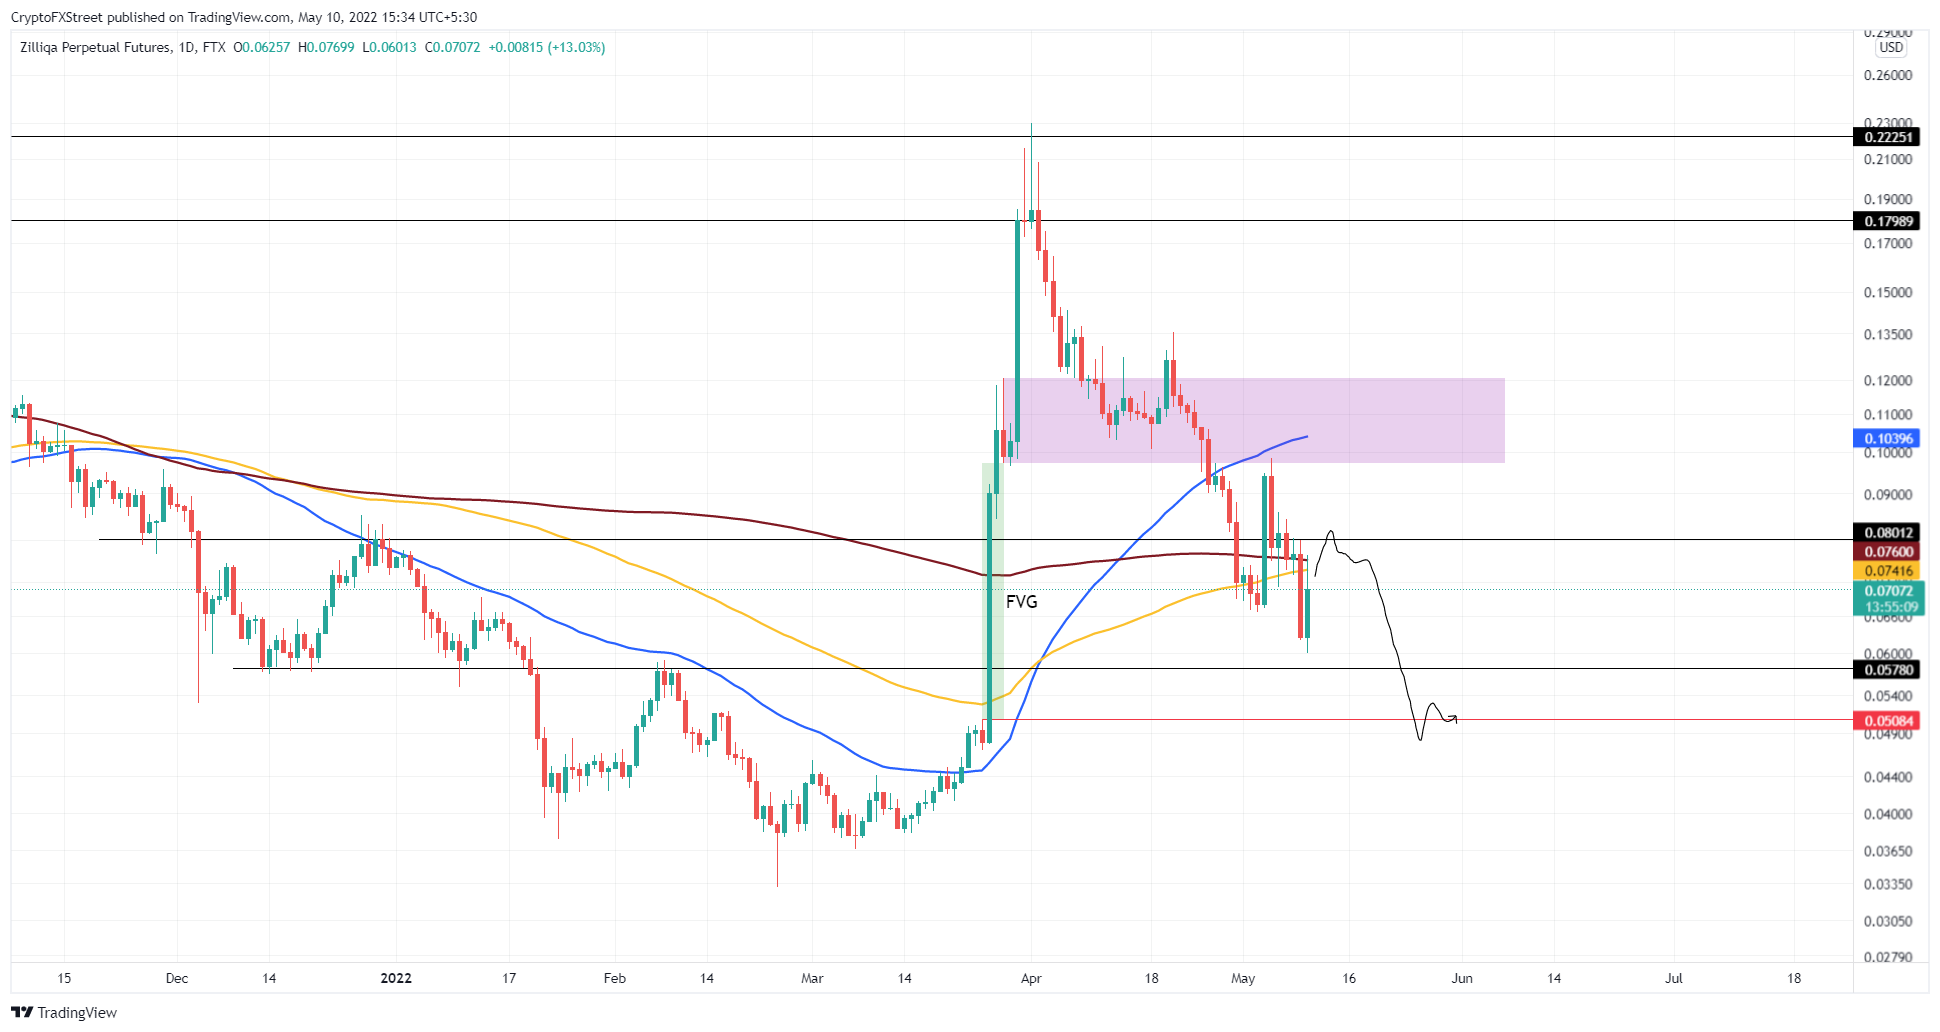
ZIL/USDT 1-day chart
Zilliqa price can make the current short-term spell of bullishness more permanent by overcoming the breaker. A daily candlestick close above $0.120 will invalidate the breaker and hence the bearish thesis.
Such a move would open the path for Zilliqa price to propel higher and retest the immediate resistance barrier at $0.179.
Author

Akash Girimath
FXStreet
Akash Girimath is a Mechanical Engineer interested in the chaos of the financial markets. Trying to make sense of this convoluted yet fascinating space, he switched his engineering job to become a crypto reporter and analyst.