Top Gainers: Hedera, Hyperliquid, and SPX6900 extend gains as BTC bounces from $80,000
- Hedera price trades in green on Monday, following a 12% rally the previous day.
- Hyperliquid price extends its recovery after finding support near the key psychological level of 30 over the weekend.
- SPX6900 trades above $0.52 after gaining more than 9.5% in the previous session, maintaining upward momentum.

The crypto market sees selective gains on Monday as Hedera (HBAR), Hyperliquid (HYPE), and SPX6900 (SPX) extend their recent rallies after finding support around key levels. Bitcoin’s (BTC) rebound from the $80,000 level has provided some stability, supporting short-term recovery across these altcoins. However, the market sentiment remains cautious, with traders keeping an eye on key support and resistance levels.
Hedera rebounds after retesting the weekly support at $0.125
Hedera's price faced rejection at the daily resistance at $0.194 on November 11 and declined by more than 32% over the next 10 days, retesting the weekly support level at $0.125 on Friday. HBAR rebounded by 13% after retesting this support level during the weekend. At the time of writing on Monday, it continues to trade higher at around $0.150.
If HBAR continues its recovery and closes above the daily resistance level at $0.152 on a daily basis, it could extend the rally toward the 61.8% Fibonacci retracement level at $0.172, which roughly coincides with the upper trendline of a falling wedge pattern.
The Relative Strength Index (RSI) on the daily chart is 44, pointing upward toward the neutral 50 level, indicating fading bearish momentum. For the recovery rally to be sustained, the RSI must move above the neutral level. Additionally, the Moving Average Convergence Divergence (MACD) lines are converging and nearing a bullish crossover, providing further technical support for the potential continuation of the recovery.
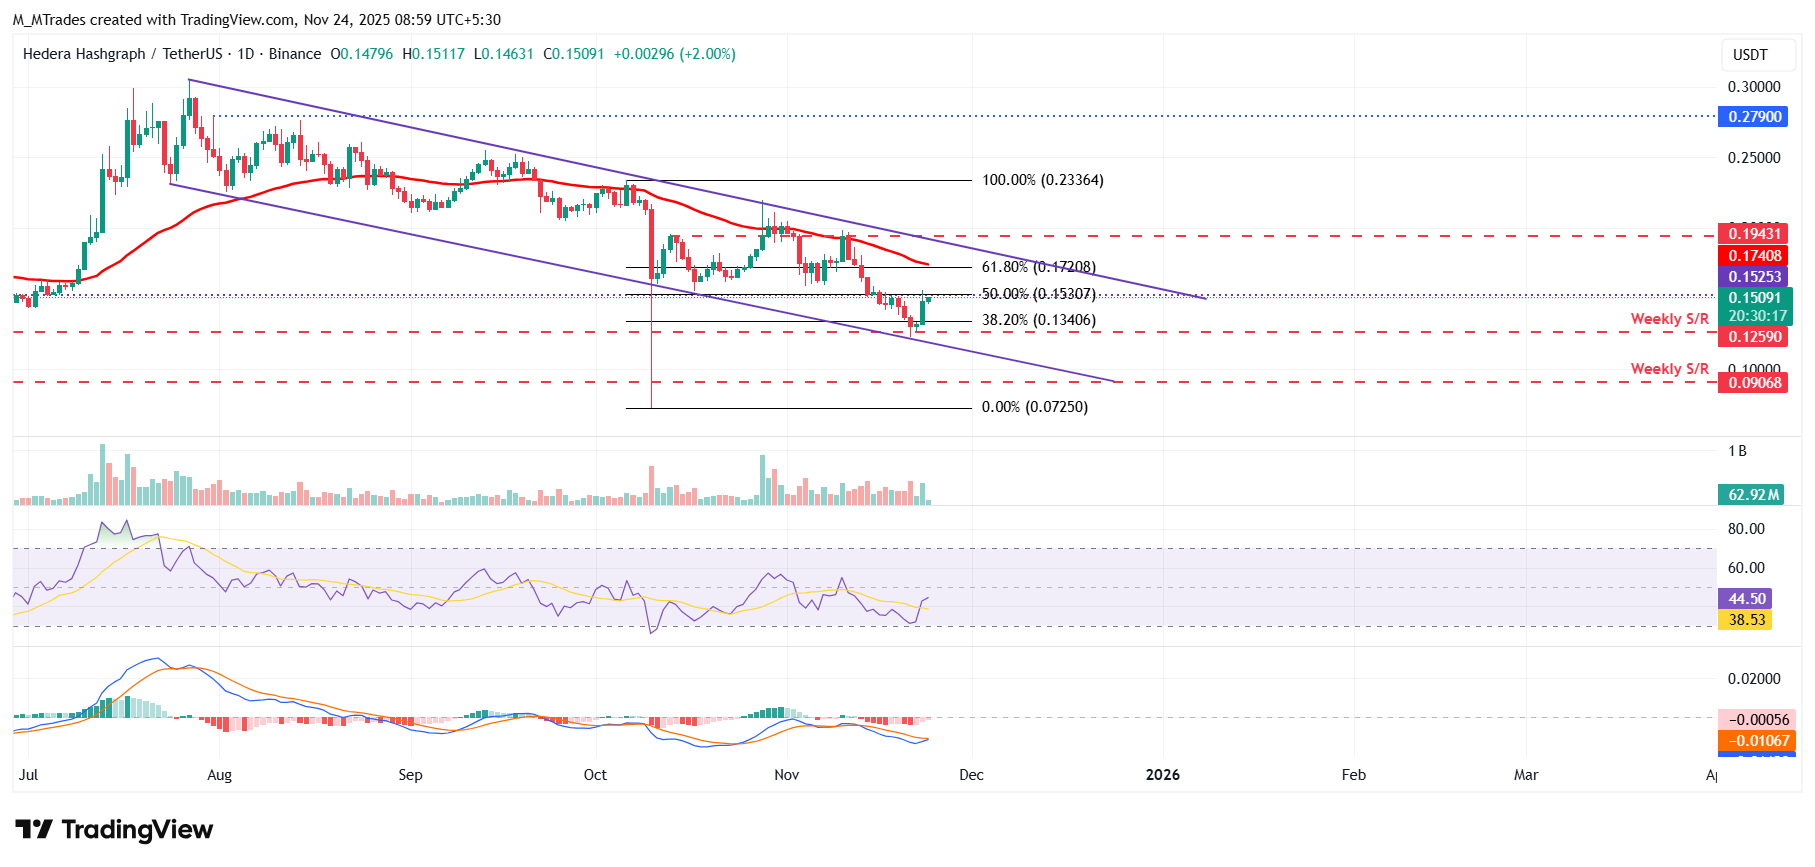
On the other hand, if HBAR faces a correction, it could extend the decline toward the weekly support at $0.125.
Hyperliquid shows strength following $30 floor test
Hyperliquid price faced rejection from the 50-day Exponential Moving Average (EMA) around $40 last week and declined more than 17%, bringing it down to retest the key psychological support at $30 on Saturday. HBAR bounced back nearly 7% the following day after reaffirming this support zone. At the time of writing on Monday, it continues to trade higher above $33.
If HYPE continues its recovery, it could extend the rally toward the next daily resistance at $36.51.
The RSI on the daily chart reads 39, pointing upward toward the neutral level of 50, indicating fading bearish momentum. For the recovery rally to be sustained, the RSI must move above the neutral level.
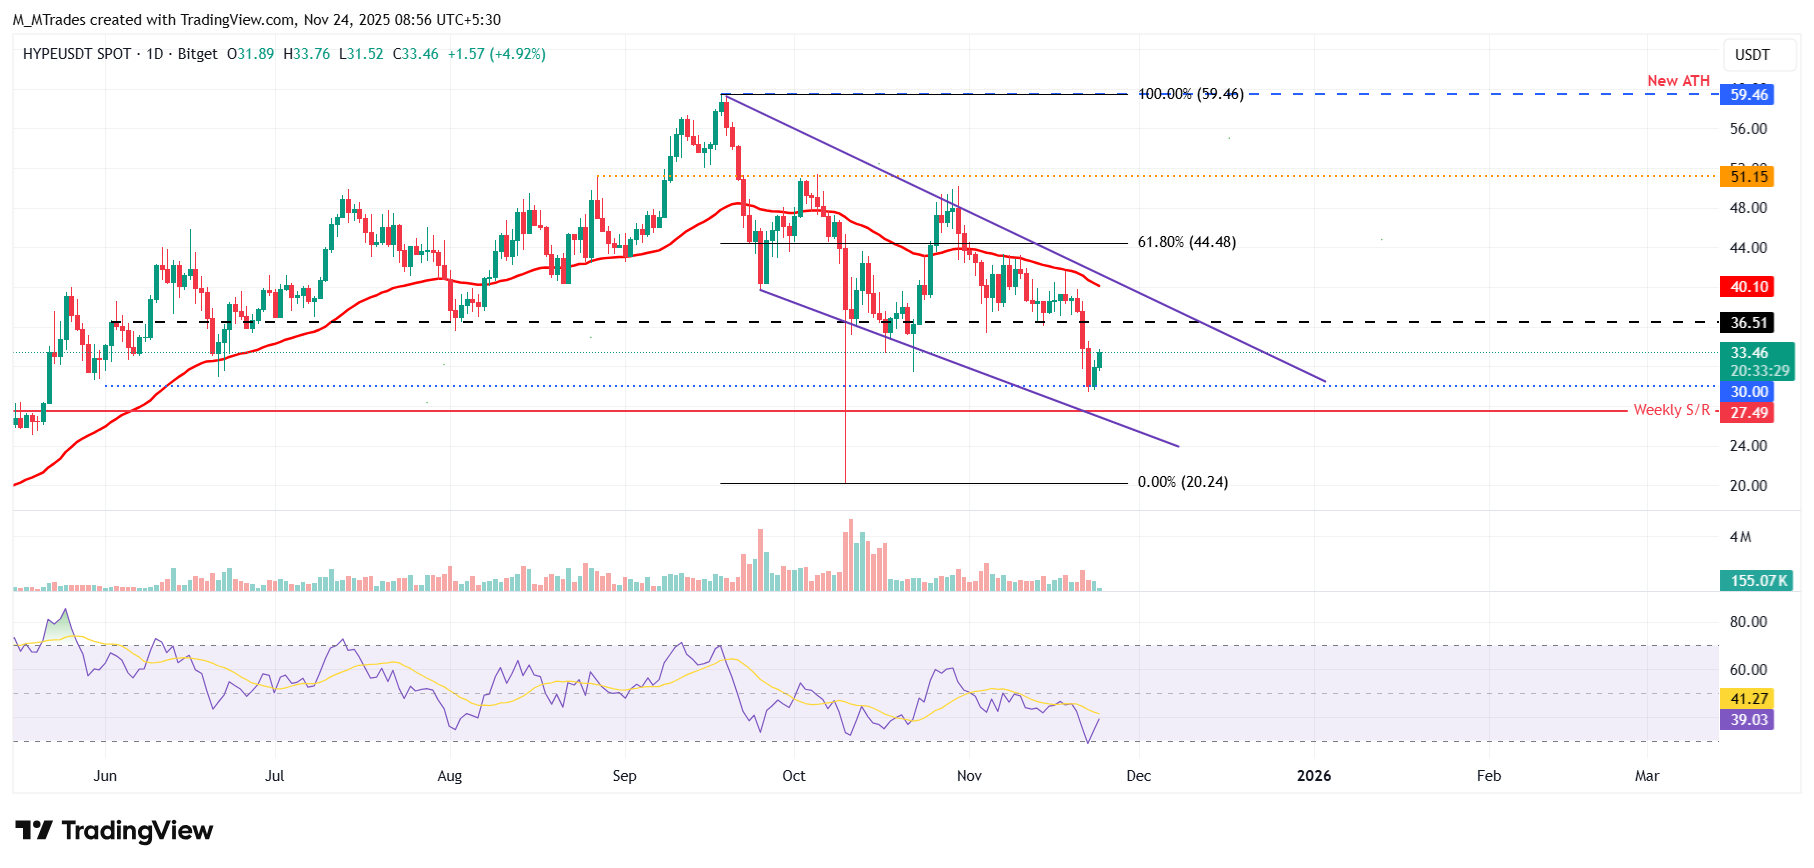
On the other hand, if HBAR faces a correction, it could extend the decline toward the key support at $30.
SPX6900 momentum indicators show early signs of recovery
SPX6900 price retested the October 10 low of $0.445 on Saturday and recovered 9.5% the next day. At the time of writing on Monday, it extended its recovery, nearing the descending trendline around $0.525.
If SPX breaks and closes above the descending trendline, it could extend the rally toward the 50-day EMA at $0.803.
The RSI on the daily chart reads 39, pointing upward toward the neutral level of 50, indicating fading bearish momentum. For the recovery rally to be sustained, the RSI must move above the neutral level. The MACD indicator also showed a bullish crossover last week that remains intact, further supporting the recovery thesis.
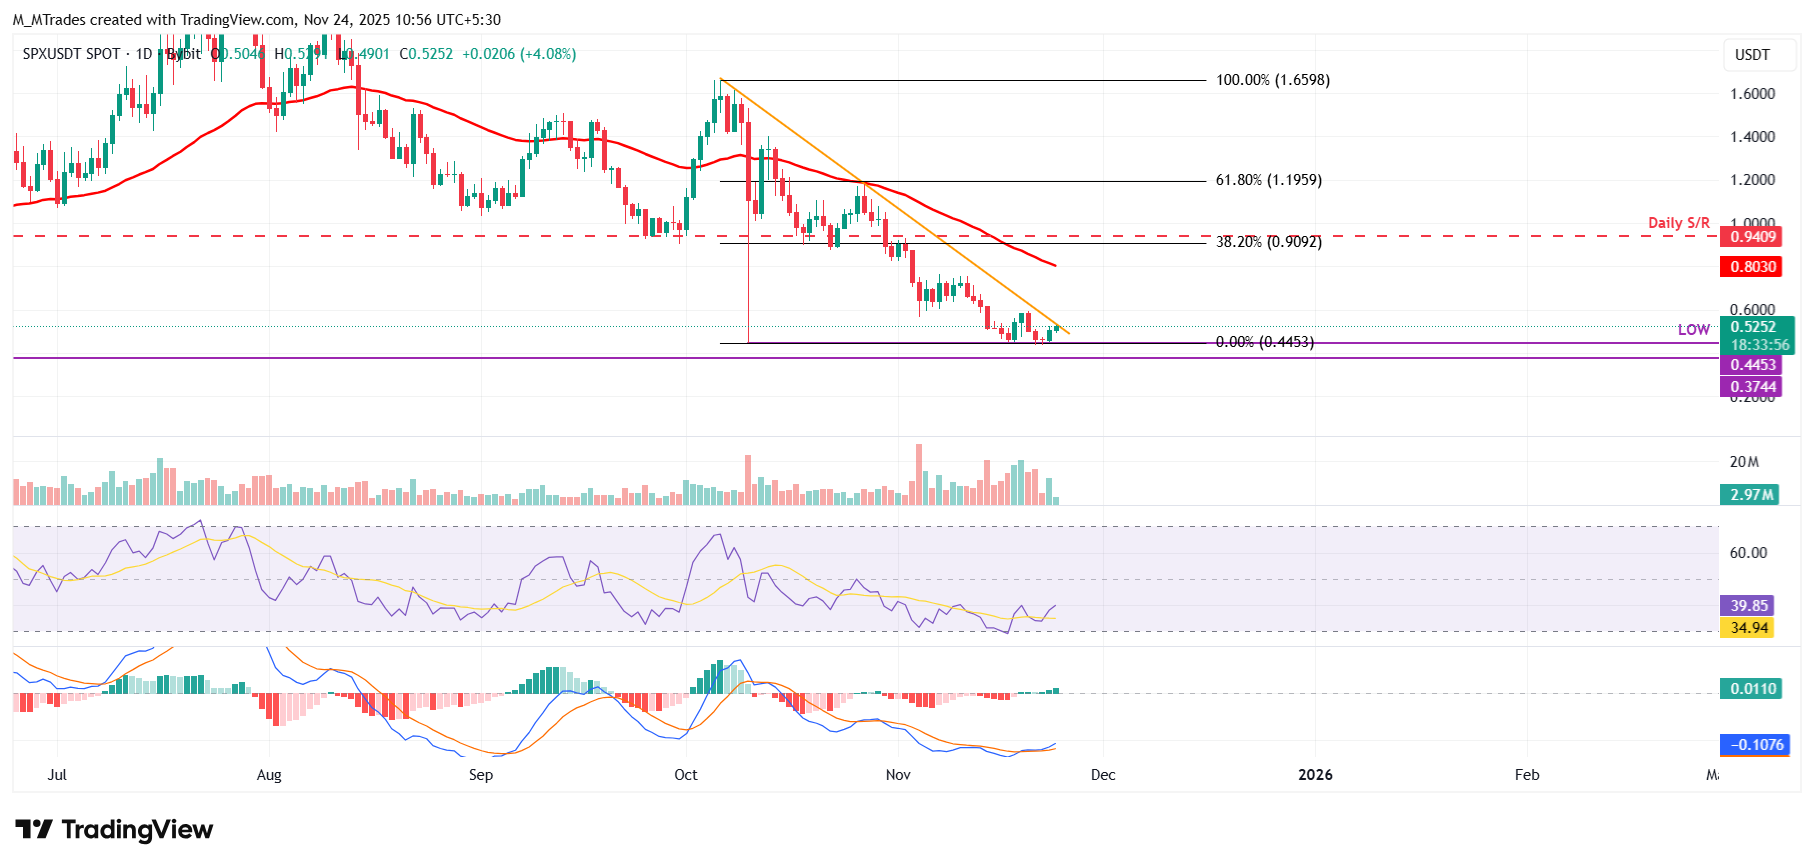
On the other hand, if SPX faces a correction, it could extend the decline toward the next support level at $0.374.
Author

Manish Chhetri
FXStreet
Manish Chhetri is a crypto specialist with over four years of experience in the cryptocurrency industry.



