Top 3 price predictions on Bitcoin, Ethereum & EOS for today: BTC/USD, ETH/USD and EOS/USD short-term analysis
- Bitcoin is fighting with the Diamond formation's ceiling described yesterday
- Ethereum is breaking above the Triangle formation and keeps outperforming BTC

We're analyzing three Cryptocurrencies in totally different situations today. EOS is retracing after a big 350% surge in about 20 days, Bitcoin is failing to break above its current formation and has set a Doji 4-hour candle while Ethereum does indeed breakout despite a generally subdued trading day in the Crypto sphere.
ETH/USD 4H chart
-636609402093345946.png)
Ethereum has been able to break above the Triangle formation that had been containing its price, trading above a resistance at $698 and the latest relative high at $711.50. All the moving averages are showing bullish inclination and pushing the price up to the next resistances, located at $756, $811.63 and finally at $869.80.
Below there, the first support is at the aforementioned $698 mark, followed then by the $680 and finally the $657.60 support. If that last one is lost, Ethereum's bullish outlook would be severely damaged.
MACD in the Ethereum 4-hour chart is open and has gathered inclination, following the bullish breakout movement. This is supporting more rises in ETH/USD.
Directional Movement Index in the same chart is showing buyers taking a nice advantage over the sellers. These last ones are retreating and reject this movement as a good sell-on-rallies opportunity. Positive structure for the price with only a certain lack of trend strength damaging the outlook, although still below the 20 level and therefore lacking steam.
BTC/USD 4H chart
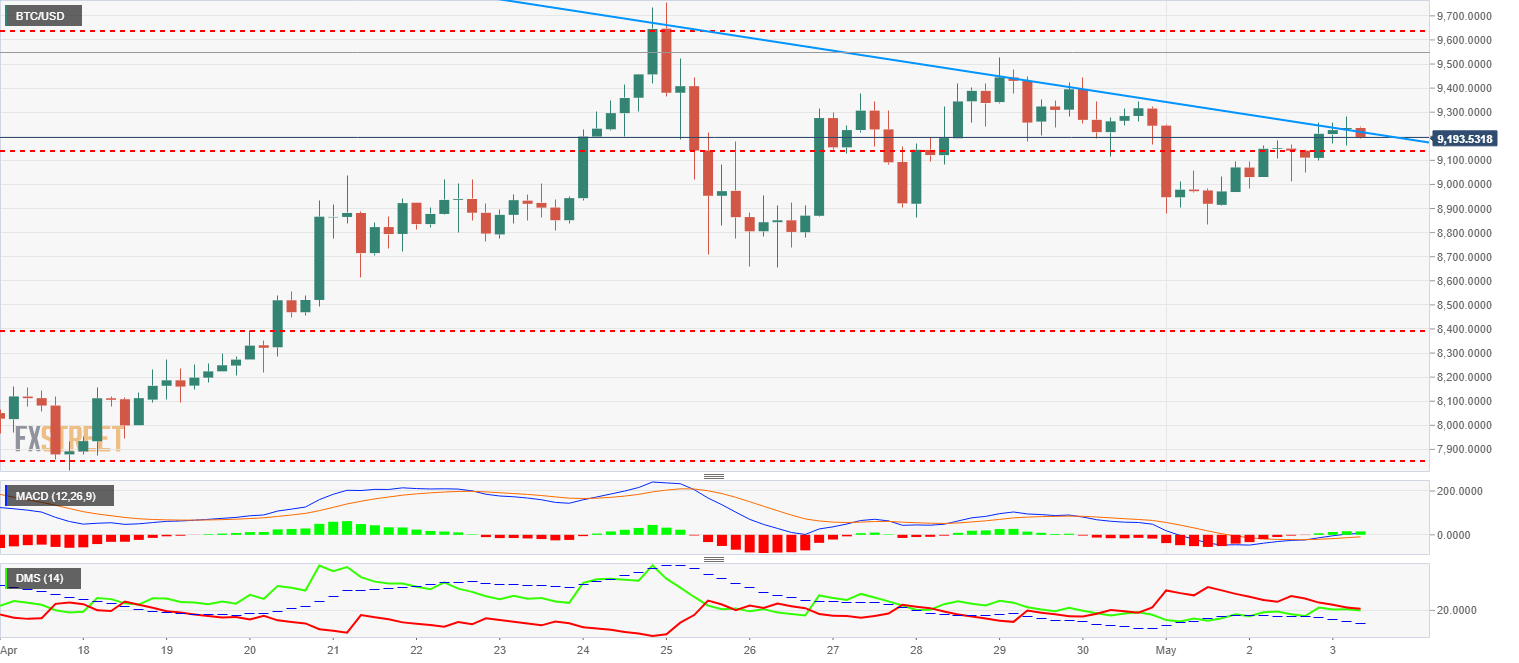
BTC/USD has been trading for 16 hours in a tight range between the top-right side of the Diamond in the $9210 mark and a price support at $9147. Bitcoin price action will be dictated by which side falls, so it's a good opportunity to make decisions.
On the upside, BTC/USD needs a close above $9281 to increase its bullish profile, that would get confirmed with a close above $9533. Only after breaking above the relative high at $9641 a new bullish leg will be properly set, though.
Below there, the aforementioned support at $9147, followed by the $8800 level and much lower, the $8400 mark. Reaching those levels would take the price back to the right vertex of the Diamond, right at $8000.
MACD in the Bitcoin 4-hour chart has not been able to clearly break above the 0 line, showing the weakness in the asset that doesn't have the potential to break the current formation to the upside.
Directional Movement Index in the same chart shows buyers and sellers tied in the 20 level, both sides with a certain strength but only one will prevail. ADX, though, is trading well below that level, making it clear that Bitcoin price currently lacks any trend strength.
EOS/USD 4H chart
-636609402696343118.png)
EOS has been one of the main movers in April, with a 360% surge. May has brought the expected correction, with a similar range amplitude.
EOS/USD is now trading at $17.60, a price support that touches the 50-EMA in the 4-hour chart. Below there, there is support at $16.30 and a bit below at $15.60. It's not a likely target, but if that level was lost, then the third support would be found at $13.40.
On the upside, there is a meaningful resistance at $18.71, followed by other targets at highs: $21.50 and $22.50.
MACD in the EOS 4-hour chart shows a profile favorable to the continuity of the current retracement in the next 4 or 5 periods (20-to-24 hours). After that, we should re-evaluate the situation.
Directional Movement Index in the same chart shows a very similar profile than Bitcoin, despite being in a very different price scenario. The main difference here is that ADX is trading slightly above 20, so volatility should continue and price ranges will keep being wide.
Author

Tomas Salles
FXStreet
Tomàs Sallés was born in Barcelona in 1972, he is a certified technical analyst after having completing specialized courses in Spain and Switzerland. He expanded his technical training following the guidance of great experts on the financial markets.




