Top 3 price predictions for Bitcoin, Ethereum, and Ripple for April 30: short-term analysis
- Lateral action in the main Cryptocurrencies over the weekend, consolidation after last two weeks
- Ethereum shows exhaustion, losing momentum against Bitcoin

The main Cryptocurrencies reached and broke above important resistance levels during the last week, which seems to have stalled the moves as there has been little action since.
Returning formations appeared in the daily Crypto charts on April 25th, setting resistance levels that have not been breached and are weighing negatively in the analyses. On the bullish side, supports conquered have been untouched, which is good news for bulls. In the short term, uncertainty remains.
BTC/USD daily chart
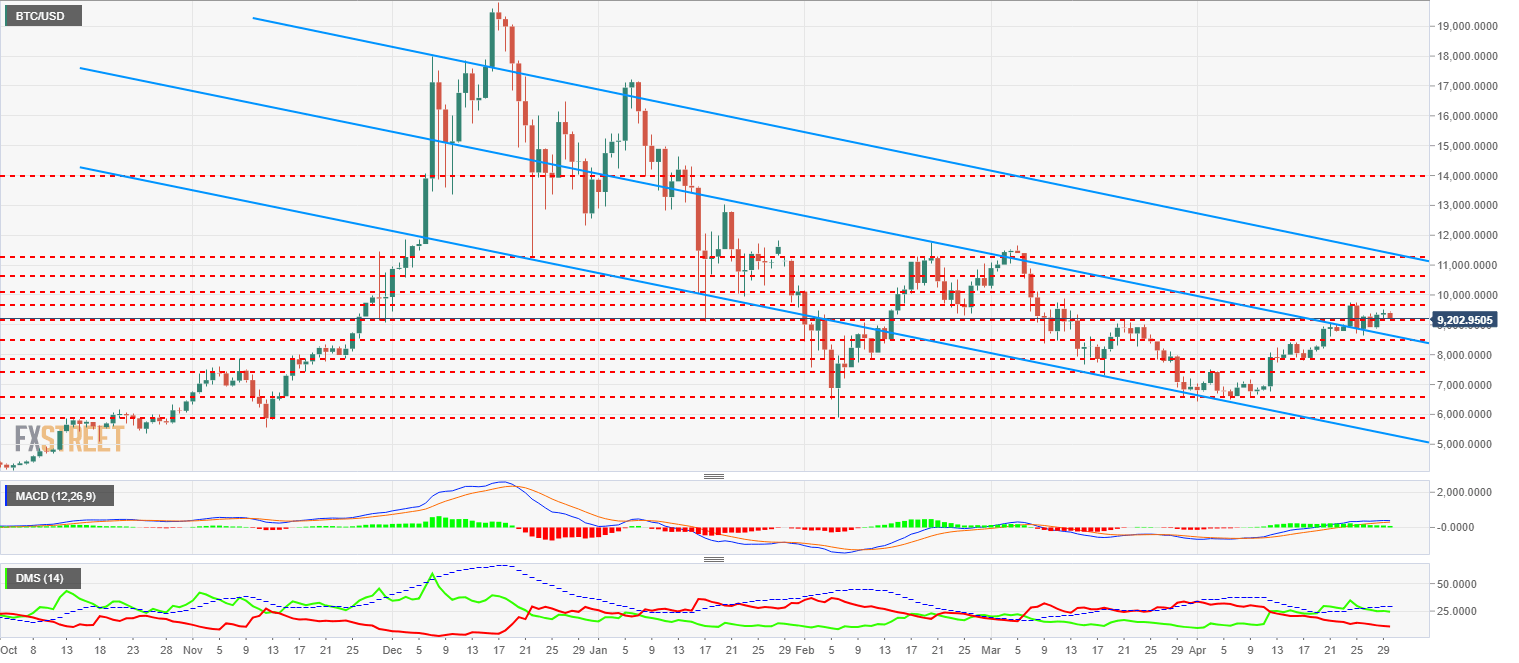
BTC/USD is trading around $9218 in the European morning, an intermediate area in the last 4 days range. Last Wednesday, the daily chart left us an important bearish cover, leaving a high at $9757 which is the main target point for any bullish attempts.
On the upside, resistance is at the mentioned $9757 level, followed by $10132, $10634 and as the main target, $11271. On the bearish side, the first support is at $8792, the bearish candlestick low, followed by $8458 and $7922.
MACD in the Bitcoin daily chart shows a loss of steam which is reasonable, looking to confirm and consolidate the previous rises before trying to go for more bullish legs.
Directional Movement Index in the same chart shows the sellers in retreat, with no confidence in hypothetical meaningful sells. Descent in buyers' numbers is very slight and continues to be at weak levels of trend strength.
ETH/USD daily chart
-636606774787897374.png)
Ethereum is showing the same technical picture than Bitcoin. A negative formation in the daily chart appeared last April 25th. The current formation has not been broken to the bullish side either, so it's still fully valid. The level to break is at the $703.85, followed by a continuation to the resistance levels located at $755.49 and $812.04.
Below there, intermediate support at $659.05, followed by the bearish candlestick lows at $621.33. That is a level to watch, as if ETH/USD breaks below it, the technical landscape would change to a bearish continuation pattern.
MACD in the Ethereum daily chart shows lack of strength, reasonable after the important rises of last weeks. The indicator is moving inside bullish territory, but with a continuation profile and consolidating the levels reached.
Directional Movement Index in the same chart shows a weaker configuration than in the Bitcoin one, with sellers retreating after having sold strongly last April 25th. Buyers also reacted to the bearish formation increasing their activity. Buyers still are at high levels but retreating as the days go without a clear direction.
XRP/USD daily chart
-636606775107277271.png)
Ripple has not been able to develop into price action the positive news its platform has been producing the last days. Ripple Ltd. is delivering positive messages with regards to the distribution of the cryptocurrency and the adequation to the legal requisites of the regulators.
Technically, XRP/USD left a strong formation last April 25th, consolidated by a Doji candle yesterday that might bring today another important bearish signal.
On the upside, resistance is located at $0.85, followed by $0.88 and $0.95. Supports are at $0.80, followed by $0.7696. Below there, the main support is located in the 50-EMA, trading around $0.75.
MACD in the Ripple daily chart is trading in the bullish segment of the indicator, but with a bearish cross that will be confirmed if today doesn't bring a positive close.
Directional Movement Index in the same chart is indeed showing the sellers trying to regather their edge, while buyers are not convinced of their possibilities.
Author

Tomas Salles
FXStreet
Tomàs Sallés was born in Barcelona in 1972, he is a certified technical analyst after having completing specialized courses in Spain and Switzerland. He expanded his technical training following the guidance of great experts on the financial markets.


