Top 3 price prediction for Bitcoin, Ethereum & Ripple: knocking on bullish heaven doors
- Bitcoin is finding an extremely tough resistance with an 18-indicator confluence barrier in a very tight range
- Technical picture to improve a lot if such resistance is broken

The Top3 Cryptocurrencies are trading just below very important resistance levels. These are the levels that separate these Cryptos from a strategic change of scenario that would probably bring us a very bullish second half of the year.
BTC/USD 4H chart
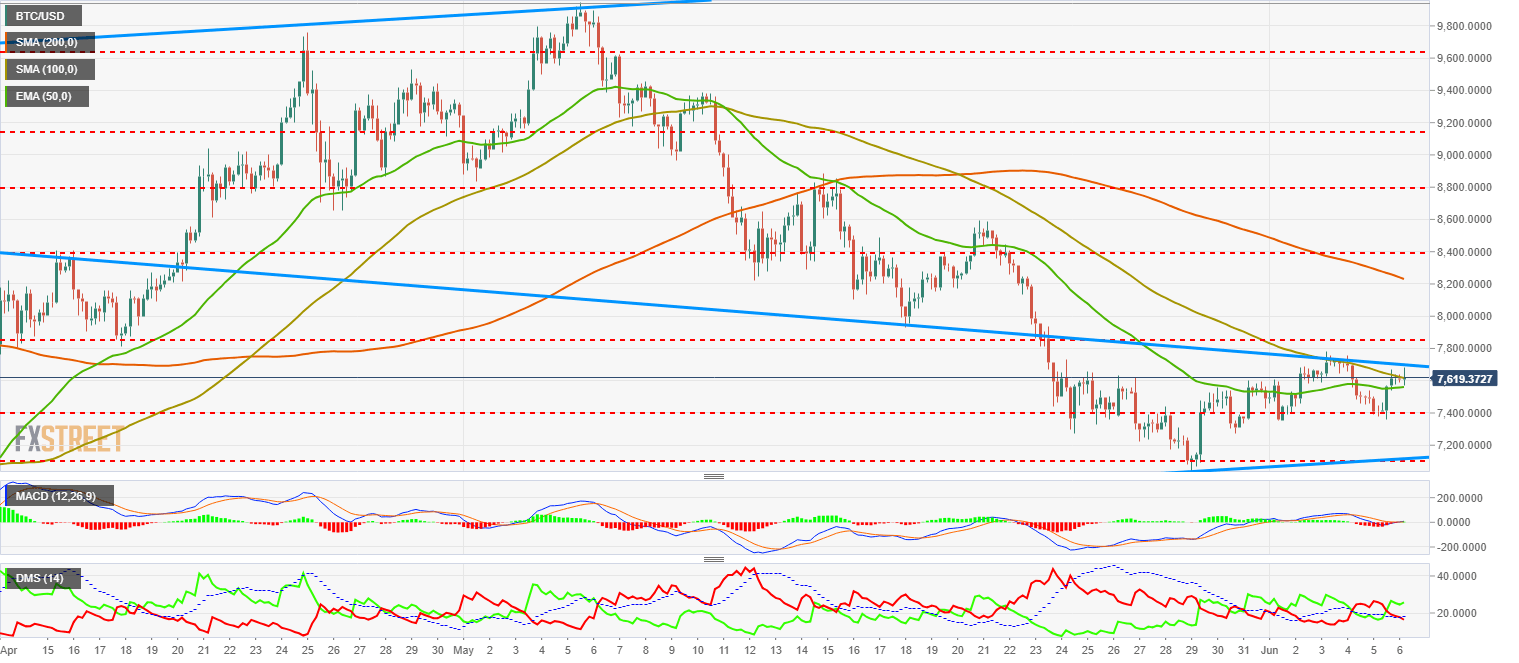
The lateral behavior proposed yesterday by Bitcoin's technical outlook is still ongoing, although BTC/USD has neared very important resistance levels. There is a strong confluence of technical indicators from different backgrounds and time-frames that doesn't seem easy to break. Moreover, there is also the trendline that stopped the price last week.
If Bitcoin bulls were able to pull it off and break these important resistances, they would find themselves with another price congestion resistance at $7855 as a previous step to meeting the 200-SMA, probably at $8150.
Below the current price, we have immediate supports at the 50-EMA and the 100-SMA between the $7560 and the $7600, which if lost would take BTC/USD back to the $7400 level, its first solid support. Below such level, the base of the channel is at $7120.
MACD in the Bitcoin 4-hour charts has completed the pattern and is now resting crossed to the upside above the equilibrium line of the indicator. We could see erratic moves until we see a bullish breakout.
Directional Movement Index in the same chart shows buyers in control. Sellers have decreased its strength level a lot, while ADX is still flat, awaiting some price action.
ETH/USD 4H chart
-636638758147264149.png)
Ethereum has met again the trendline that acts as the ceiling of the bearish channel that has been containing the price since the end of April. This second challenge has better chances of succeeding, as indicators are now regulated and much better prepared for a bullish breakout.
On the upside, beyond the aforementioned trendline, the first resistance is at $619. Above there, it will probably find another price congestion resistance at $660, although once that level is reached, the 200-SMA will probably below there, so it might be a previous obstacle to break.
On the downside, similar situation than in Bitcoin: first support is at the 50-EMA and the 100-SMA, between $594 and $596. If such support is lost, next target would be at $565 and finally the $530 mark, just at the trendline that crosses the bullish channel.
MACD in the Ethereum 4-hour chart shows a similar profile than Bitcoin, although still not crossed to the upside. As of now, lateral scenario in place with all the bullish potential recovered.
Directional Movement Index in the same chart shows the buyers in the drivers' seat, but in this case, the sellers have not been defeated and are still at pretty high levels. ADX, just as in the Bitcoin case, is awaiting the price action to react.
XRP/USD 4H chart
-636638758438368646.png)
Ripple, as its Crypto partners, is also positioned just below very important resistances. XRP/USD was able to briefly break above there this week, but the bullish breakout attempt was rejected. Right now, it doesn't seem that this breakout should come suddenly, as it still has some room below to prepare another bullish attempt under better circumstances.
On the upside, first resistance is located at $0.68, followed afterward by another technical barrier at $0.685. Moreover, adding another meaningful barrier, the 200-SMA is set at $0.69.
On the downside, the first support is at $0.661, followed by the 50-EMA and the 10-SMA, located between $0.642 and $0.629. Between both moving averages, we can find a price congestion support at $0.632.
This is a complex scenario for Ripple, but bulls are very close to getting into a very favorable territory.
MACD in the Ripple 4-hour chart has not been able to rest above the 0 line, but it has indeed flattened its curve quite a lot and seems ready now to position itself to the upside. It doesn't have much room to grow though.
Directional Movement Index in the same chart shows the buyers in control, while sellers still have not surrendered and are keeping its bearish stakes at high levels. ADX is still at high levels, but with a downward trend.
Author

Tomas Salles
FXStreet
Tomàs Sallés was born in Barcelona in 1972, he is a certified technical analyst after having completing specialized courses in Spain and Switzerland. He expanded his technical training following the guidance of great experts on the financial markets.


