Top 3 Price Prediction Bitcoin, Ethereum, XRP: Cryptos establish floor that will see new 2022 rally
- Bitcoin price action maintains a crucial support structure, performance lags behind ETH.
- Ethereum price is poised to close the week with a nearly 12% gain.
- XRP price congestion could end very soon, resulting in a strong breakout.

Bitcoin price action for the week mixed and indecisive when compared to ETH and the altcoin market. Ethereum price extends its rally from last week’s lows. XRP price looks to catch up with BTC and ETH by experiencing a rally of its own.
Bitcoin stays above $37,250 but underperforms the altcoin market
Bitcoin price has been mostly neutral throughout the week, with a marginal gain from the weekly open. Most importantly, BTC was able to close above the bottom of the Ichimoku Cloud (Senkou Span B). Despite the lackluster performance, the currently weekly candlestick close is enough to confirm last week’s bullish reversal candlestick (bullish hammer pattern).
The oscillators on the weekly chart support continued bullish momentum. The Optex Bands remain in extreme oversold conditions while the Relative Strength Index maintains support at the final oversold level in a bull market at 40. Additionally, the Composite Index is in a perfect position to begin a cross above its moving averages, creating a powerful bull signal when that does occur.
Upside potential going into the weekend is likely limited to the $41,000 to $42,000 value area. The 61.8% Fibonacci retracement, top of the weekly Ichimoku Cloud, 2022 Volume Point Of Control, and weekly Tenkan-Sen sit above Bitcoin between the price ranges of $41,200 and $43,250.
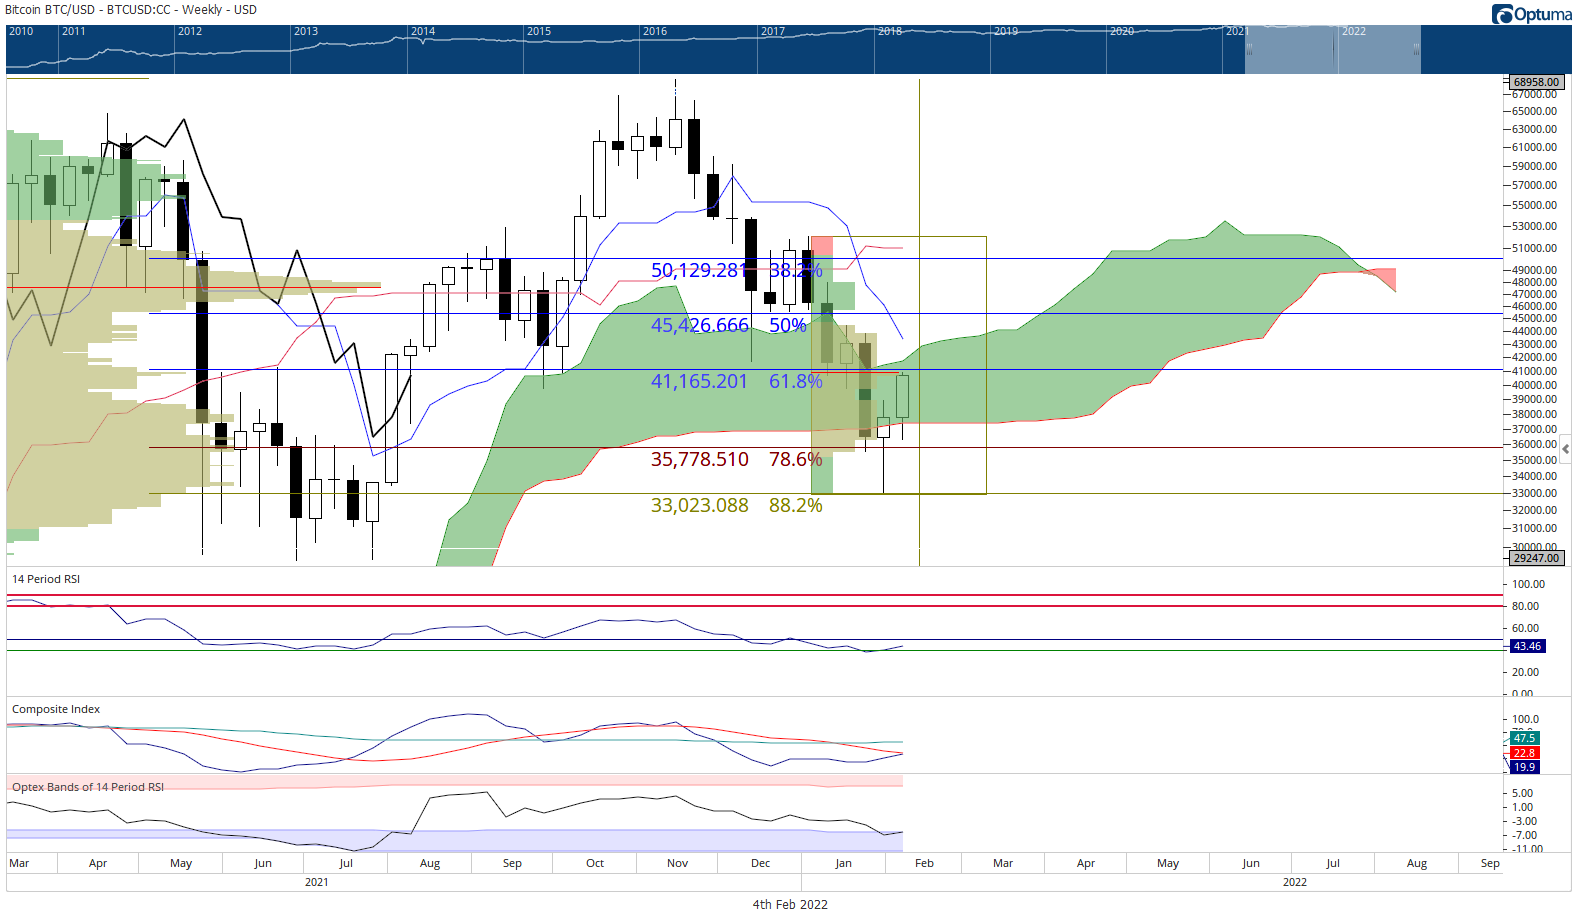
Any weekly close below the Cloud will invalidate any near-term to medium-term bullish outlook. A prolonged bear market will probably begin in that scenario.
Ethereum price approaches the critical $3,000 level
Ethereum price action throughout the week has been spectacular. Except for some selling pressure on Wednesday, ETH has done nothing but trudge higher and higher. From last week’s low, bulls have pushed Ethereum to a rally exceeding 32%. Furthermore, this weekly candlestick confirms the bullish reversal candlestick pattern from last week (the Dragonfly Doji).
Support against the 61.8% Fibonacci retracement and top of the Ichimoku Cloud (Senkou Span A) likely confirms a floor of support. The next target for bulls is the 50% Fibonacci retracement at $2,900 – but more likely, it is the critical and psychological price level of $3,000.
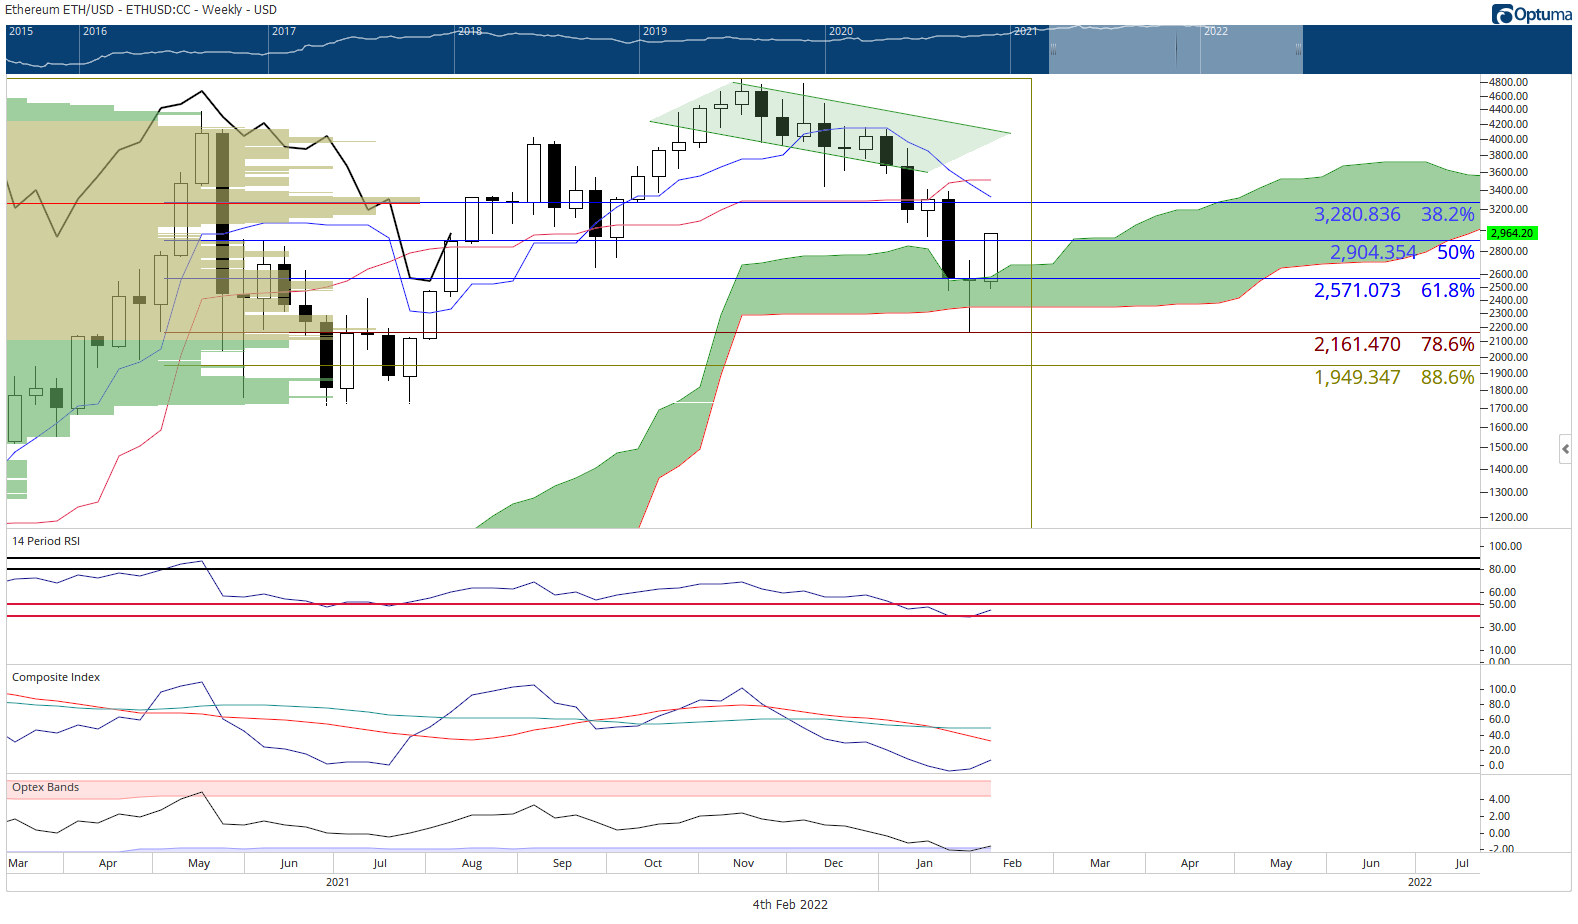
Downside risks, however, do remain and are likely limited to the $2,500 support level. Below that, Senkou Span B (bottom of the Ichimoku Cloud) is the next primary support zone at $2,300. All near-term Ethereum price bullish outlooks will be invalidated if a weekly close below the Ichimoku Cloud.
XRP price bullish breakout imminent
XRP price has spent the past eleven trading days inside a constricted trading range between $0.60 and $0.63, with few attempts to move above or below that range. However, the results of this consolidation have created a long opportunity on XRP’s Point and Figure Chart.
The hypothetical long trade setup is a buy stop order at $0.65, a stop loss at $0.61, and a profit target at $0.80. The entry is based on the breakout above a triple-top pattern that would develop at $0.64. It could also be interpreted as a split quadruple-top breakout.
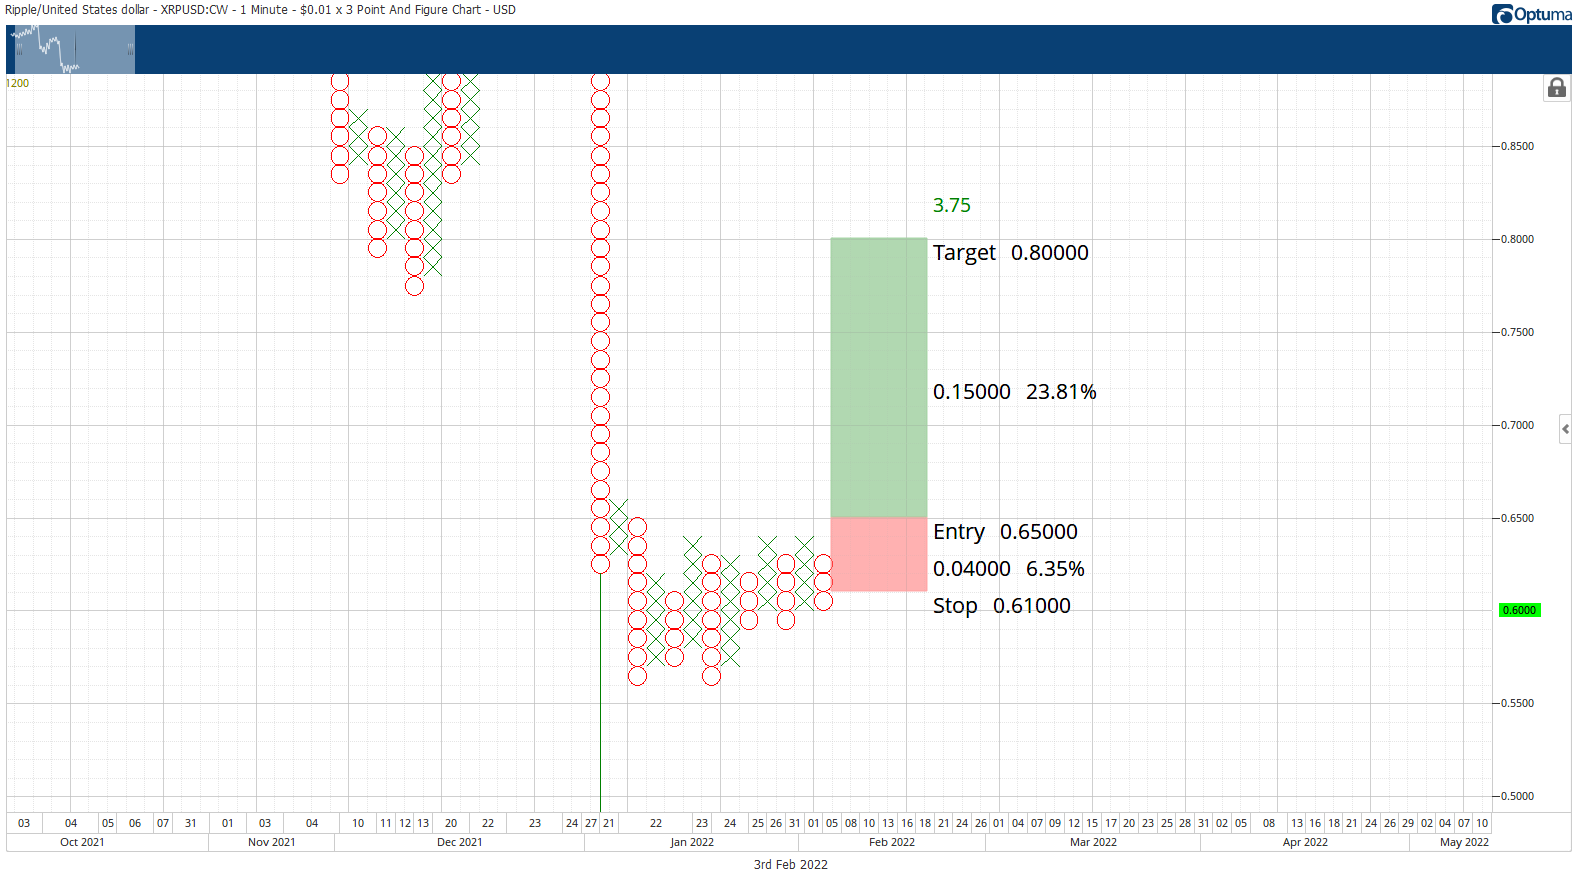
The long entry represents a 3.75:1 reward/risk with an implied profit target of nearly 24% from the entry. Because trades rarely reach their full profit target potential, a two to three-box trailing stop would help protect any implied profit. The XRP price trade is invalidated if the current O-column moves to $0.57.
Author

Jonathan Morgan
Independent Analyst
Jonathan has been working as an Independent future, forex, and cryptocurrency trader and analyst for 8 years. He also has been writing for the past 5 years.


