Top 3 Price Prediction Bitcoin, Ethereum, XRP: Crypto market prepares to spring bear trap
- Bitcoin price likely to fake-out traders expecting a seasonal/cyclical price collapse.
- Ethereum price quietly converts to a bull market on the Point and Figure chart.
- XRP price dependent on Ethereum and Bitcoin for directional bias.

Bitcoin price action completes six weeks in a corrective move, the second-longest corrective period of 2021. Ethereum price has shifted momentum, likely trapping traders who utilize Japanese candlesticks exclusively. XRP price action is stagnant and likely awaits a clear directional move from Bitcoin and Ethereum.
Bitcoin price shows early signs of a new uptrend, likely disappointing many short-sellers
Bitcoin price has begun the process of converting from a bear market on the $1,000/3-box Point and Figure chart to a bull market. The flash crash of December 5th brought Bitcoin to a low that was precisely on the neckline of a prior inverse head and shoulder pattern. The resulting price action has created an opportunity for a long entry.
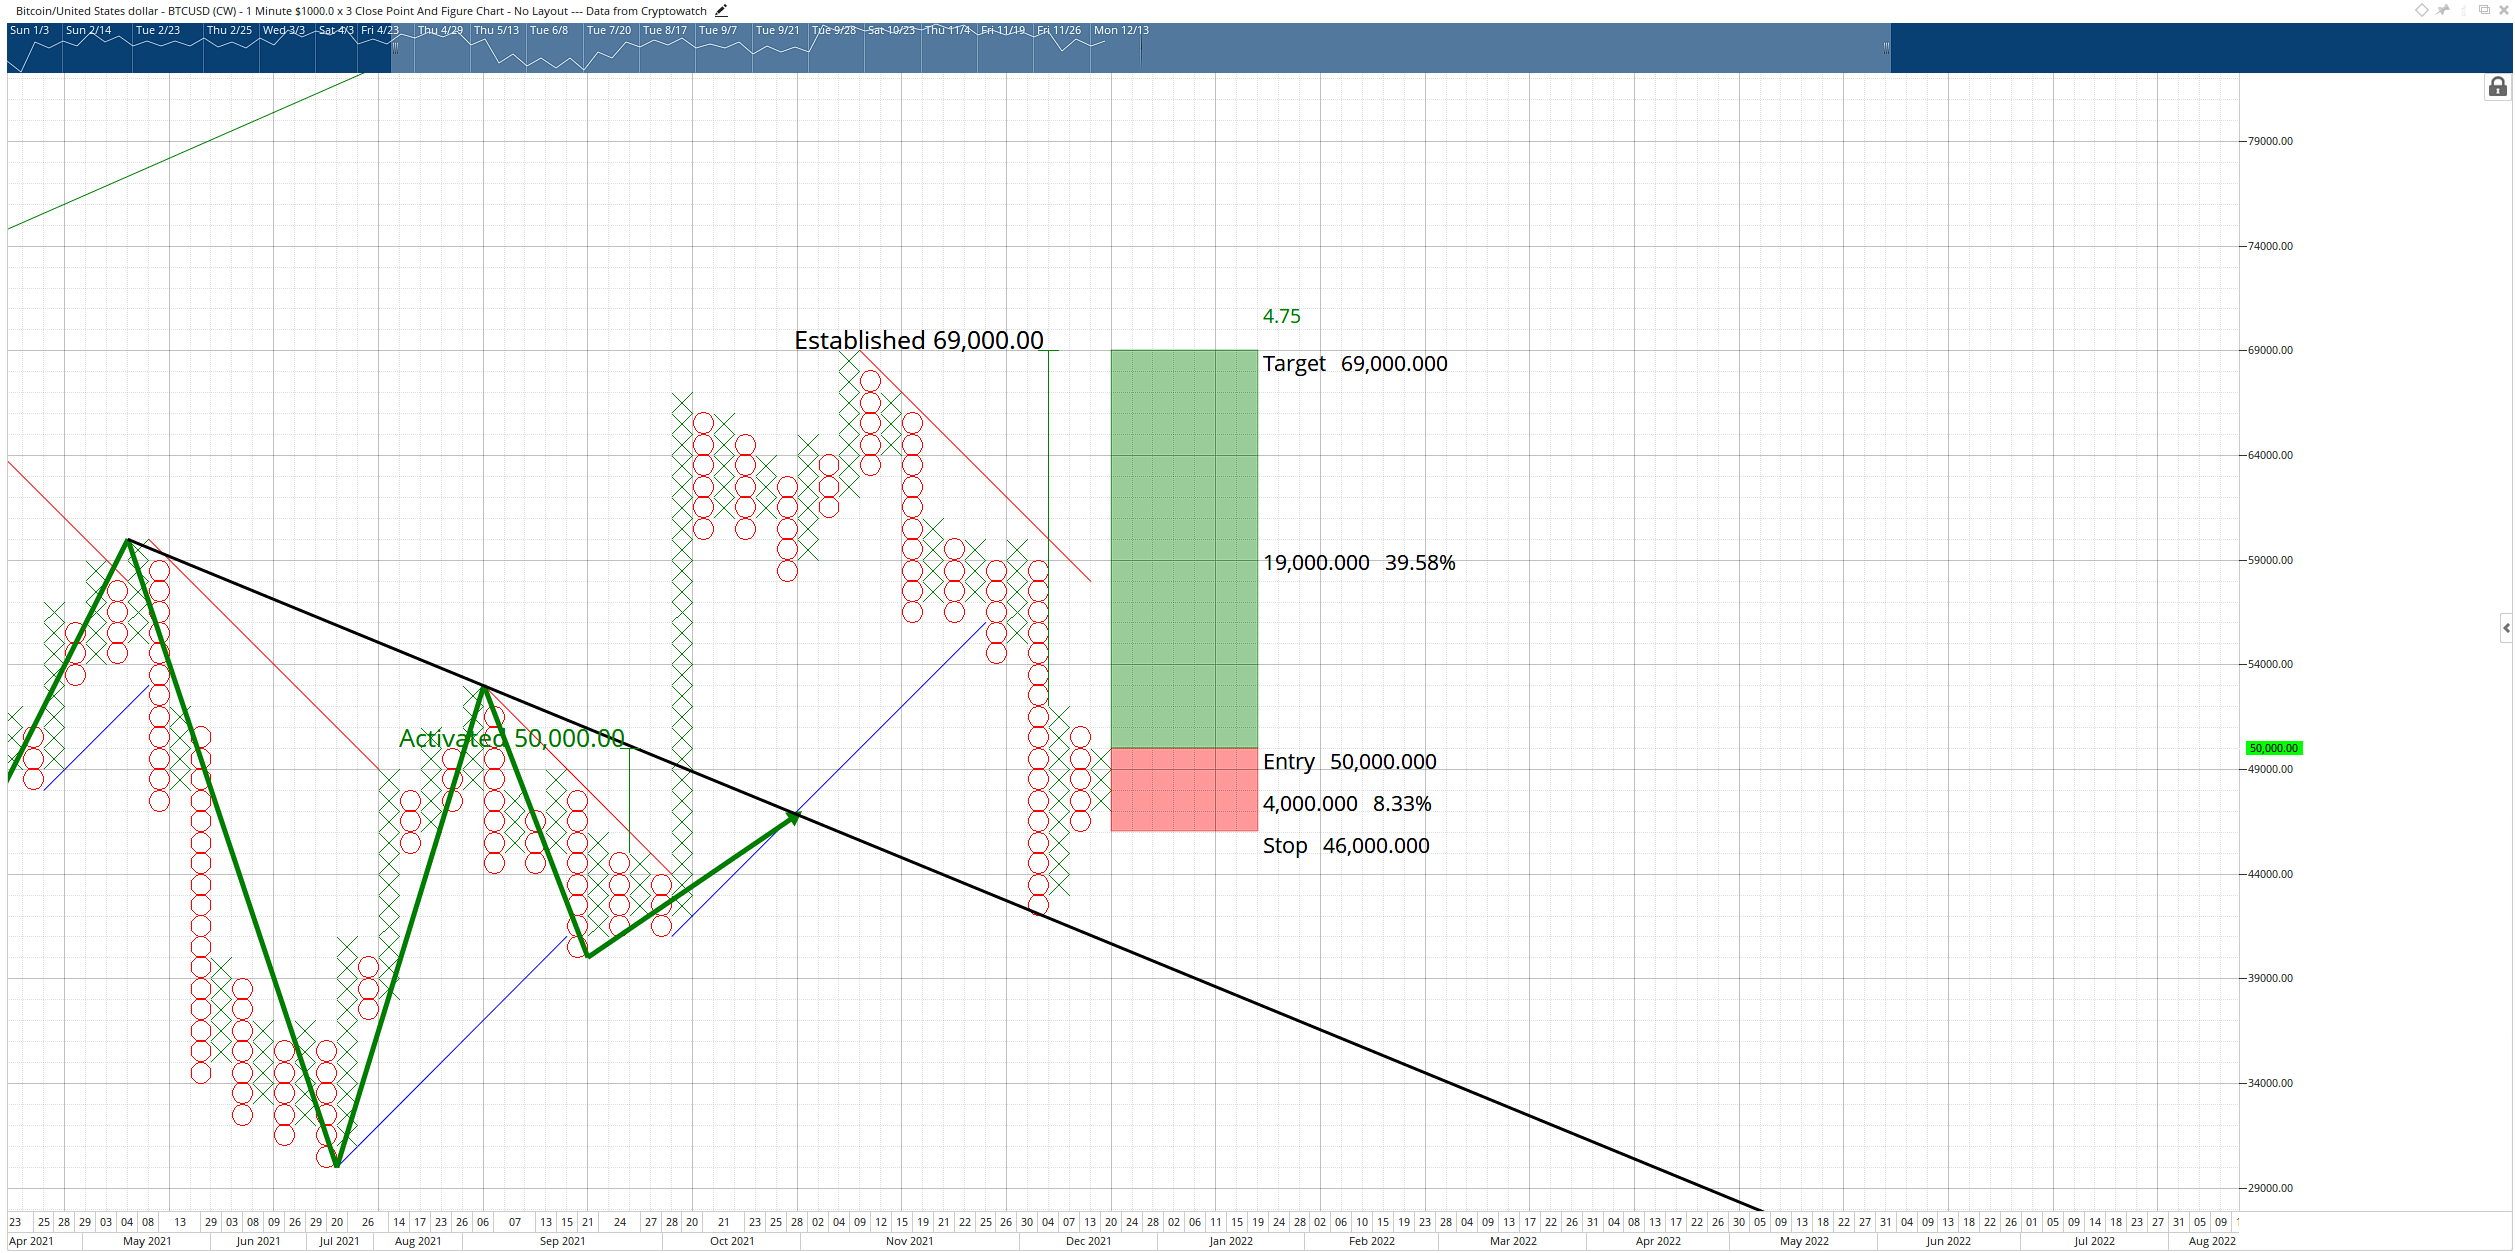
BTC/USD $1,000/3-box Reversal Point and Figure Chart
The hypothetical long entry is a buy stop order at $50,000, a stop loss at $46,000, and a profit target at $69,000. A two to three-box trailing stop would help protect any implied profits after the entry. This trade is invalidated if Bitcoin price drops to $40,000 before the entry would trigger.
Ethereum price action likely to trap bears
Ethereum price has shifted into a bull market after breaking above the prior bear market trendline at $4,150. This conversion leads the Japanese candlestick chart, which still shows a mix of bearish to neutral conditions. This development has generated a theoretical long opportunity for Ethereum.
The theoretical long entry is a buy stop order at $4,000, a stop loss at $3,750, and a profit target at $5,600. The long entry would be the first entry after the pullback from the conversion. This is a sign of significant strength on a Point and Figure chart.
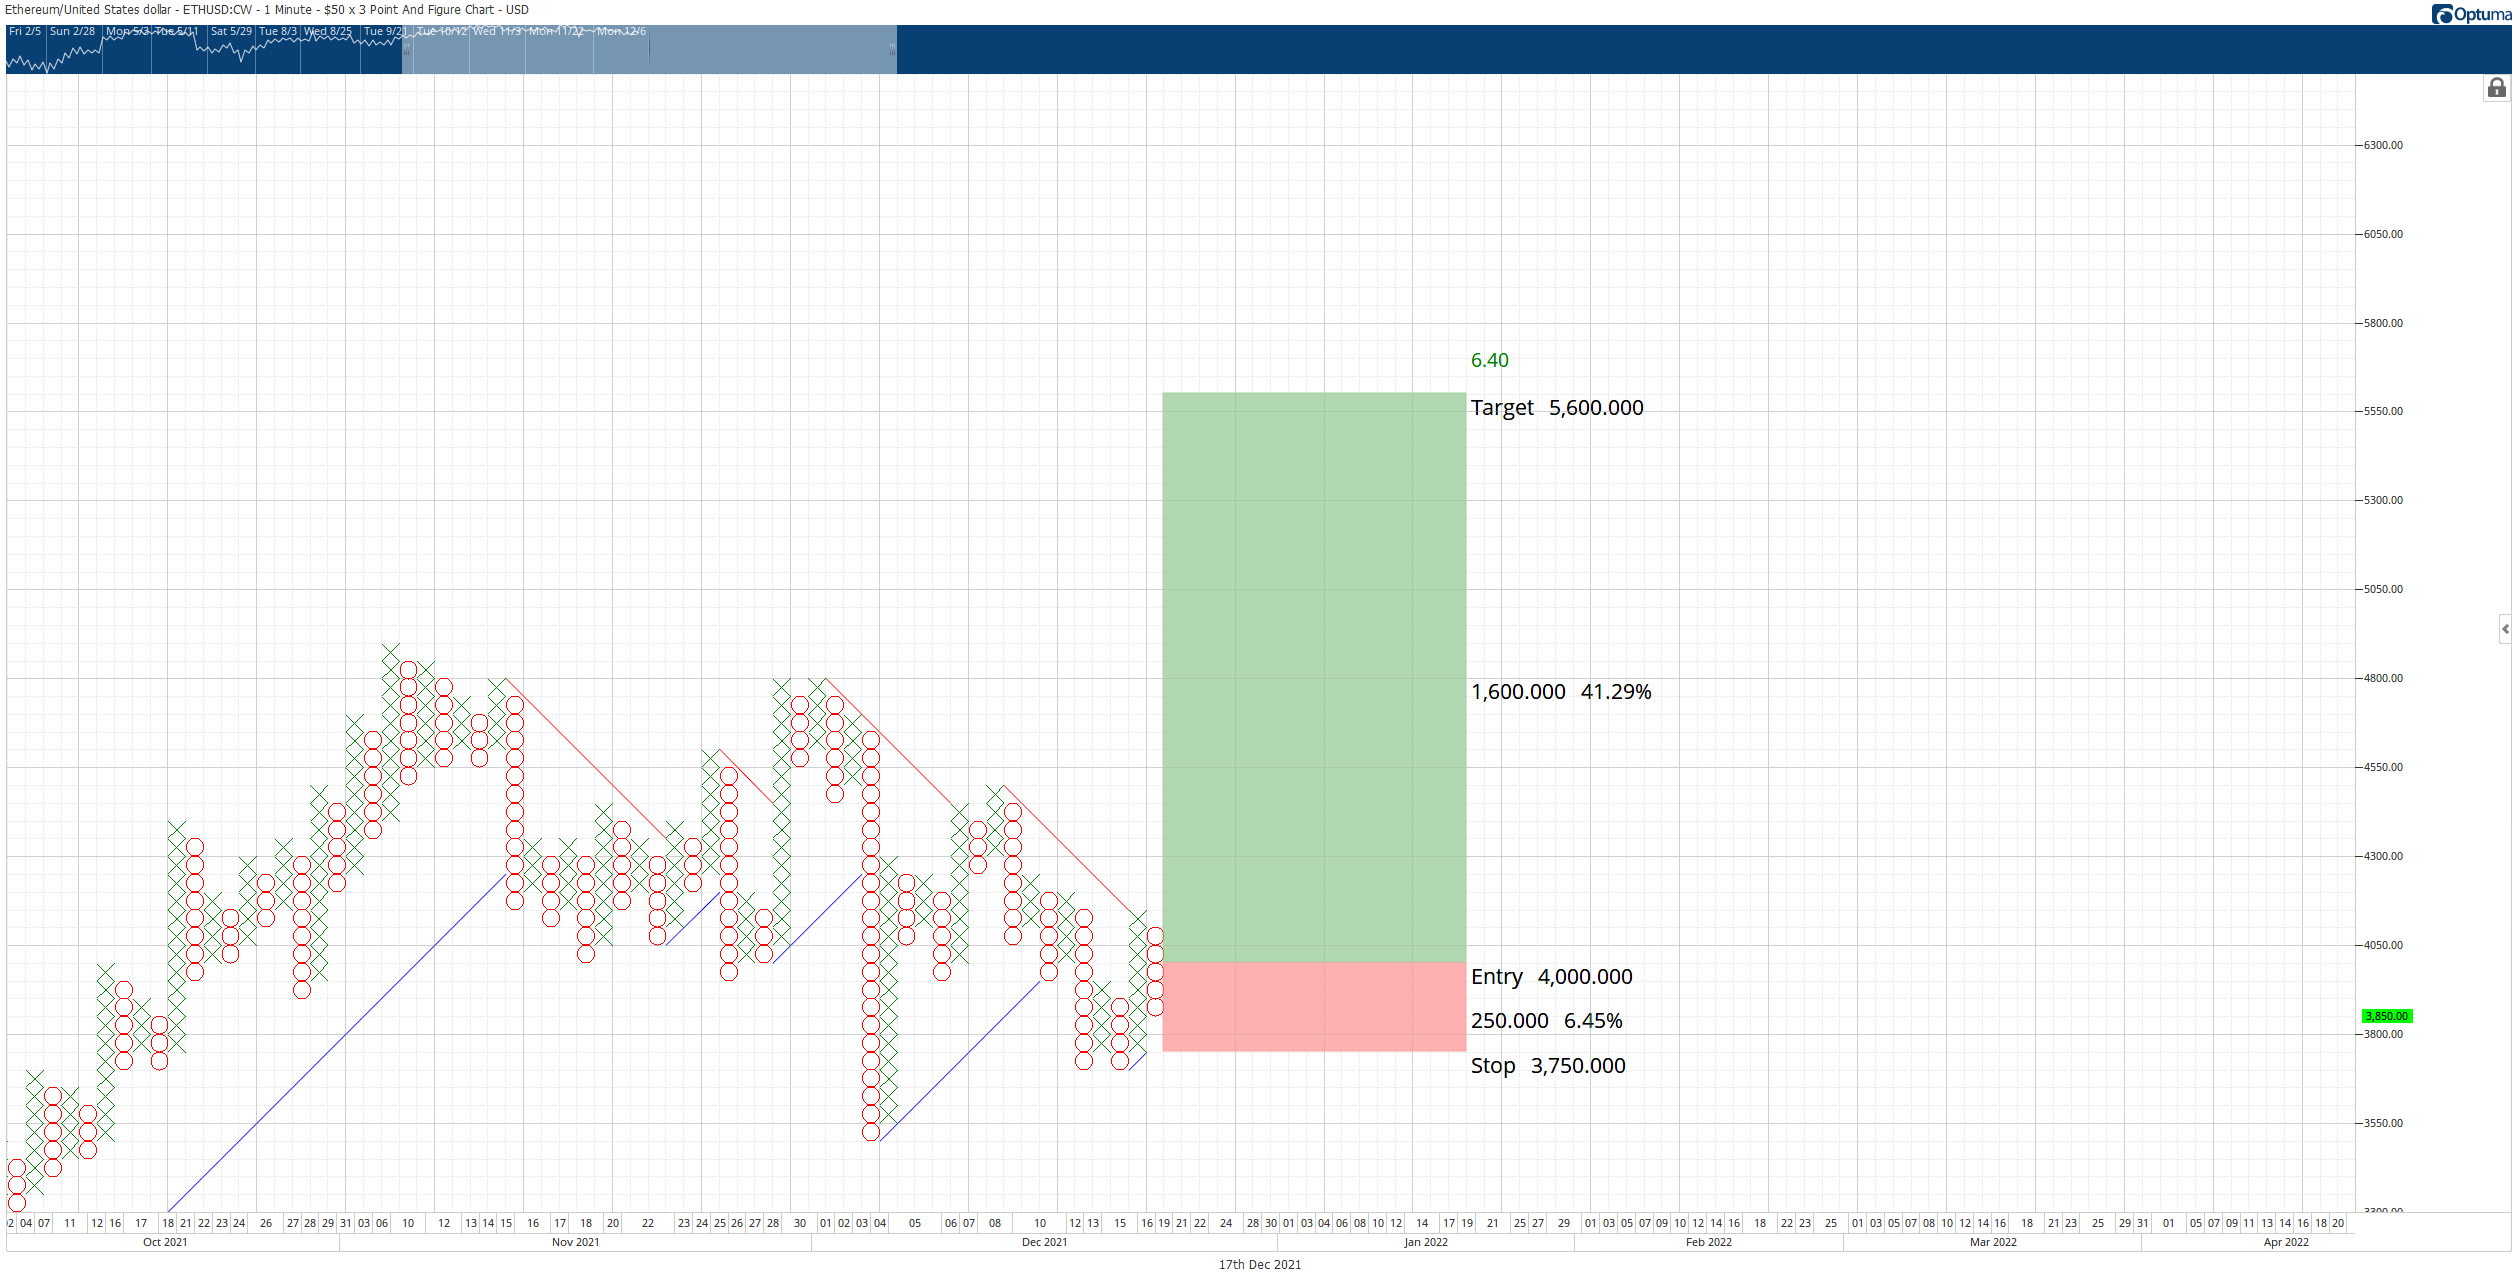
ETH/USD $50/3-box Reversal Point and Figure Chart
However, downside risks remain. Ethereum price must maintain a support level above the $3,700, or the current Point and Figure chart will return to bear market conditions. If that occurs, then Ethereum will likely return to the $2,800 - $3,000 value areas.
XRP price stuck in a tight range, directional bias unclear
XRP price has made little effort over the past ten trading days to establish a clear direction move beyond consolidation. It has developed strong support and range structure between the $0.75 to $0.80 price ranges. When compared to past XRP analysis, not much has changed.
The $0.05/3-box reversal Point and Figure chart shows the same pattern entry reviewed in past weeks. A hypothetical long entry would occur on the three-box reversal with a buy stop at $1.00, a stop loss at $0.80, and a profit target at $1.70. This trade idea has no invalidation point because the entry would trail further downside movement.
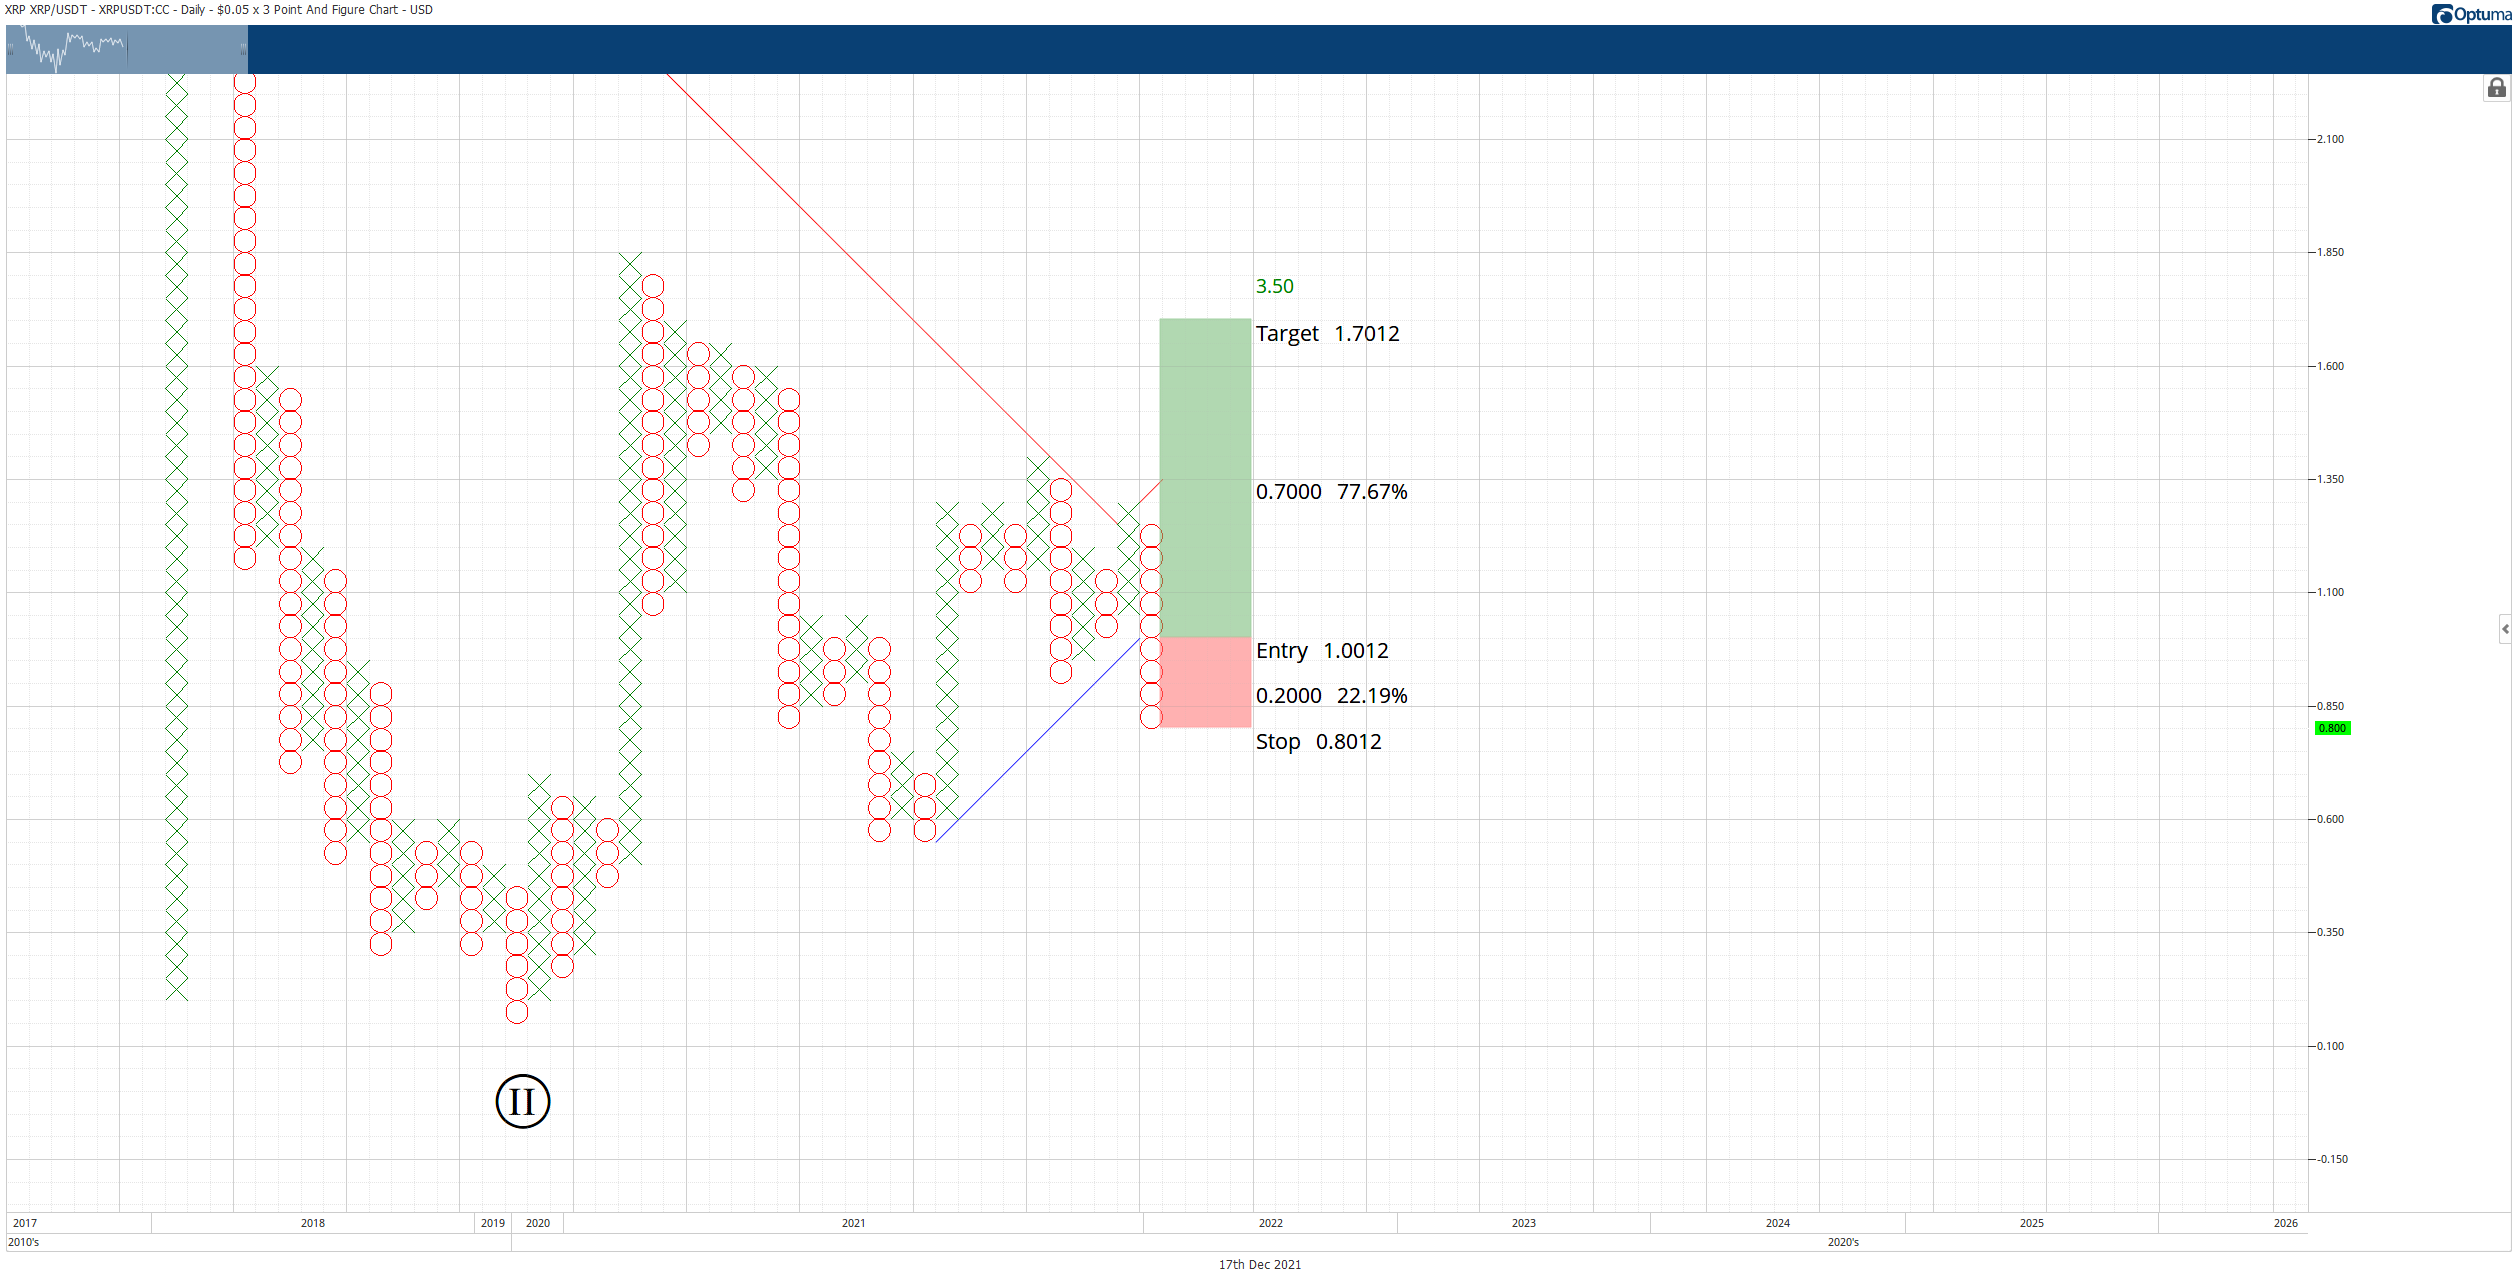
XRP/USDT $0.05/3-box Reversal Point and Figure Chart
If XRP bulls wish to prevent further downside movement, buyers will need to maintain near-term support. Failure to do so would probably trigger a move to the $0.50 value area.
Author

Jonathan Morgan
Independent Analyst
Jonathan has been working as an Independent future, forex, and cryptocurrency trader and analyst for 8 years. He also has been writing for the past 5 years.


