Bitcoin price positioned for major bullish breakout towards $69,000
- Bitcoin price is still recovering from the December 5th flash crash.
- Buyers have been able to keep prices above a capitulation zone – thus far.
- Significant bullish expansion moves ahead, but an equally bearish drive lower could occur if bulls fail.

Bitcoin price action has been flirting with a final support level that could see prices drop from $47,000 to $37,000 without much effort. The daily candlestick chart warns of continued bearish momentum, but the Point and Figure chart shows a path to rally Bitcoin higher.
Bitcoin price positioned to surprise short-sellers
Bitcoin price has been testing its final support zone near the $47,000 value area for the past twelve trading days. Bulls have become increasingly nervous, but a significant amount of buying and selling has occurred in the $47,000 to $49,000 price ranges. So much so that it is very close to creating a new 2021 Volume Point Of Control (prior was at $57,000.
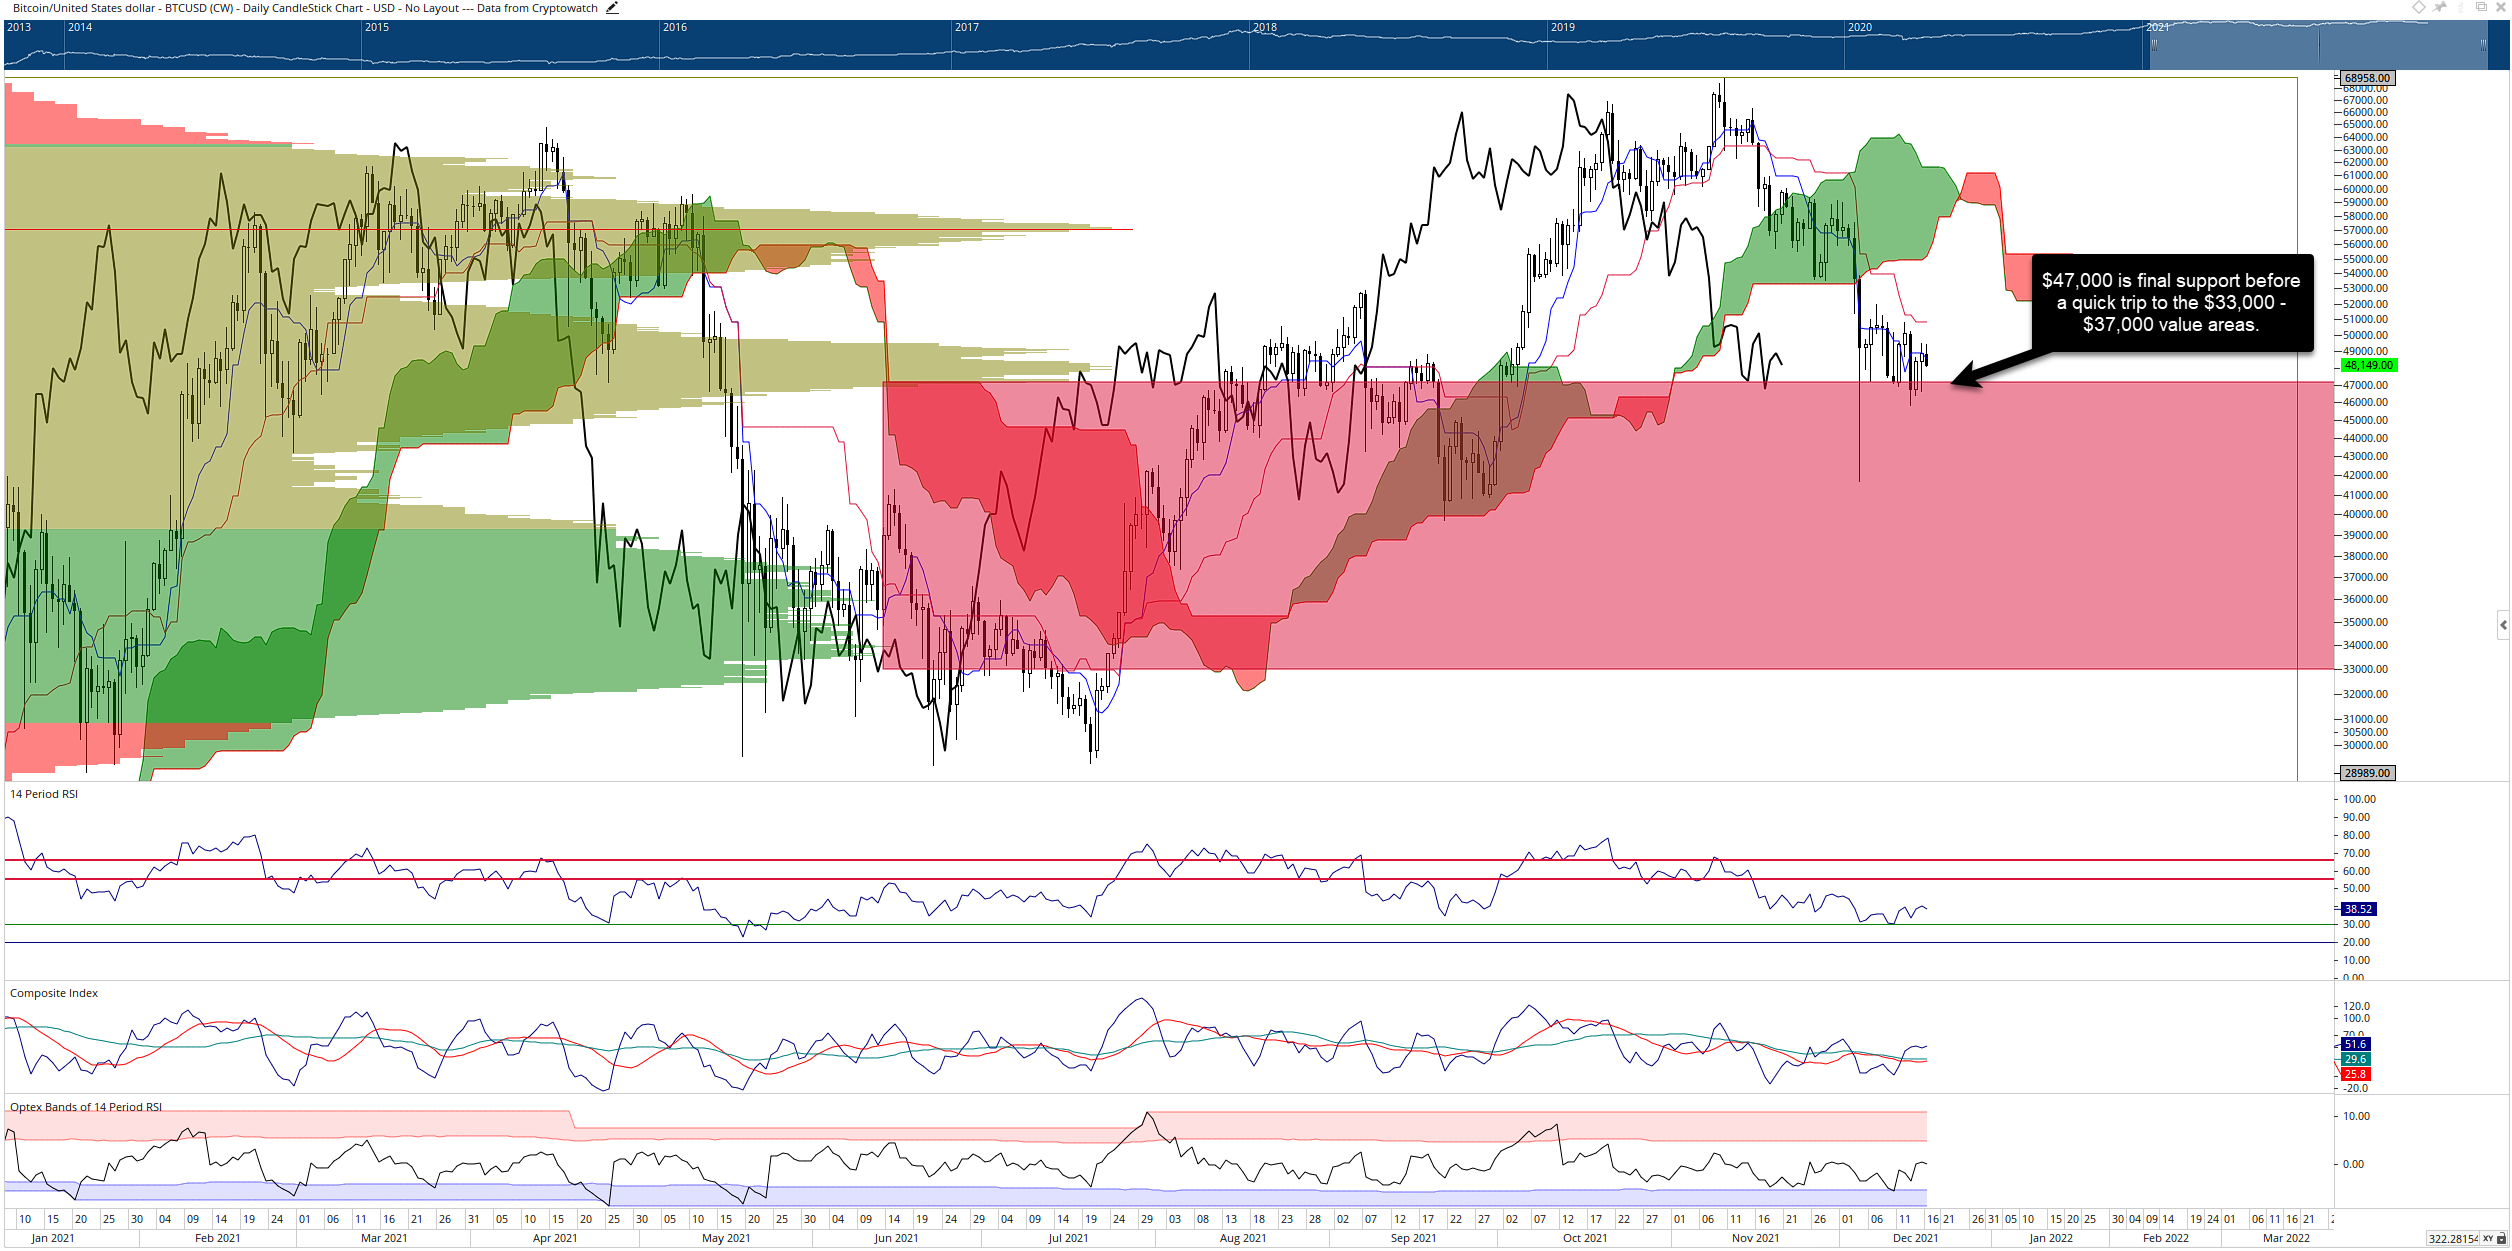
BTC/USD Daily Ichimoku Chart
The red highlighted zone on the candlestick chart represents a capitulation zone where the volume profile things out, and prices could travel through very quickly. If bulls fail to hold $47,000, a return to the $30,000s is almost inevitable. However, the Point and Figure chart may tell a different story.
The $1,000/3-box reversal Point and Figure chart show that a bullish reversal pattern is developing. The hypothetical long idea is a buy stop at $50,000, a stop loss at $46,000, and a profit target at $69,000. The profit target is derived from the Vertical Profit Target Method in Point and Figure Analysis. A two to three-box trailing stop would help protect any implied profits.
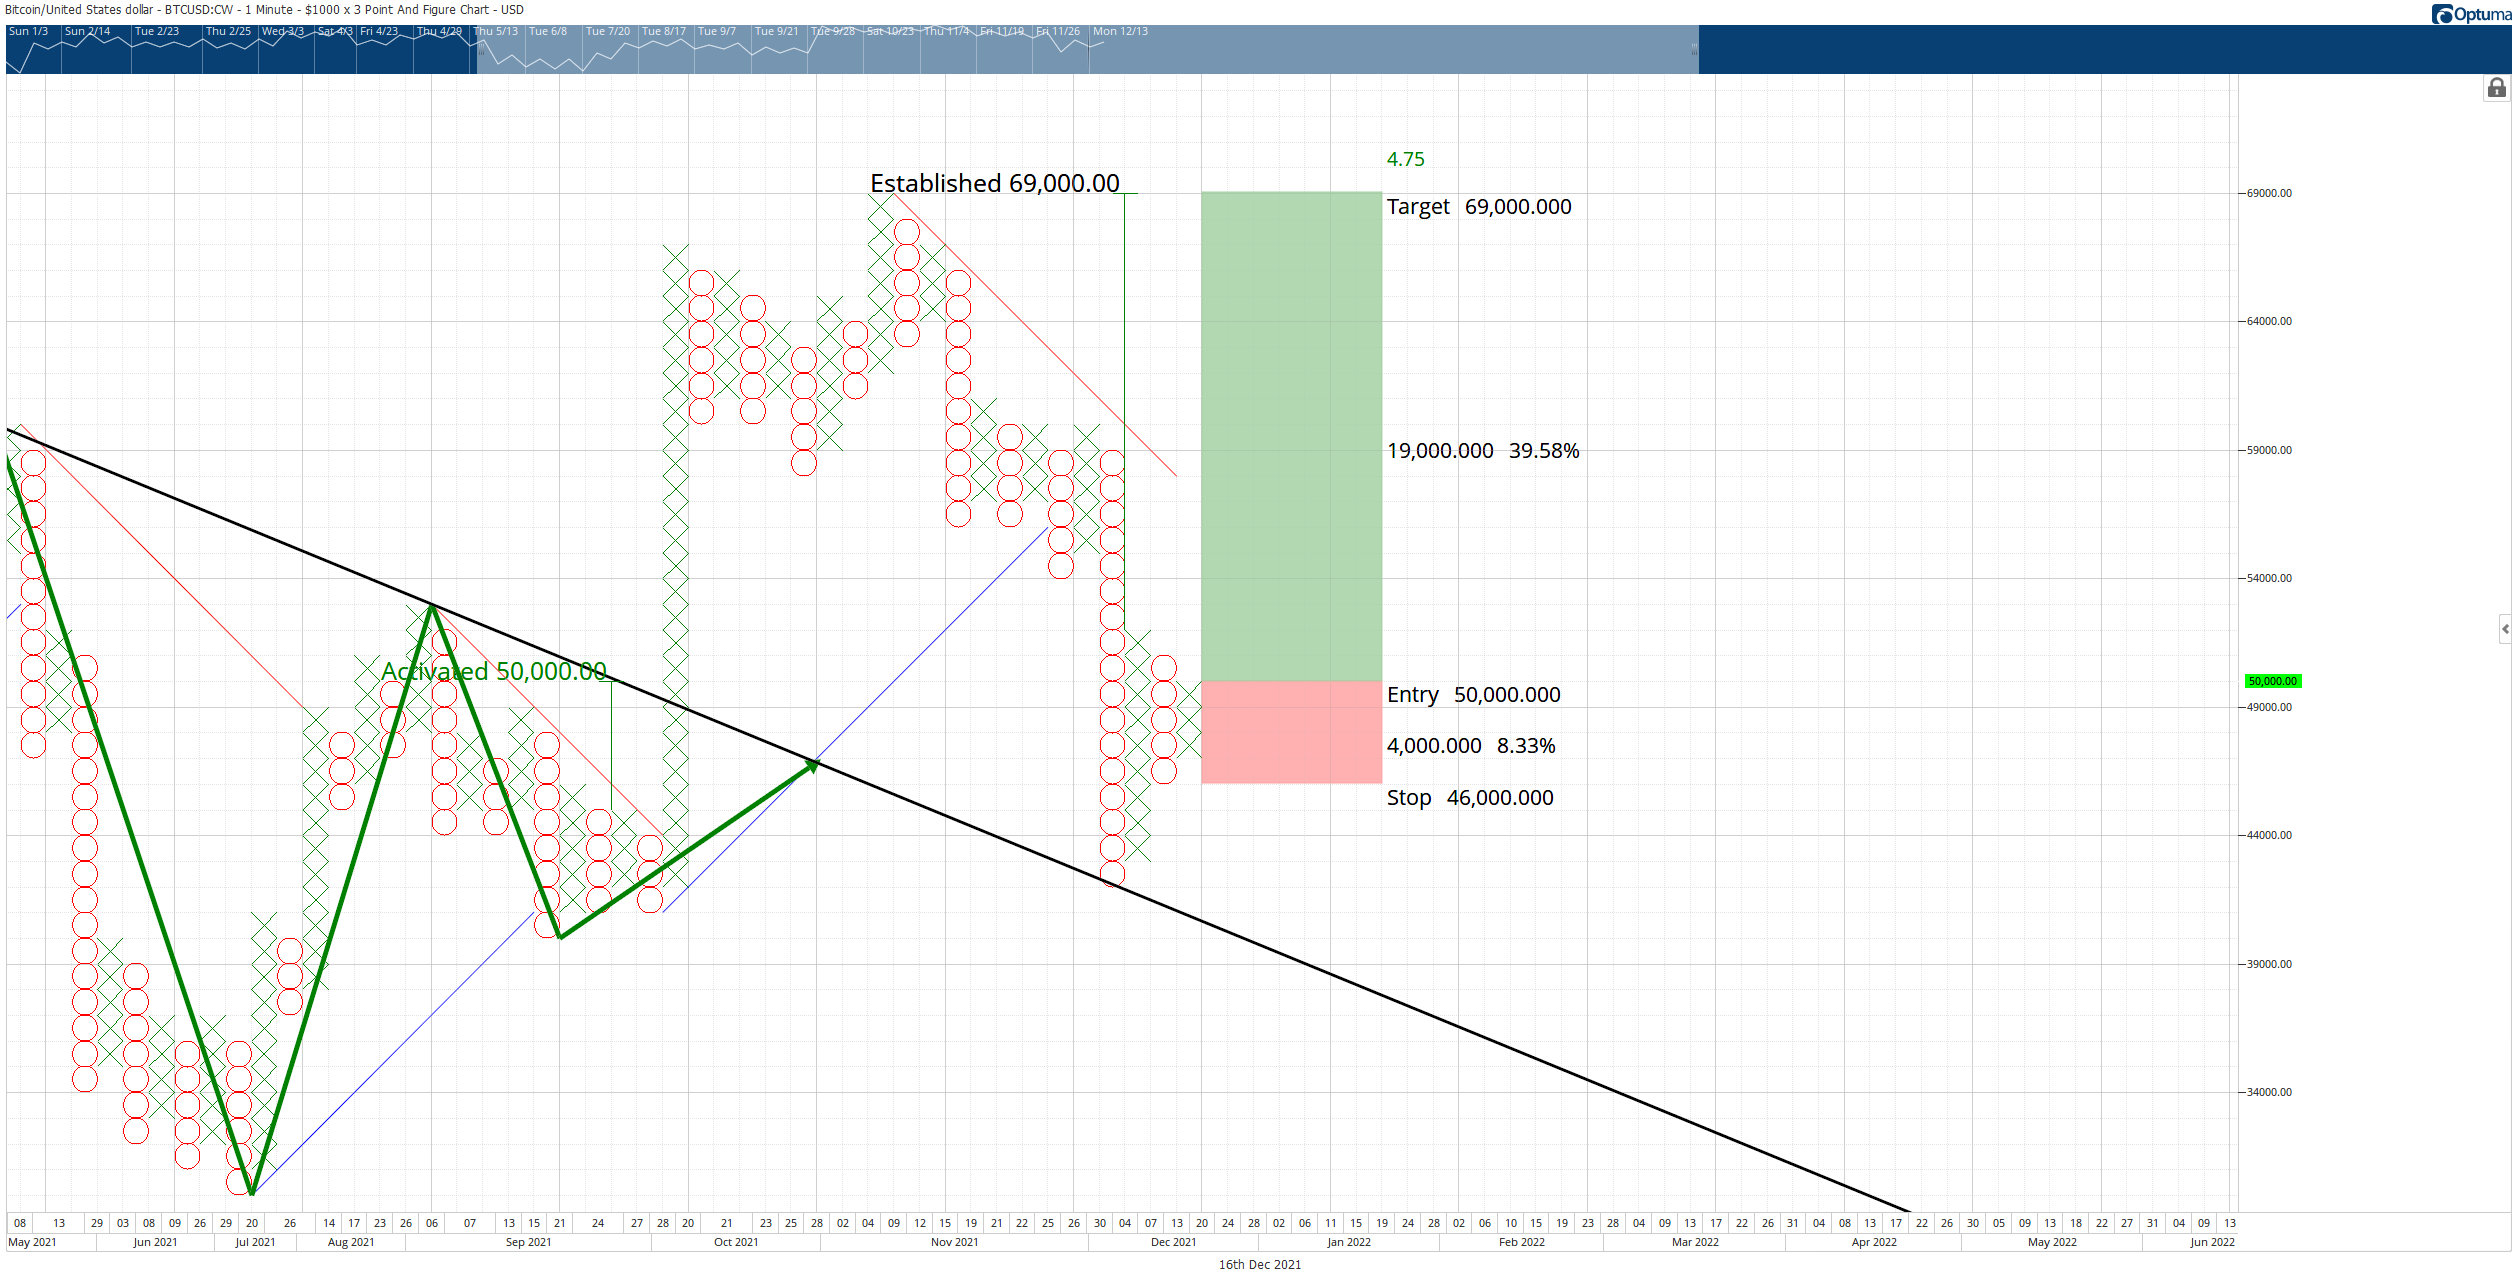
BTC/USD $1,000/3-box Reversal Point and Figure Chart
The trade is invalidated if a new column of Os prints before the entry has occurred.
Author

Jonathan Morgan
Independent Analyst
Jonathan has been working as an Independent future, forex, and cryptocurrency trader and analyst for 8 years. He also has been writing for the past 5 years.




