Bitcoin Weekly Forecast: BTC to provide the biggest buying opportunity before $100,000
- Bitcoin price is in a massive accumulation phase before it explodes to $100,000 or more.
- The bull run is likely to begin after a deep correction to MicroStrategy’s average buy price at $29,860.
- On-chain metrics suggest that long-term holders are booking profit, adding a tailwind to the bearish thesis.

Bitcoin price has been hanging around the $50,000 psychological level for quite some time. A breakdown of one crucial support barrier is likely to trigger a steep crash for BTC. On-chain metrics are also suggesting that long-term holders are booking profits, anticipating a nosedive.
Bitcoin price and MicroStrategy’s accumulation
Bitcoin price has been stuck between the 21-week Simple Moving Average (SMA) at $51,782 and the 50-week SMA at $44,730 for roughly two weeks. Although BTC pierced through the 50-week SMA on December 4 crash, it recovered quickly. As the sell-off continues, the big crypto is slowly slithering its way to retest the vital support level.
A weekly close below the 50-week SMA at $44,730 will indicate a major shift in trend from bullish to bearish. This development would also signal that Bitcoin price is due to collect liquidity resting below the $40,596 support level.
While this liquidity run might knock BTC below $40,000, it is a temporary move. In the long run, investors can expect the pioneer crypto to consolidate here before heading to $30,000 or the liquidity resting below it.
Interestingly this downswing is necessary to trigger the stop-losses resting below a critical $29,860 level, which is the average buy-in price of MicroStrategy. To date, the business intelligence software company has purchased 122,477 BTC, which is 0.53% of the total BTC in existence.
The total value of Bitcoins held by MicroStrategy is worth $5.76 billion, which indicates a profit of roughly 56%. It is fair to assume that many whales or long-term holders that are betting on BTC have an average price at roughly the same level as MicroStrategy or a bit lower.
Therefore, a dip below the average price of MicroStrategy at $29,860 will indicate a ‘max pain’ scenario and is likely to be where many investors may panic and sell to prevent losses. Market makers are likely to drive Bitcoin price to retest this barrier, therefore, or just below it.
While this outlook is speculative, it would make sense for BTC, especially from a market makers’ perspective due to the supply resting below the multiple wicks present around the $30,000 psychological level. In total, this move would represent a 36% crash from the current position.
Although unlikely, a worst-case scenario would be for BTC to fall by 48%, allowing it to retest the 200-week SMA at $23,935.
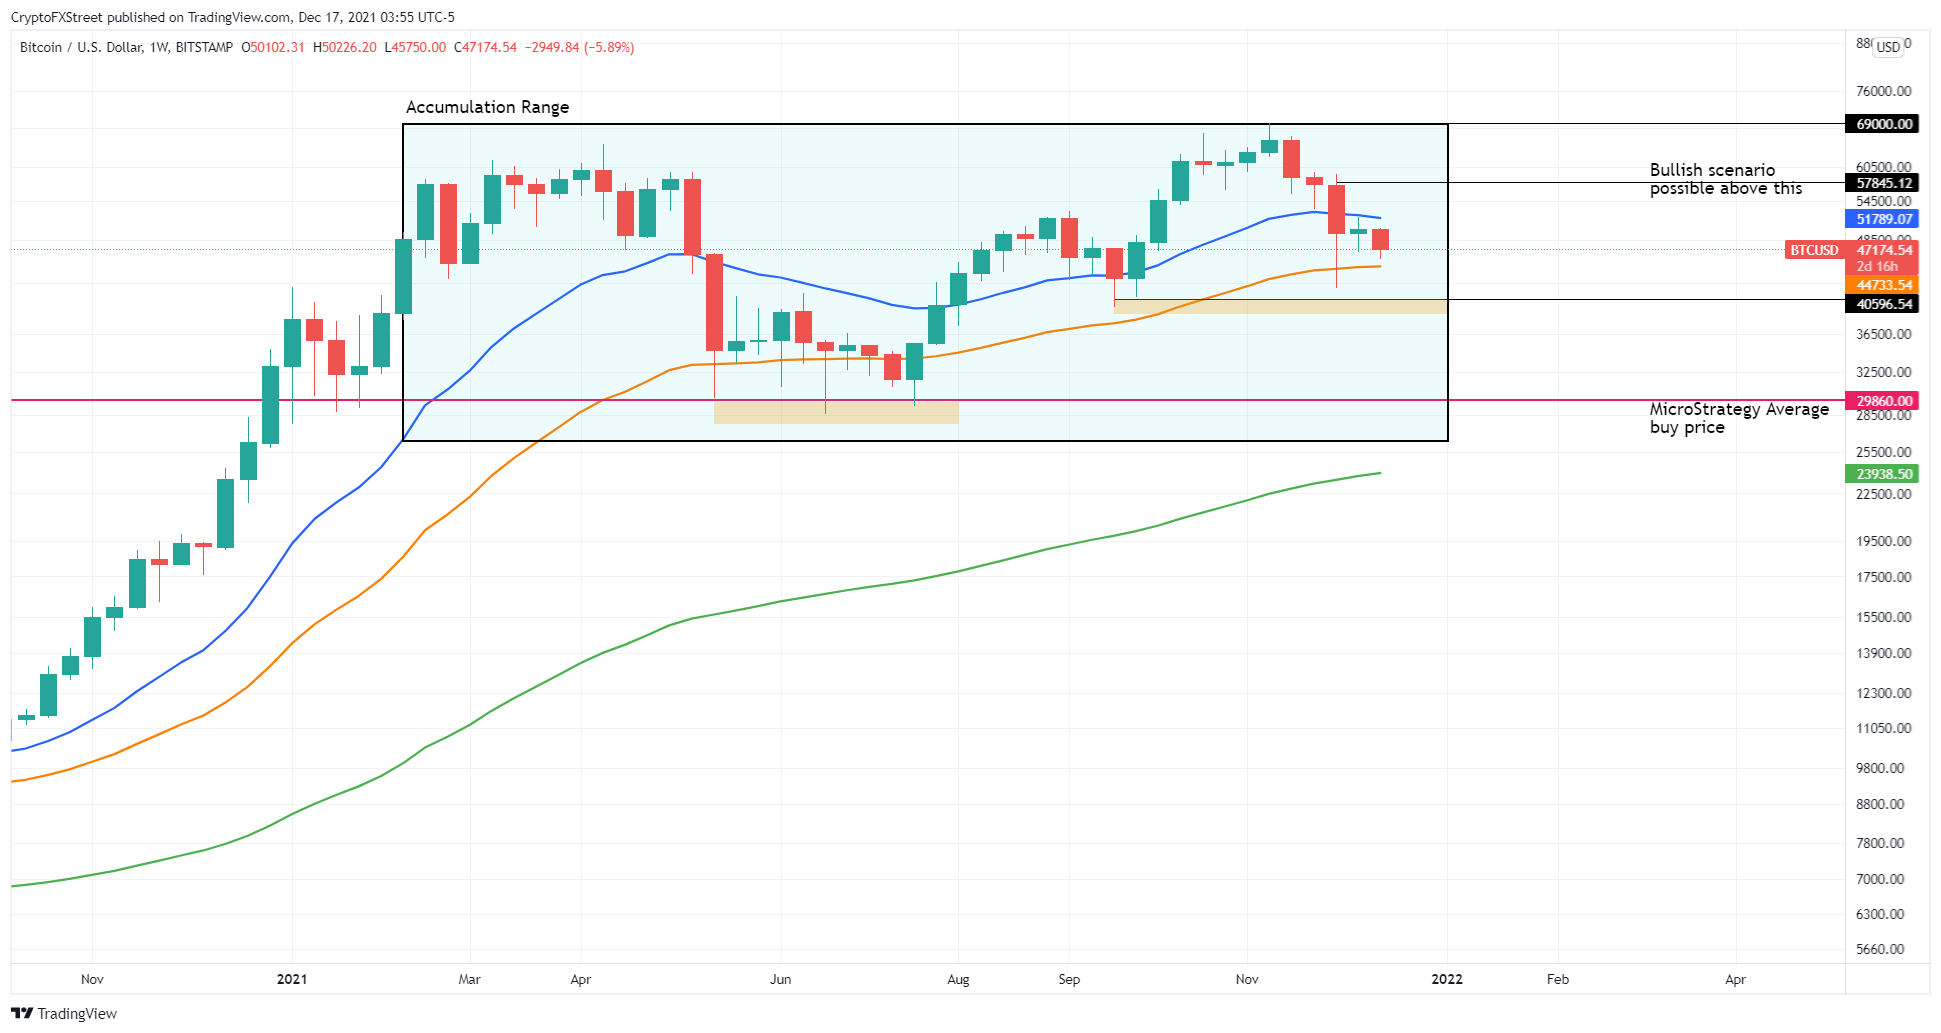
BTC/USD 1-week chart
IntoTheBlock’s Global In/Out of the Money (GIOM) model reflects the levels mentioned above. This on-chain index shows that the immediate cluster of investors that are “In the Money,” extends from $28,350 to $46,636.
Roughly 5.23 million addresses purchased 3.13 million BTC at an average price of $38,283. Therefore, a weekly close below this level will cause panic selling among investors that could drag the big crypto down to sub-$30,000 levels.
Moreover, any short-term buying pressure is likely to face massive headwinds as a massive cluster of underwater investors are present from $55,302 to $67,413. In this range, roughly 6.65 million addresses that purchased 3.37 million BTC are “Out of the Money.” Only a massive spike in buying pressure will be able to overcome the selling pressure from investors in this cluster trying to break even.
Hence, the logical conclusion is that the outlook for BTC favors the bears.
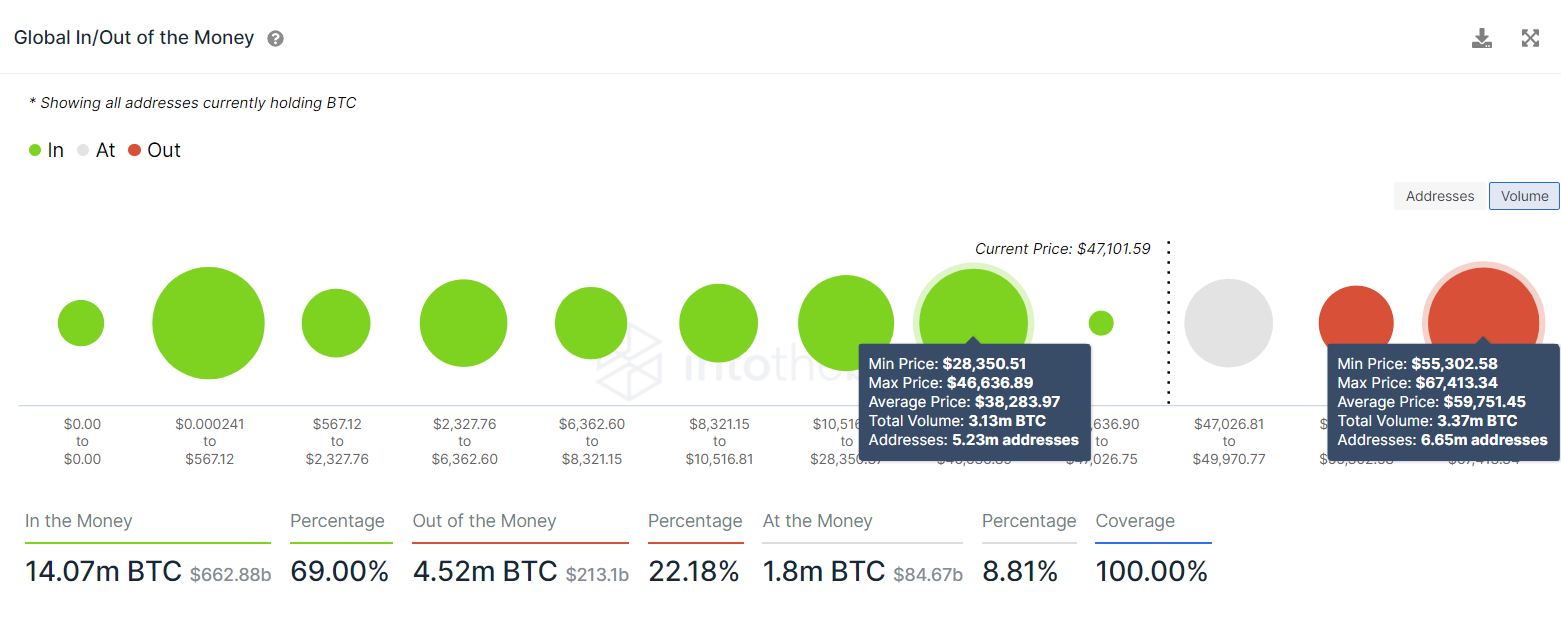
BTC GIOM
The supply shock chart supports the bearish outlook for Bitcoin. It shows that the long-term holders are booking profits.
Willy Woo, a popular analyst stated,
long term holders have been selling down and taking profits, but as a cohort they continue to be in a region of peak accumulation. Bear markets coincide when these holders have divested of their coins, despite the fear in the market, structurally we are not setup for a bear market.
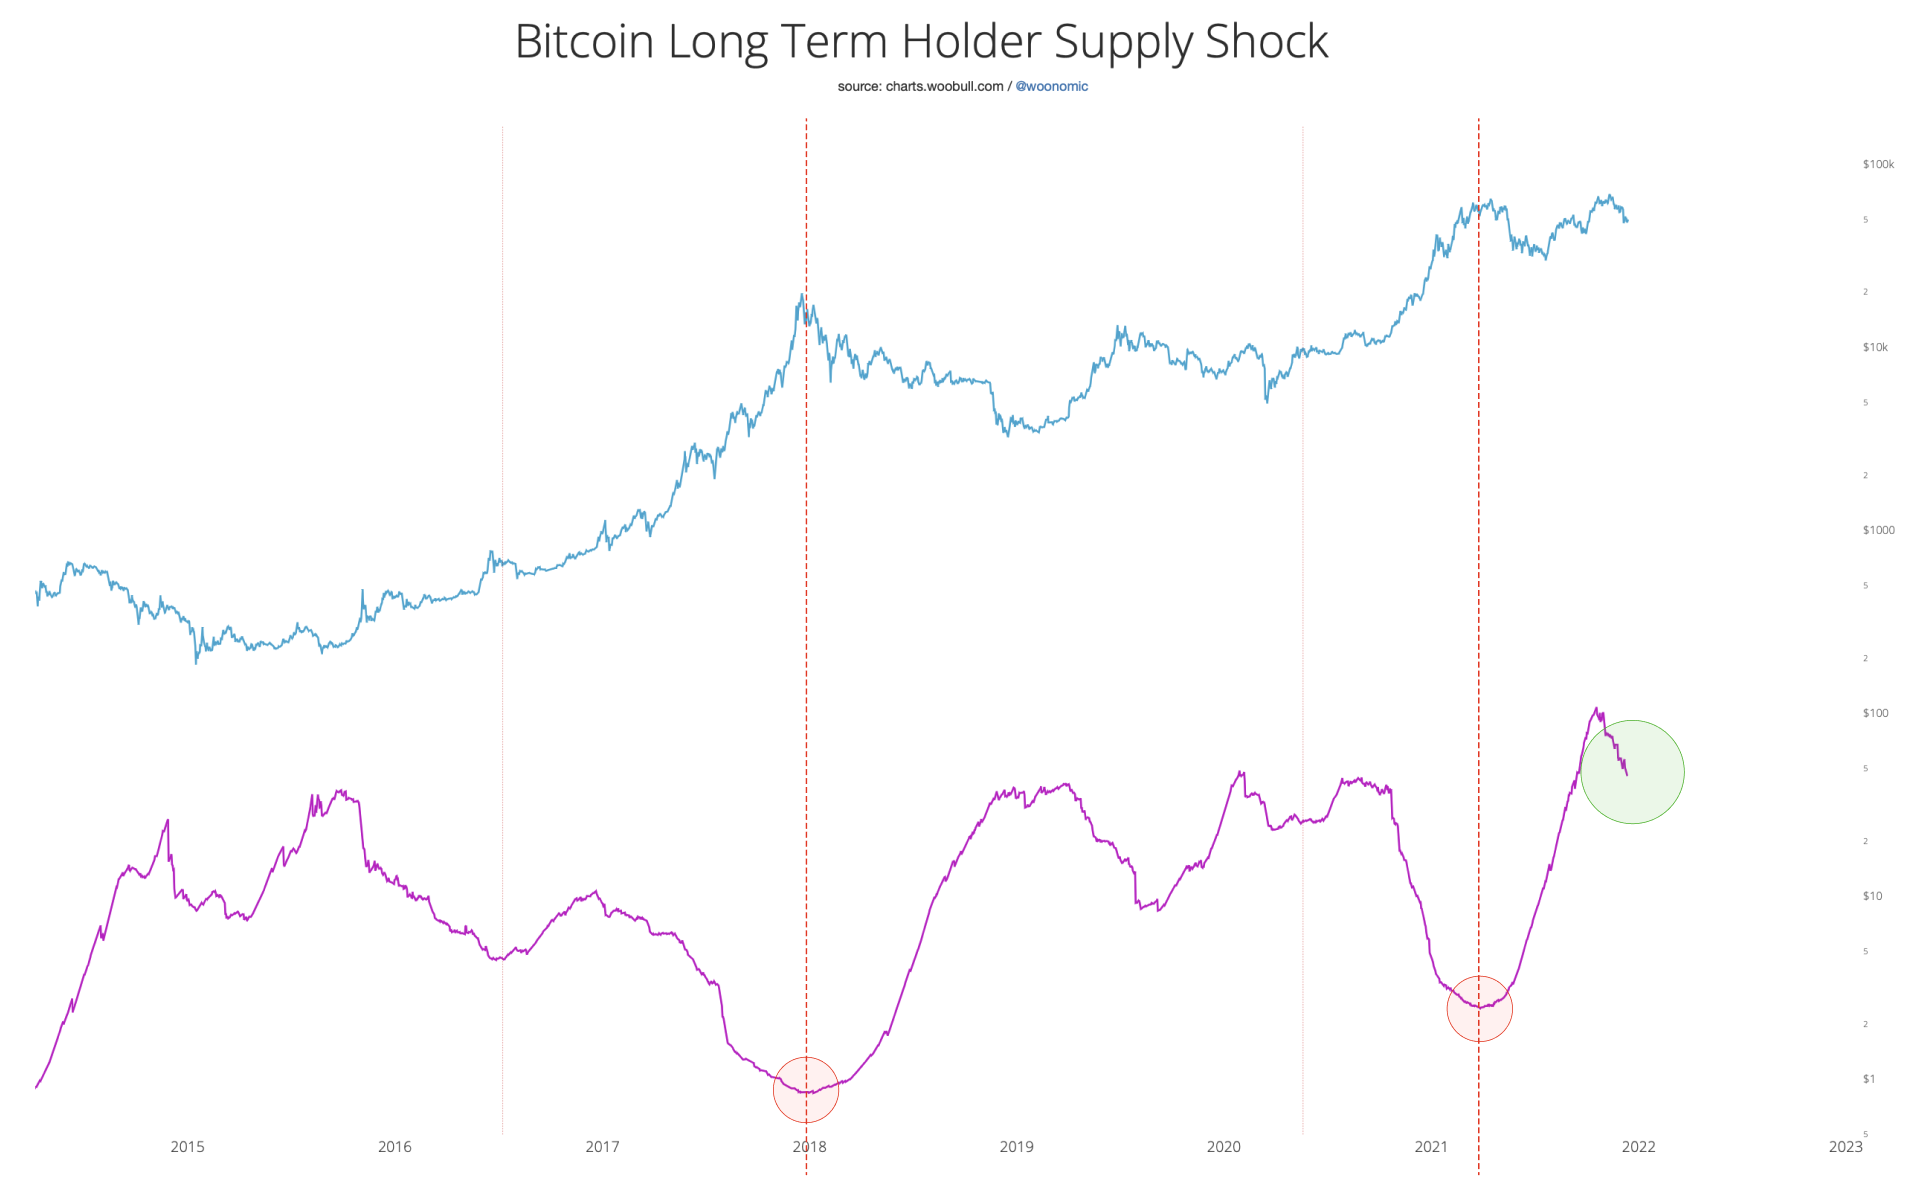
BTC supply shock chart
Further supporting a sell-off is the 0.83% decline in the number of whales holding between 100 to 100,000 BTC. Roughly 136 whales have offloaded their positions as seen in the supply shock chart above.
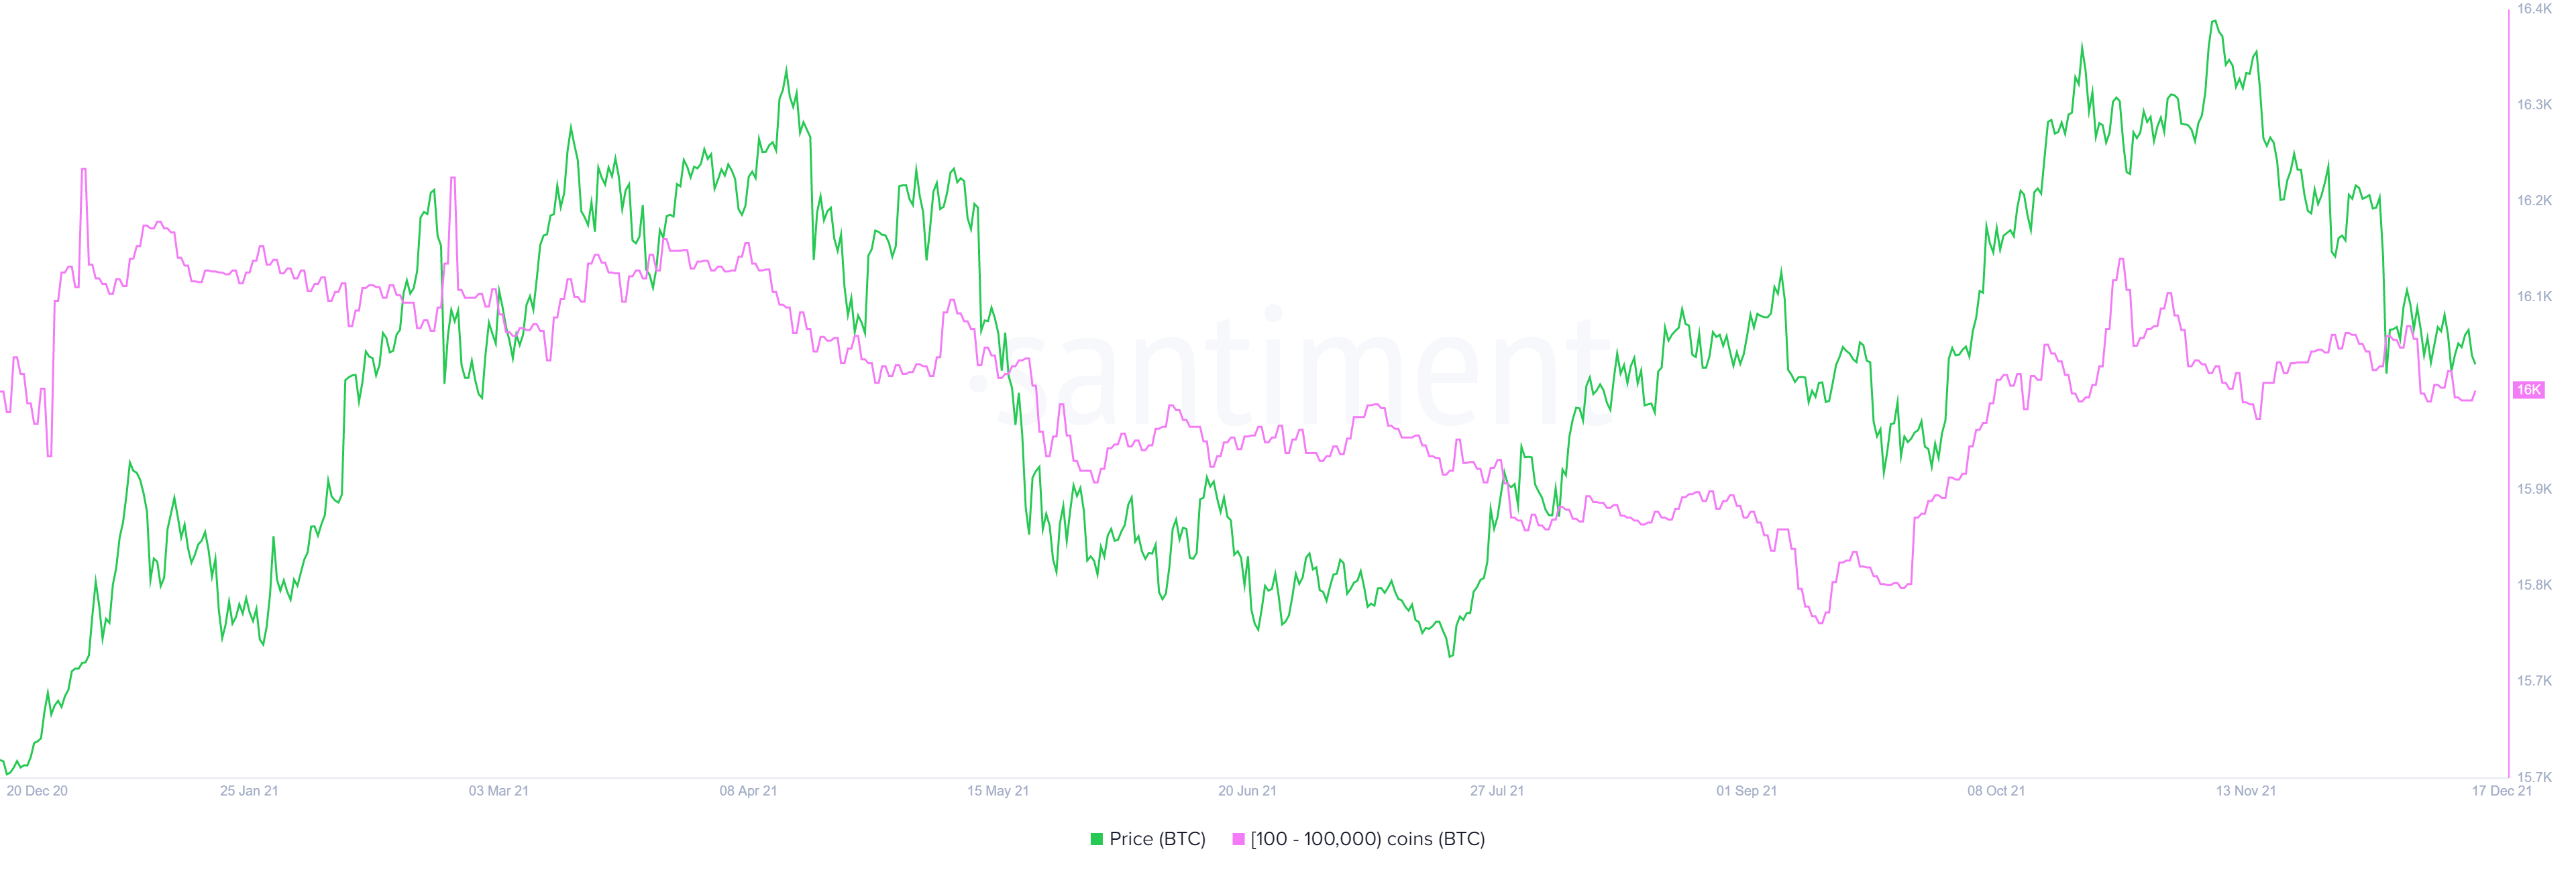
BTC whale distribution chart
The only chart that shows hope and presents the possibility of a short-term bullish outlook is the Market Value to Realized Value (MVRV) model, hovering around -1.8%. This on-chain metric is used to determine the average profit/loss of investors that purchased BTC over the past year.
A negative value represents that short-term holders are selling and is often referred to as the “opportunity zone.” This is where mid-to-long-term holders accumulate. So, there is a chance that BTC might see a potential buying spree that pushes it to retest the 21-week SMA at $51,776 or reach for the $57,845 resistance barrier, in a highly bullish case.
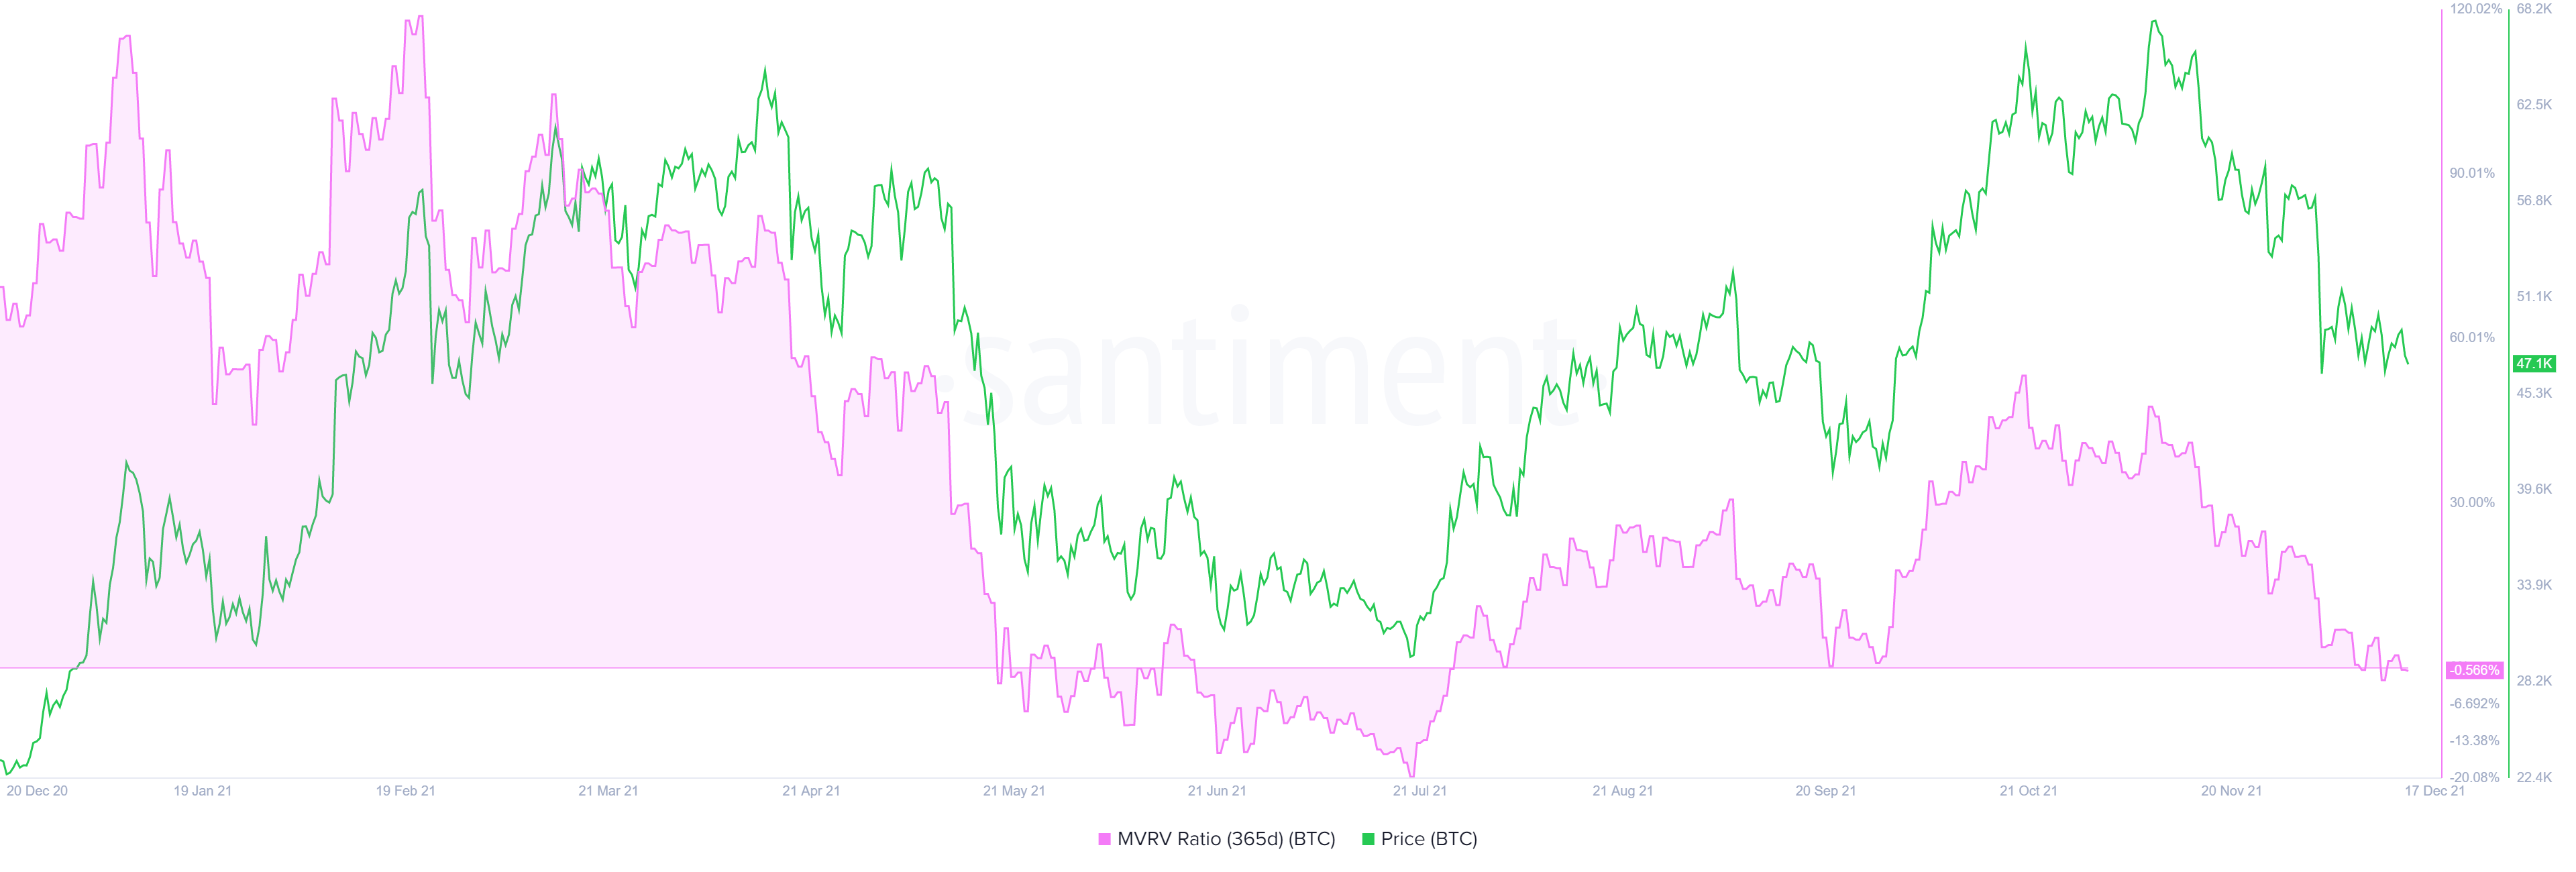
BTC 365-day MVRV
While the scenario outlined above is undoubtedly bearish for short-term holders, it will provide long-term investors with a perfect buying opportunity. A retest of MicroStrategy’s average buy price at $29,860 will be where investors can expect a reversal of the downswing.
The resulting uptrend will likely propel Bitcoin price to a new all-time high at $100,000. However, if Bitcoin price decides to skip the crash and produces a weekly close above the current all-time high at $69,000, then it will invalidate the bullish thesis.
In such a case, investors can expect BTC to head to other psychological barriers like $70,000 or $80,000.
Author

Akash Girimath
FXStreet
Akash Girimath is a Mechanical Engineer interested in the chaos of the financial markets. Trying to make sense of this convoluted yet fascinating space, he switched his engineering job to become a crypto reporter and analyst.


