Top 3 Price Prediction Bitcoin, Ethereum, XRP: Bitcoin moving on the razor edge
- BTC/USD plays with the bullish scenario but hides clear dangers for the trader.
- XRP returns to the upside, pending a breakout of significant moving averages.
- Ether lags behind and must accelerate to regain the lost initiative.

Yesterday's positive day along the crypto board has brought the BTC/USD pair to the borderline between a bearish market and a free space where it can grow again in search of new historical highs. The technical setup is critical, although it hides danger if it doesn't materialize, as I explain in the technical section.
The essential notes of the day regarding the crypto ecosystem:
- The World Economic Forum presents a project to promote the adoption of a "robust" framework for the Crypto ecosystem, involving both the private and public sectors.
- A group of Bitcoins Cash miners from both North America and Europe are threatening to promote a hard fork as a lobbying measure against BTC's intention. TOP's CEO Jiang Zhuoer is using 12.5% of the mining rewards to cover infrastructure costs.
ETH/BTC Daily Chart
The ETH/BTC is currently trading at the price level of 0.01903 while attempting to stay above the EMA50. The excellent performance of the Bitcoin yesterday harmed the price.
Above the current price, the first resistance level is at 0.01965, then the second at 0.020 and the third one at 0.022.
Below the current price, the first support level is at 0.0189, then the second at 0.01865 and the third one at 0.018.
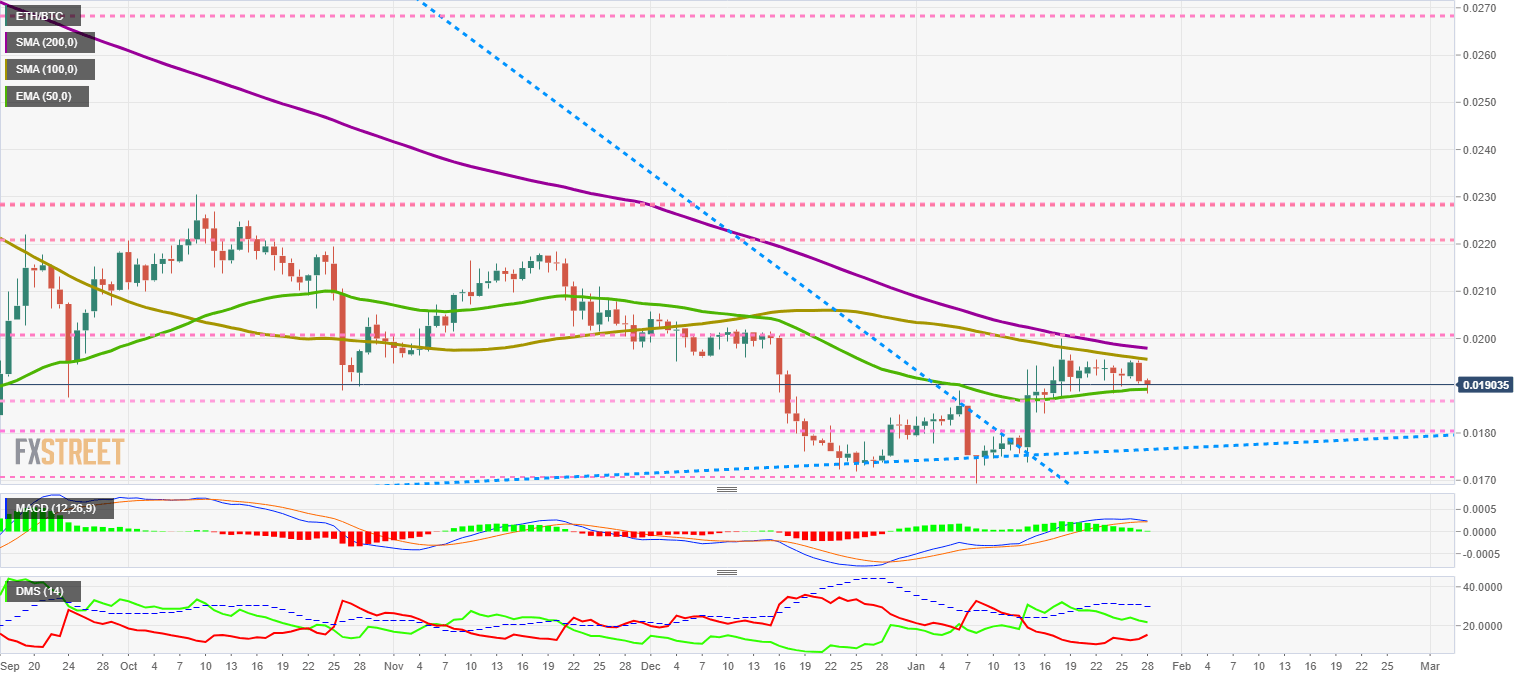
The MACD on the daily chart is preparing for a bearish cross above the zero line, a typical consolidation structure. This configuration increases the chances of seeing recent minimum levels below 0.018 again.
The DMI on the daily chart shows bulls in continuous decline, while bears are increasing their strength and are close to disputing the lead to buyers.
BTC/USD Daily Chart
The BTC/USD is currently trading at the price level of $8961. The session high is at the price congestion resistance at $9150.
The long term downward trend line is at $9025, while the BTC/USD finds support at the SMA200 which is at the price level of $8903.5
The BTC/USD must close the day above the $9,025 level to confirm the exit from the long term bearish scenario.
A close below the SMA200 would cancel the current bullish breakout scenario.
Above the current price, the first resistance level is at $9150, then the second at $9550 and the third one at $10500.
Below the current price, the first support level is at $8900, then the second at $8800 and the third one at $8400.
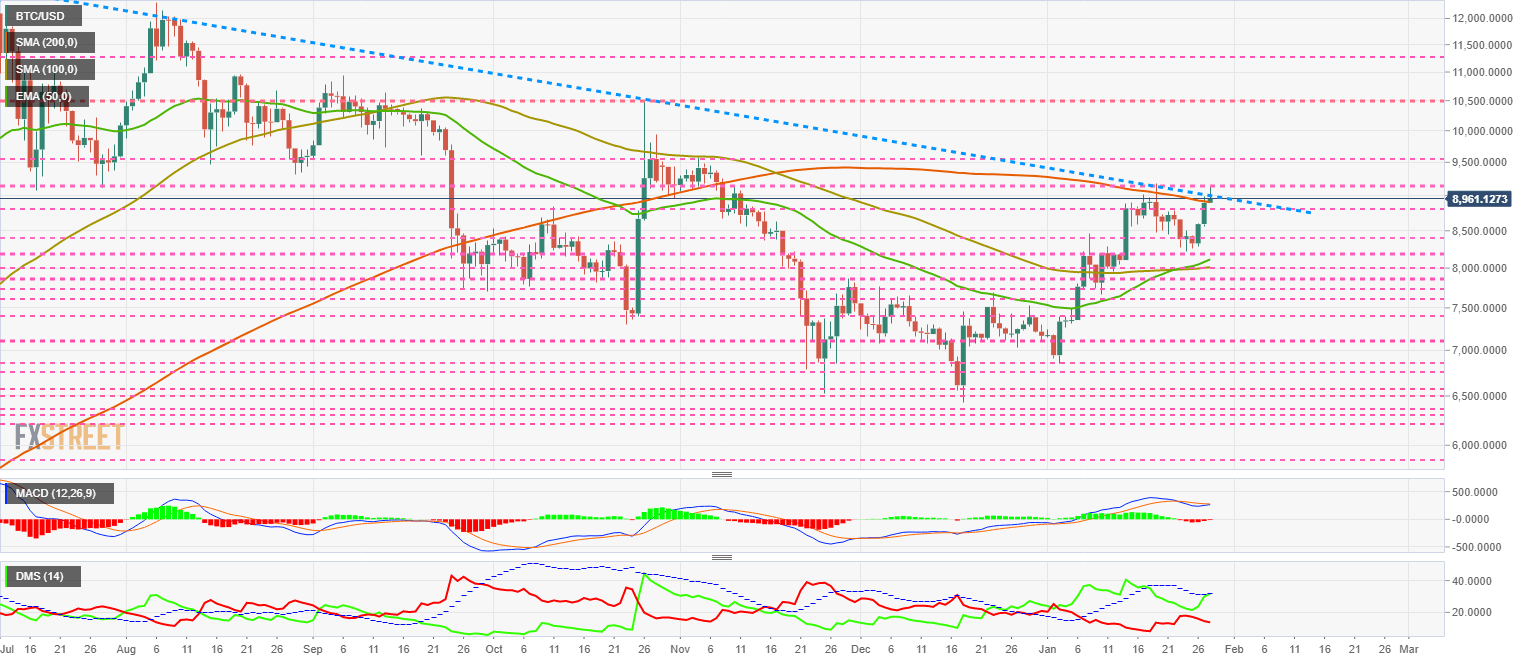
The best option is to wait for the price to dictate the path the price will take in the following weeks.
The DMI on the daily chart shows bulls trying to get back above the ADX line. The most likely pattern indicates that the bulls will fail to cross, and the price will fall.
ETH/USD Daily Chart
The ETH/USD is currently trading at the price level of $170.46 and is far from reaching the SMA200 as the BTC/USD has done. The long term downward trend line is now at the $185 level.
Above the current price, the first resistance level is at $176.7, then the second at $180 and the third one at $190.
Below the current price, the first support level is at $170, then the second at $160 and the third one at $155.
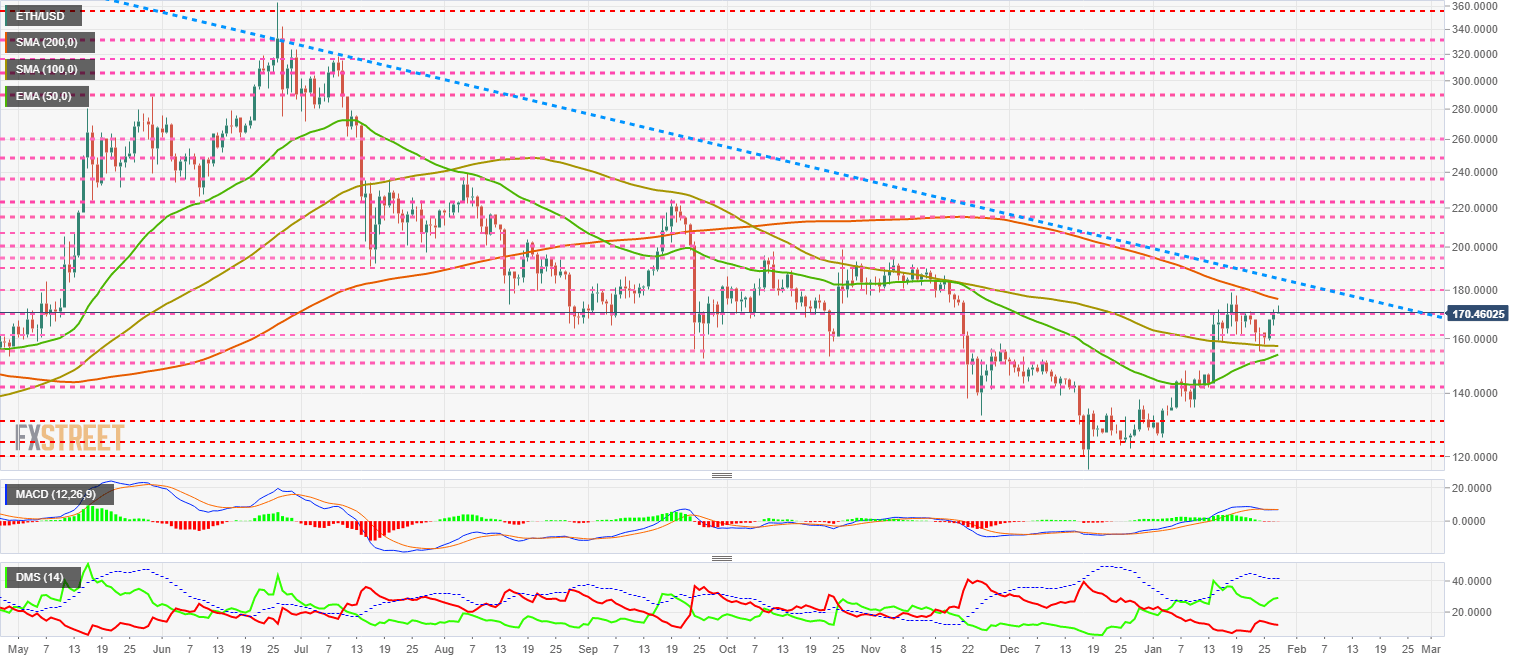
The MACD on the daily chart shows a neutral profile, as even though the typical trend of this structure is bearish, the fact that it remains so horizontal shows underlying strength upward.
The DMI on the daily chart shows the bulls moving up again as the bears retreat. The structure confirms the price movement.
XRP/USD Daily Chart
The XRP/USD is currently trading at the price level of $0.2326 and is the only Top 3 that is already free of the long term bearish trend. The day's high remains at the SMA100 level at $0.2358.
Above the current price, the first resistance level is at $0.237, then the second at $0.253 and the third one at $0.267.
Below the current price, the first support level is at $0.227, then the second at $0.217 and the third one at $0.20.
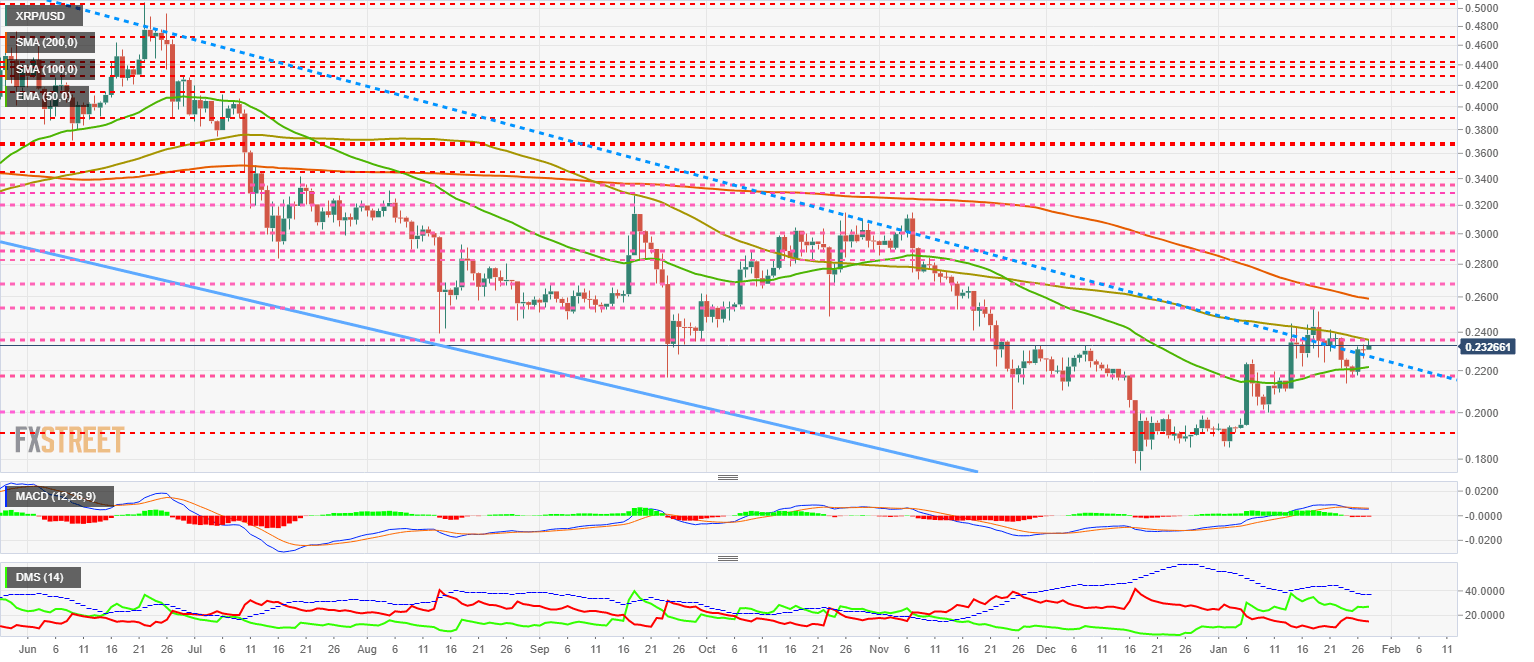
The MACD on the daily chart shows a similar structure to that described for the ETH/USD, leaving a neutral situation with a slight downward trend.
The DMI on the daily chart shows the bulls moving upward, while the bears are moving downward. They do not provide any additional information about price behavior.
Get 24/7 Crypto updates in our social media channels: Give us a follow at @FXSCrypto and our FXStreet Crypto Trading Telegram channel
Author

Tomas Salles
FXStreet
Tomàs Sallés was born in Barcelona in 1972, he is a certified technical analyst after having completing specialized courses in Spain and Switzerland. He expanded his technical training following the guidance of great experts on the financial markets.


