Top 3 price prediction Bitcoin, Ethereum, Ripple: Slow-motion uptrend but fast in emotions
- Ethereum is playing on the edge as it projects a good year.
- The market is in fear mode despite the distance from the 2018 lows.
- 2020 could be the year of the Ethereum outperforming Bitcoin.

The game board of cryptocurrencies has always been high-risk territory. The high level of volatility, opposed by moments of almost no activity, generates contrasts in the mood of the trader that can expel him from the market.
I am not talking about a material expulsion, the trader keeps his investment account intact. I am talking about a situation of abstraction from the market's shifts that limits the ability to make decisions.
The crypto market has a particular way of managing action/inaction times and mastering, generating emotional boundary states in traders.
According to the website alternative.me, the market sentiment for today January 9th marks 44 points – on a scale of 0-100 – and falls 7 points from yesterday. A signal below the 50 level indicates "Fear".
A year ago, the market was at a relatively low and you could buy a Bitcoin for just over $3000 or an Ethereum for just under $90. How can there be fear when prices are well above relative lows?
It is clear to everyone that the crypto segment is immersed in an ocean of unsolved unknowns yet. From financial regulation to the actual application of technology, including taxation, the issues to be resolved are countless.
The direct consequence of this situation is the tempo. The crypto market does not consume time at the pace of a "financial bubble", although prices do. The rhythm in the crypto universe is slow because it needs to secure every step it takes. Any major mistake could be final, and everyone involved in the industry knows it.
And these precautions translate into market sentiment in the form of "Fear" even though Bitcoin, the King, is 100% above the recent low from one year ago.
ETH/BTC Daily Chart
The ETH/BTC pair is currently trading at the price of 0.01755 and left a Flying Dragon figure on the daily chart. The interpretation of this figure is as a robust bullish upturn signal and a gift for traders. Below the candlestick, one cent below, the protective stop. It is not foolproof, nothing is reliable in trading, but it is simple.
Respected cryptocurrency analytics firm SkewAnalitycs believes that 2020 might be a year when Ethereum will outperform Bitcoin:
Above the current price, the first resistance level is at 0.018, then the second at 0.0189 and the third one at 0.020. If the ETH/BTC breaks and consolidates above the first resistance level, it will escape the long-term bearish scenario and the situation will turn very positive.
Below the current price, the first support level is at 0.017, then the second at 0.016 and the third one at 0.013.
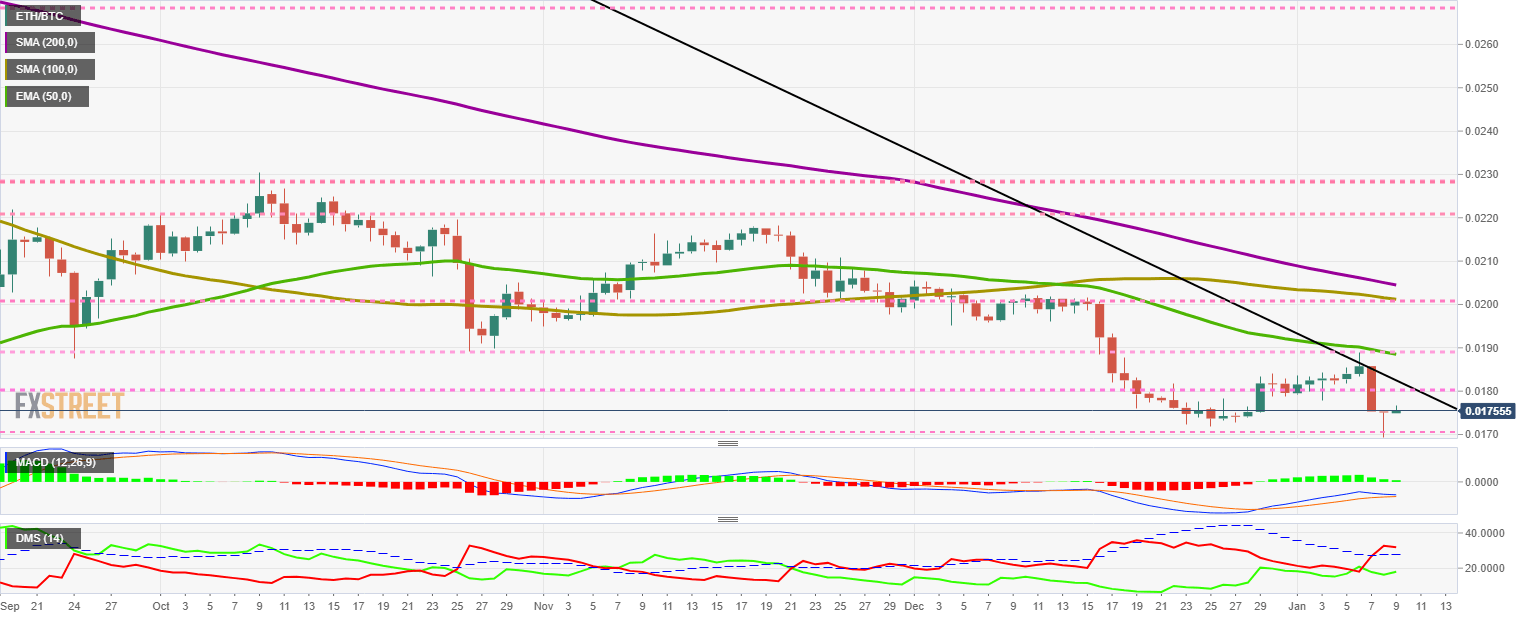
The MACD on the daily chart shows that yesterday's downward movement did not cause this indicator to cross the oversold territory. As a result, there is a possibility today that the bullish trend will continue and that the pair will bounce back upwards.
The DMI on the daily chart shows how the downward movement hits bulls here. The bears get well above the ADX line, which puts them in a clear dominance situation. The bulls are moving upwards and maintaining their aspirations of dominating the pair in the short term.
BTC/USD Daily Chart
BTC/USD is currently trading at $7,881 and has lost the psychological level of $8000 that had allowed market sentiment to escape from fear for a few hours.
The bullish reaction to geopolitical risks in the Middle East confirms its position as a store of value in the making.
Above the current price, the first resistance level is at $8000, then the second at $8200 and the third one at $8400.
Below the current price, the first support level is at $7875, then the second at $7750 and the third one at $7,500.
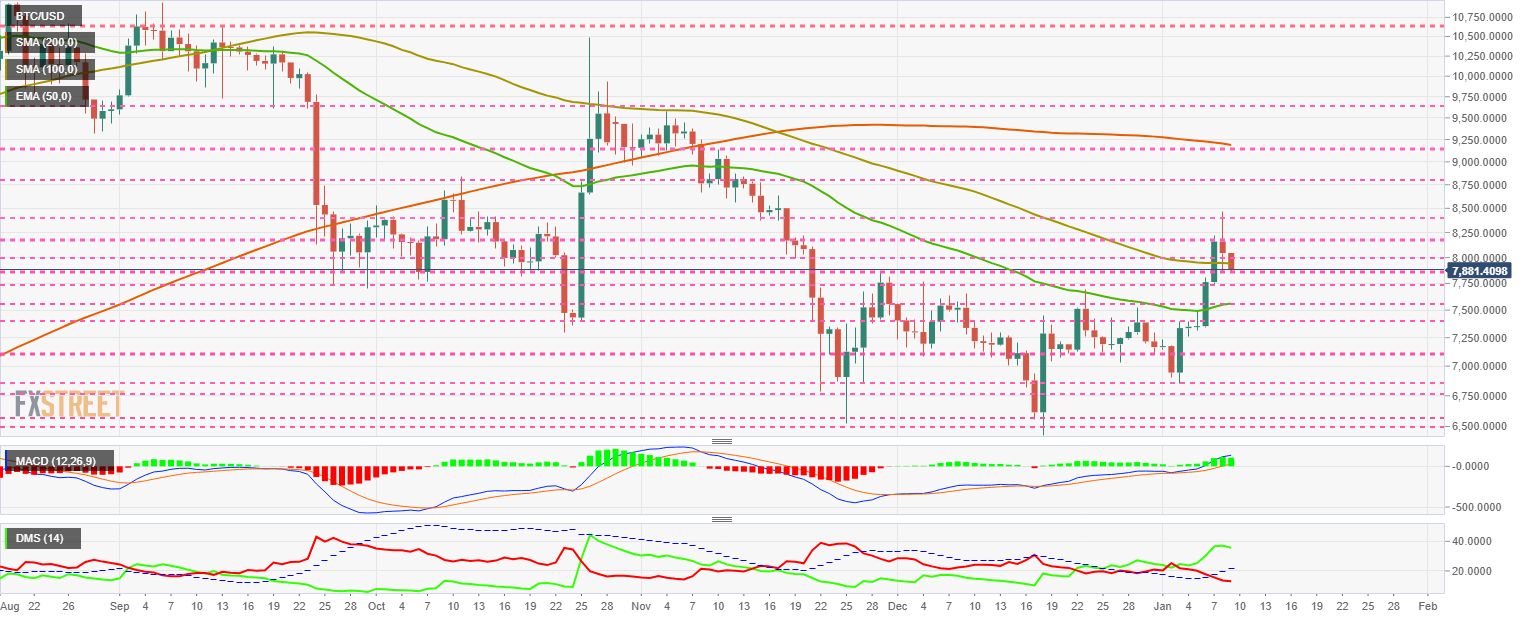
The DMI on the daily chart confirms what the MACD is indicating and shows full control by the bulls. The bears are continuing their downward movement but may gain some strength in the next few hours in a technical evolution that will not affect the upward trend.
ETH/USD Daily Chart
ETH/USD is currently trading at $138.37 and is moving away from $140 as it is unable to hold above the 50-period exponential average.
Above the current price, the first resistance level is at $140, then the second at $143 and the third one at $150.
Below the current price, the first support level is at $130, then the second at $125 and the third one at $120.
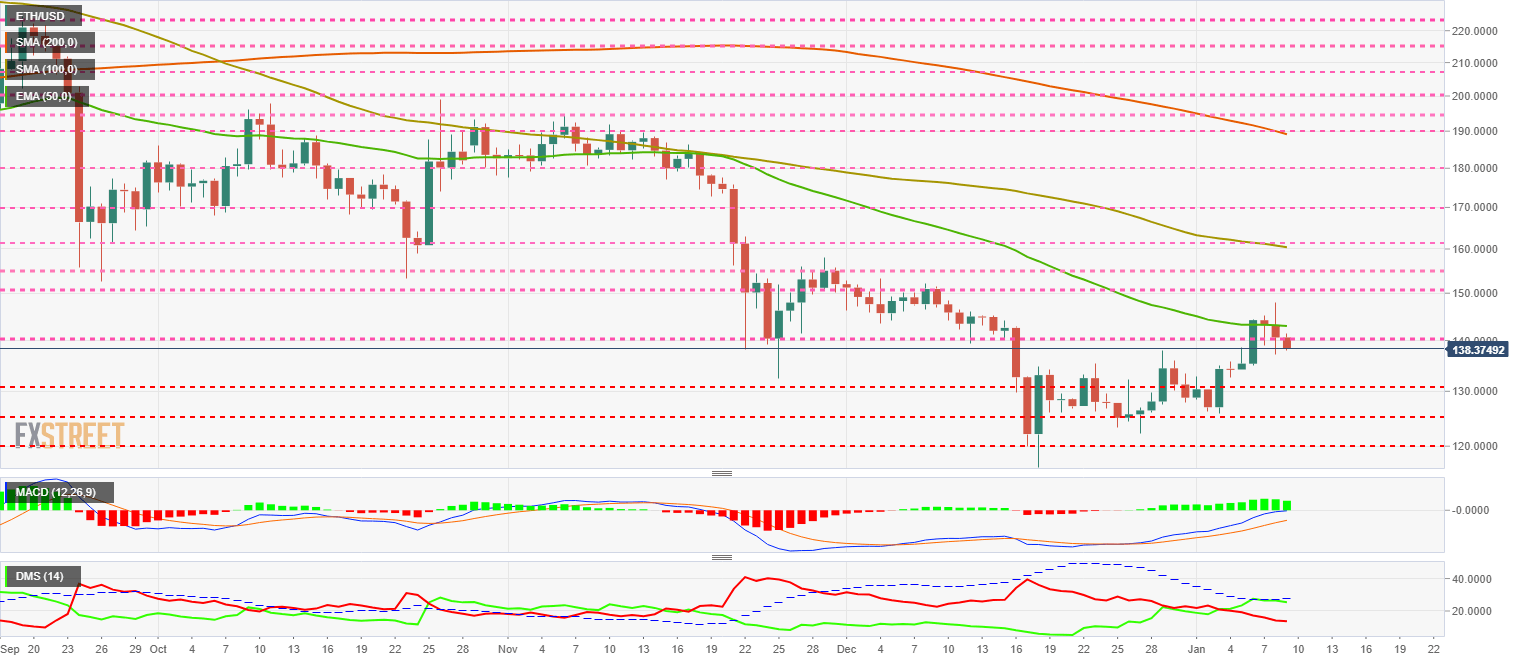
The MACD on the daily chart indicates that the arrival of the indicator's zero levels is not affecting the slope or opening of the moving averages. The profile holds all the upside potential and could enter the bullish zone without difficulty.
The DMI on the daily chart shows how the bulls failed to break the ADX line on the first attempt. The bears are not reacting to the declines and are continuing the downward trend.
A coordinated bullish break of the 0.018 level in the ETH/BTC pair, the entry of the moving averages into the bullish zone of the MACD and the bullish breach of the ADX line in the ETH/USD pair would be explosive.
XRP/USD Daily Chart
XRP/USD is currently trading at the price level of $0.2044 after losing support from the 50-period exponential average. Today may be the third day in red after Monday's big green candlestick, a pattern that usually continues with a continuation of the upward trend.
Above the current price, the first resistance level is at $0.215, then the second at $0.225 and the third one at $0.23.
Below the current price, the first support level is at $0.1985, then the second at $0.19 and the third one at $0.13.
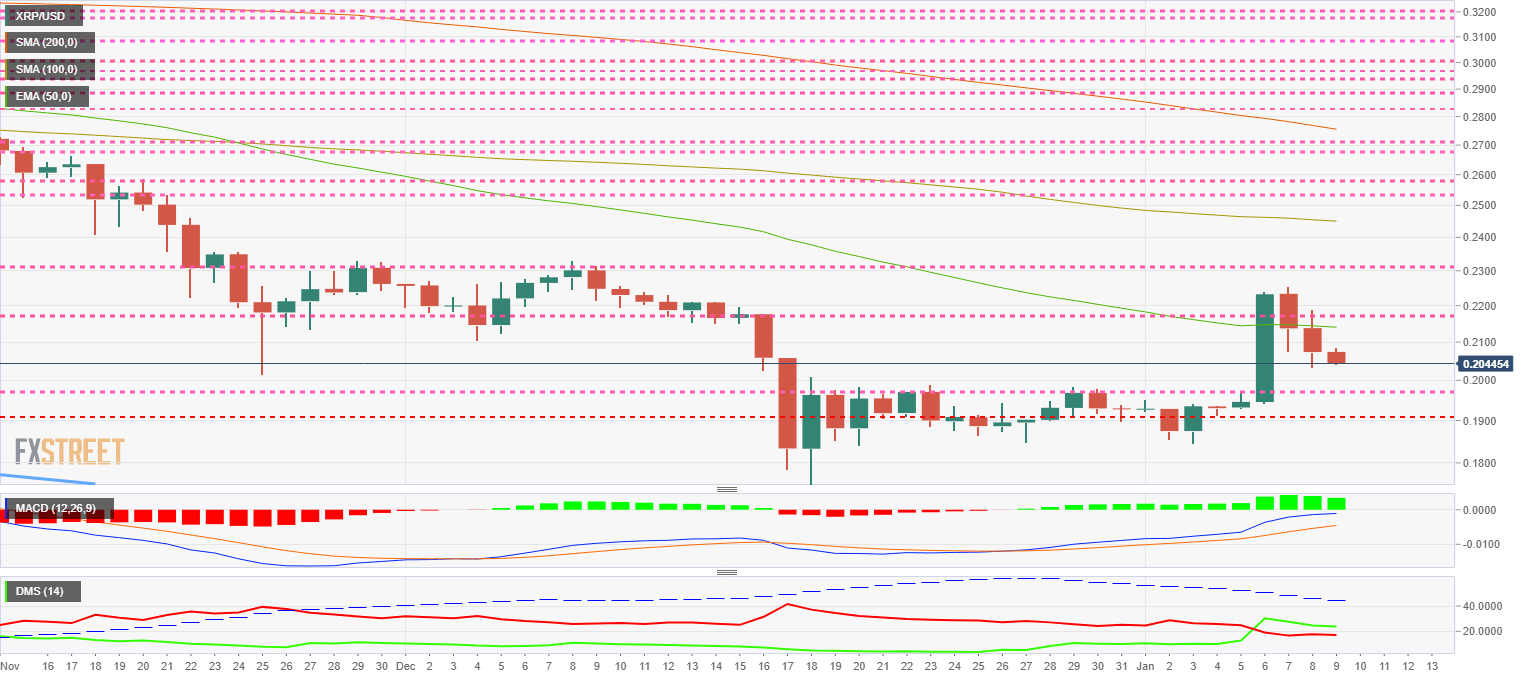
The MACD on the daily chart shows a significant bullish profile, although it is losing some of its momentum. The MACD on the daily chart shows an outstanding upbeat profile, although it is losing some of its energy.
The DMI on the daily chart shows that bulls have a slight advantage over the bears. Both sides of the market remain below – and away from – the ADX line.
Get 24/7 Crypto updates in our social media channels: Give us a follow at @FXSCrypto and our FXStreet Crypto Trading Telegram channel
Author

Tomas Salles
FXStreet
Tomàs Sallés was born in Barcelona in 1972, he is a certified technical analyst after having completing specialized courses in Spain and Switzerland. He expanded his technical training following the guidance of great experts on the financial markets.


