Top 3 Price Prediction Bitcoin, Ethereum, Ripple: Shorts, Longs and Market Patterns
- BTC/USD moves higher without convincing the market to wait for events.
- ETH/USD opens a window of opportunity from the cliff.
- XRP/USD conquers levels and shows remarkable divergences.

There’s a classic financial fable that tells the story of the parade that is thrown down the street celebrating the profits made, attracting to the float people from the street who come lured by the wealth and joy that is breathed there among those who are already inside. The fable ends without music, nor party and for the last ones that were added, without money.
Yesterday afternoon in European time, the Crypto board reacted to the rise and back to the office, the bullish tone continues. None of the major Cryptos have reached levels that give for a headline, or to harbor expectations to the rise yet.
But something happened that gives us a clue as to where the issue might go. In the face of the mild bullish reaction, both bullish and bearish positions on the ETH/USD were strongly increased. The Ethereum is the easy prey in these moments and where the bears go with all the arsenal. So one of the two makes a mistake in the position.
Well, returning to the fable with which I open the article, it is not superfluous to consider which of the two positions has the most beautiful float, fun, and more wealthy appearance. The levels of sales uncovered on the Ethereum are at maximum and continue to grow. The party started with the ETH/USD trading above the $1,400 price level, and the float fills at $160? Someone is buying the buck.
The party can go on, and more people keep going up, but the business is done and those who hosted the party are already thinking about the next one.
BTC/USD 1-D
The BTC/USD is currently trading at $6,418, after resting at the base of the channel that has been drawn on the chart for months. Up to four times it has stopped at this level. I don't think it's time for a market turn yet, and possibly the bear party of some more headlines.
Follow the chart, you can open it and after registering, save it for your personal use.
Above the current price, again everything to reconquer. The first resistance that the BTC/USD will encounter is at the price level of $6,580 (resistance due to price congestion), an important level because from here we should face the assault at the important level of $6,770 (resistance due to price congestion, EMA50, and SMA100). As we see a very well protected level. Above this level, and up to the trend line that guided the price in the rise started in August, resistance at the price level of $6,875 (price congestion resistance) and $7,100 (price congestion resistance).
Below the current price, first support at the $6,200 price level (price congestion support), second support at $6,150 (long-term bass channel base) and as a technically valid extension at $5,865 (price congestion support).
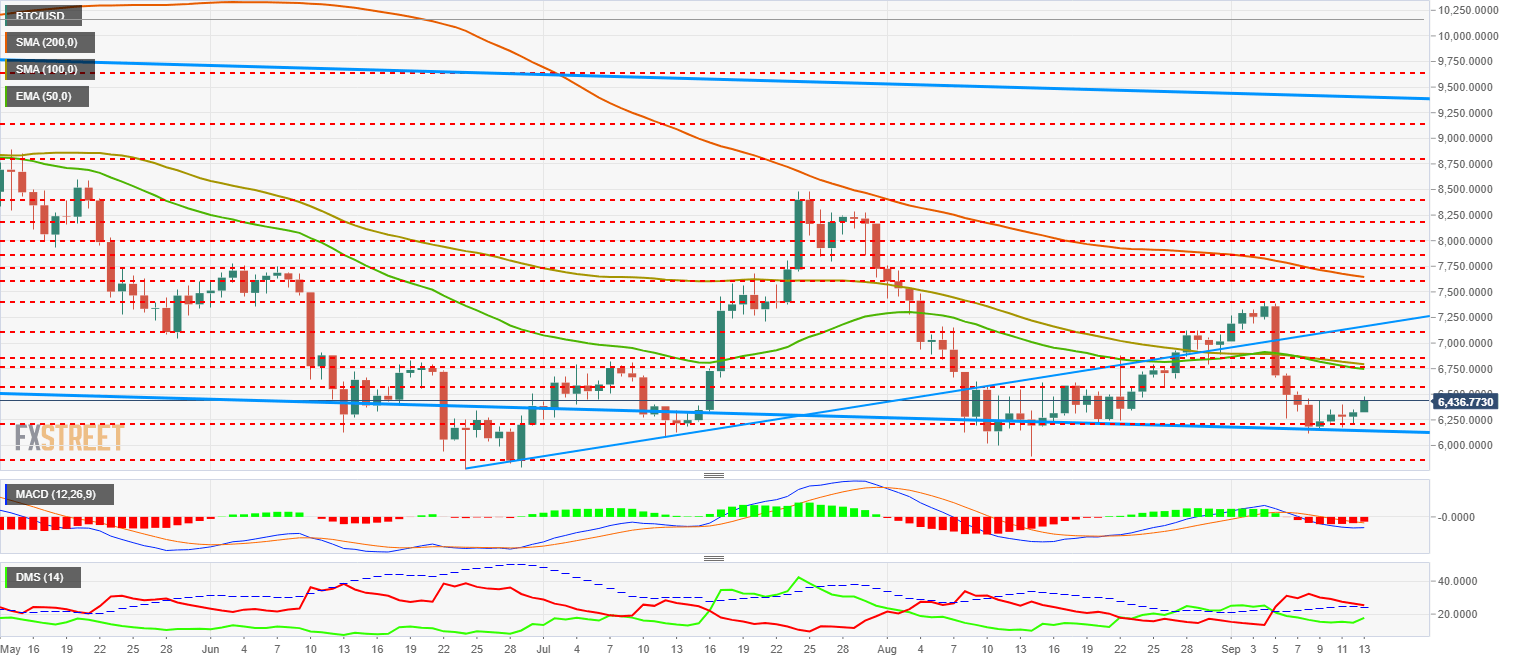
The MACD 1-D shows an upward turning process in the intermediate development phase. The situation of the indicator below the 0 line and the time needed to complete the turn and be able to cut to the rise, advise having as very likely a new stretch of weakness in the price.
DMI 1-D shows bulls increasing their activity in the last four days while bears seem to give up and are continuously undoing positions.
ETH/USD 1-D
The ETH/USD is currently trading at the $190 price level, a considerable improvement from yesterday's lows. It is currently just below the long-term bearish channel baseline. The figure that is drawn, similar to a small "Flying Dragon" can boost the value of the move.
Above the current price, first resistance at the $195 price level (price congestion resistance and bear channel baseline), followed by the $225 resistance level (price congestion resistance) and as a third and important resistance at $240 (price steering trend). By this level, the ETH/USD would continue in a bearish but not terminal scenario.
Below the current price, panic. First support at the price level of $154 (price congestion support), followed by support at $123 (price congestion support) and third support at $95 (price congestion support).
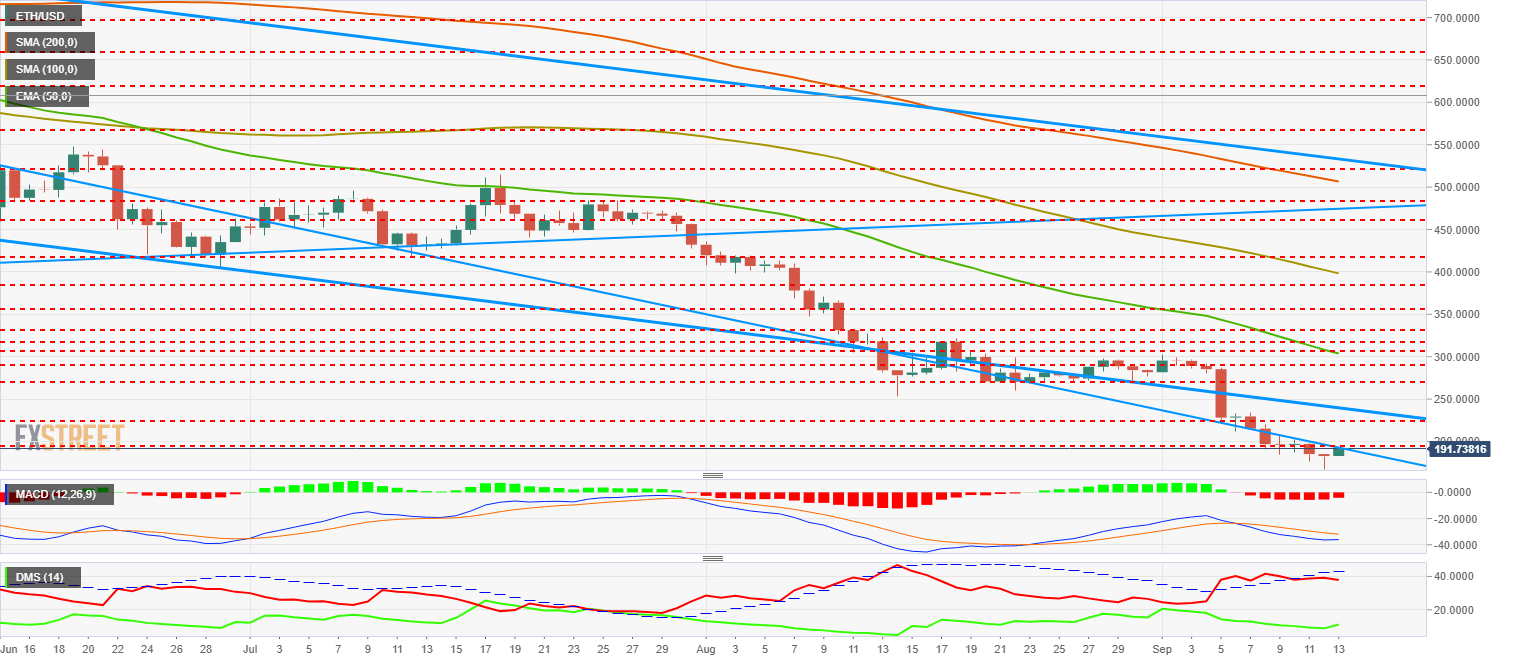
The MACD 1-D shows us an important turn of the indicator but it may still need several days before considering a bullish cross. It is likely that such an attempt will lead to sales that will cause a rapid downward movement. On the positive side, we must highlight the important divergence of the MACD with the relative lows.
The 1-D DMI shows bulls reacting timidly to the upside in the first rally in a week. Bears, on the other hand, decline and fall below the ADX line, a necessary condition for an upturn. To emphasize the divergence in the level of bulls in the last two relative minimums.
XRP/USD 1-D
The XRP/USD is the best stop of all. It recovers the resistance level at the price level of $0.27 (price congestion resistance) now acting as a support. Little is gained in price range but beating a resistance is remarkable given the pessimistic environment.
Above the current price, next resistance at the $0.30 price level (price congestion resistance), followed up by resistance at $0.32 (price congestion resistance) and thirdly the important resistance level at $0.346 (price congestion resistance and EMA50).
Below the current price, first support at the newly conquered price level of $0.27 (price congestion support), followed very closely by the second resistance level at $0.256 (price congestion support) and third at $0.239 (price congestion support).
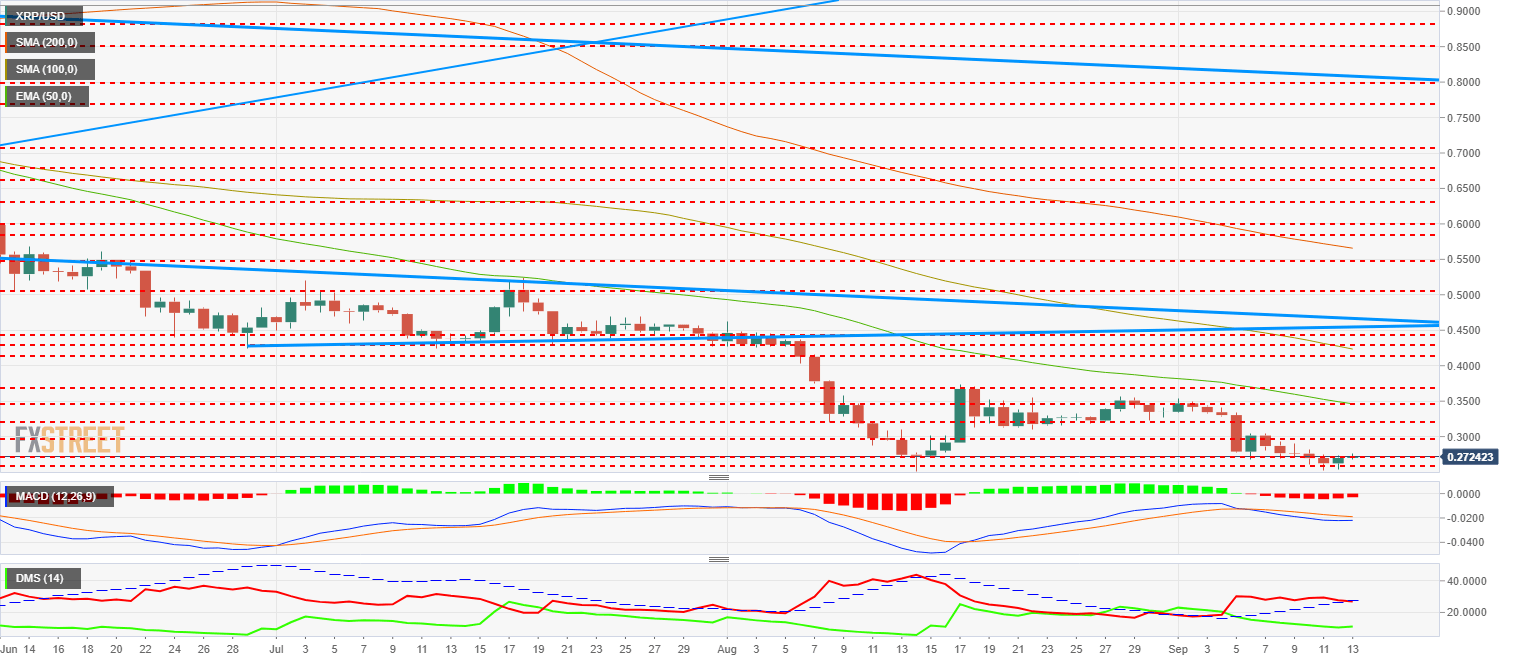
The MACD 1-D shows a structure similar to that of its analysis partners. Bullish trajectory still to be developed and strong divergence from the price. Strong bullish potential.
The DMI 1-D shows the bulls reacting slightly upwards while the bears are on their way to cutting the ADX downwards, a necessary condition for any bullish attempt. The bears remain at the level of the last few sessions with a slight decrease in the last few hours.
Author

Tomas Salles
FXStreet
Tomàs Sallés was born in Barcelona in 1972, he is a certified technical analyst after having completing specialized courses in Spain and Switzerland. He expanded his technical training following the guidance of great experts on the financial markets.


