Top 3 Price Prediction Bitcoin, Ethereum, Ripple: No such thing as a perfect trade
- Bitcoin price rises to the mid $17,000 zone, hinting at more uptrend potential.
- Ethereum price has risen by 12% since January 1.
- XRP price is up 6% in the last 24 hours.

The crypto market is providing short term trade ideas that could catalyze a larger trend reversal in the weeks to come. Still, the market seems more of a trade-by-trade environment than a buy and hodl.
Bitcoin price pressing forward
Bitcoin price continues to ascend, showing profitable opportunities on the smaller time frames. As of January 11, the peer-to-peer digital currency is up 5% on the year, and showing potential for more gains.
Bitcoin price currently auctions at $17,539. The slope of the developing uptrend appears to go vertical, suggesting BTC is starting a much stronger rally. Throughout the month, the 8-day exponential moving average and 21-day simple moving average have provided support for bulls entering the market, which is another positive sign for higher BTC price.
Still, investors should be aware that the trend is still in its early stages. The Relative Strength Index, an indicator used to gauge the force and momentum of market movements, shows the current BTC price hovering just below the final resistance level marked at 70.
A breakout above the current level would confirm the BTC uptrend and attract more cautious buyers to purchase the peer-to-peer digital currency on the next retracement after the surge. This strategy carries less risk, as the Bitcoin value may decline near the current level and erase the 5% gain seen in the month.
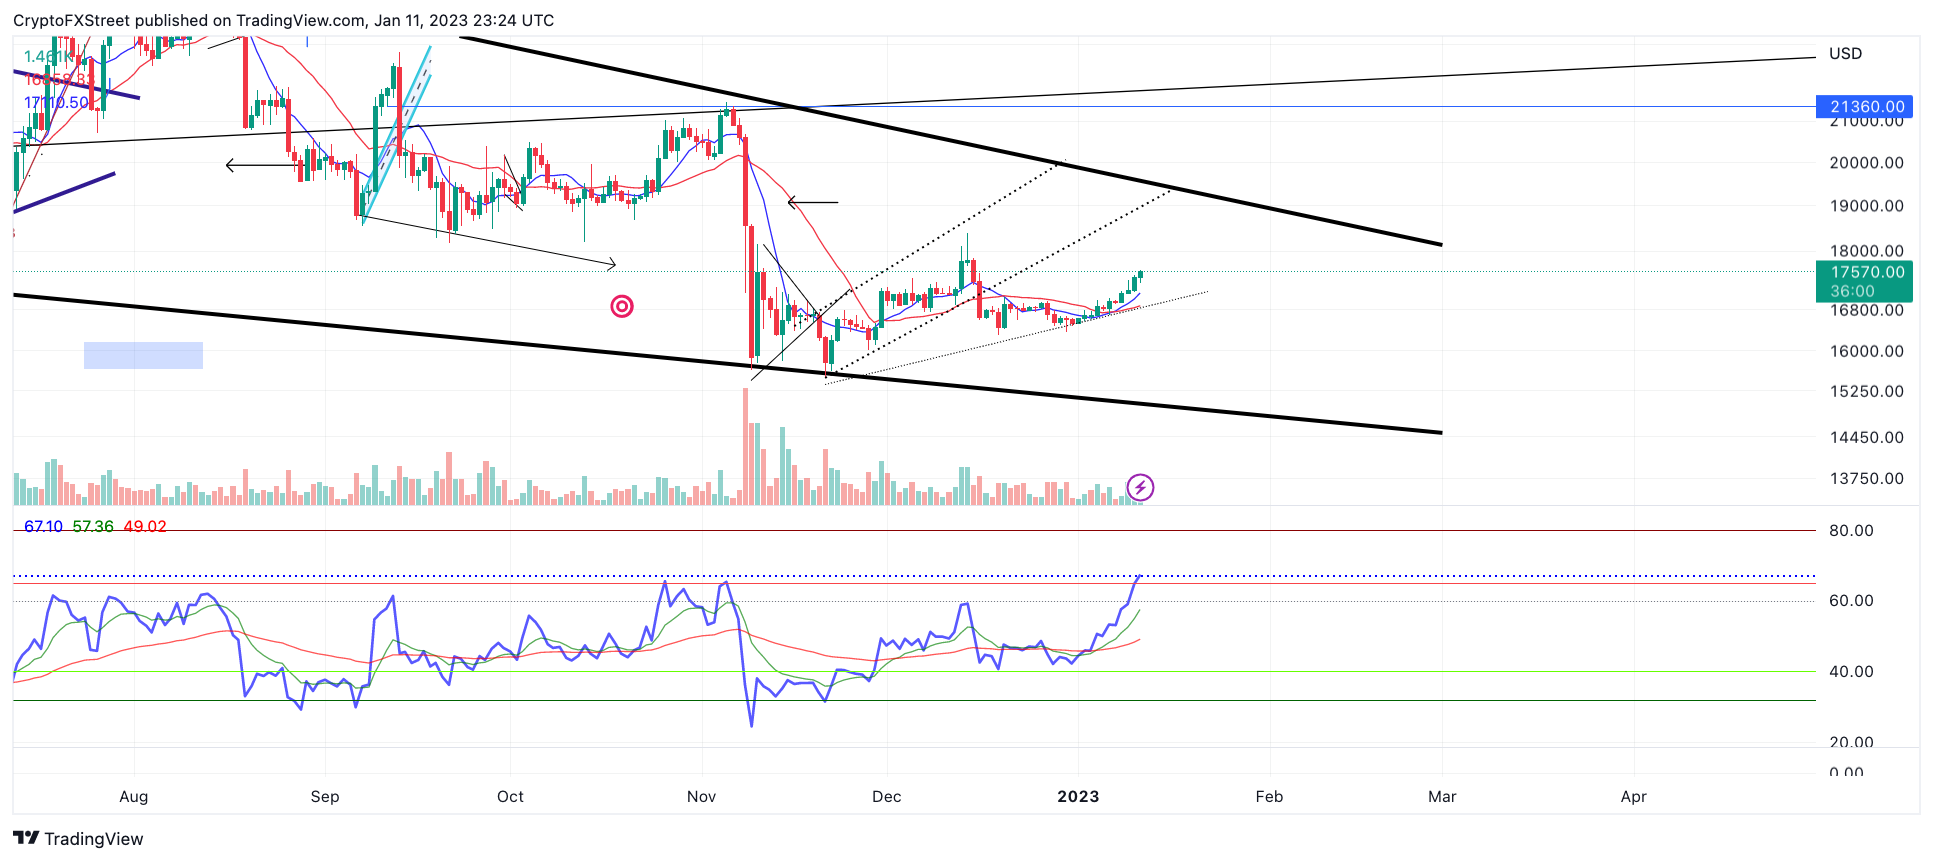
BTC/USDT 1-Day Chart
A break into the overbought territory confirms an uptrend for the coming weeks, likely with $19,000 as a first target. The Invalidation level would be the 2022 swing low at $15,476.
Ethereum price subject to resistance
Ethereum price has outperformed Bitcoin by 100%, rallying 12% since January 1. Similar to BTC, short-term indicators for the decentralized smart-contract token also indicate a favorable environment for gains. If market conditions persist, the ETH token will likely tag $1,400 and $1,450 before a stronger resistance enters the market.
Ethereum price currently auctions at $1,356. The bullish target zones are extracted from a Fibonacci retracement tool surrounding ETH's previous trading range in October. The Ethereum's move above the $1,230 level, which was the low point of October's range, on January 4, provided confirmation to using Fibonacci retracement on the specified range. Ultimately ETH could rally as high as the other side of the range near $1,600 in the coming weeks, with expected turbulence along the way.
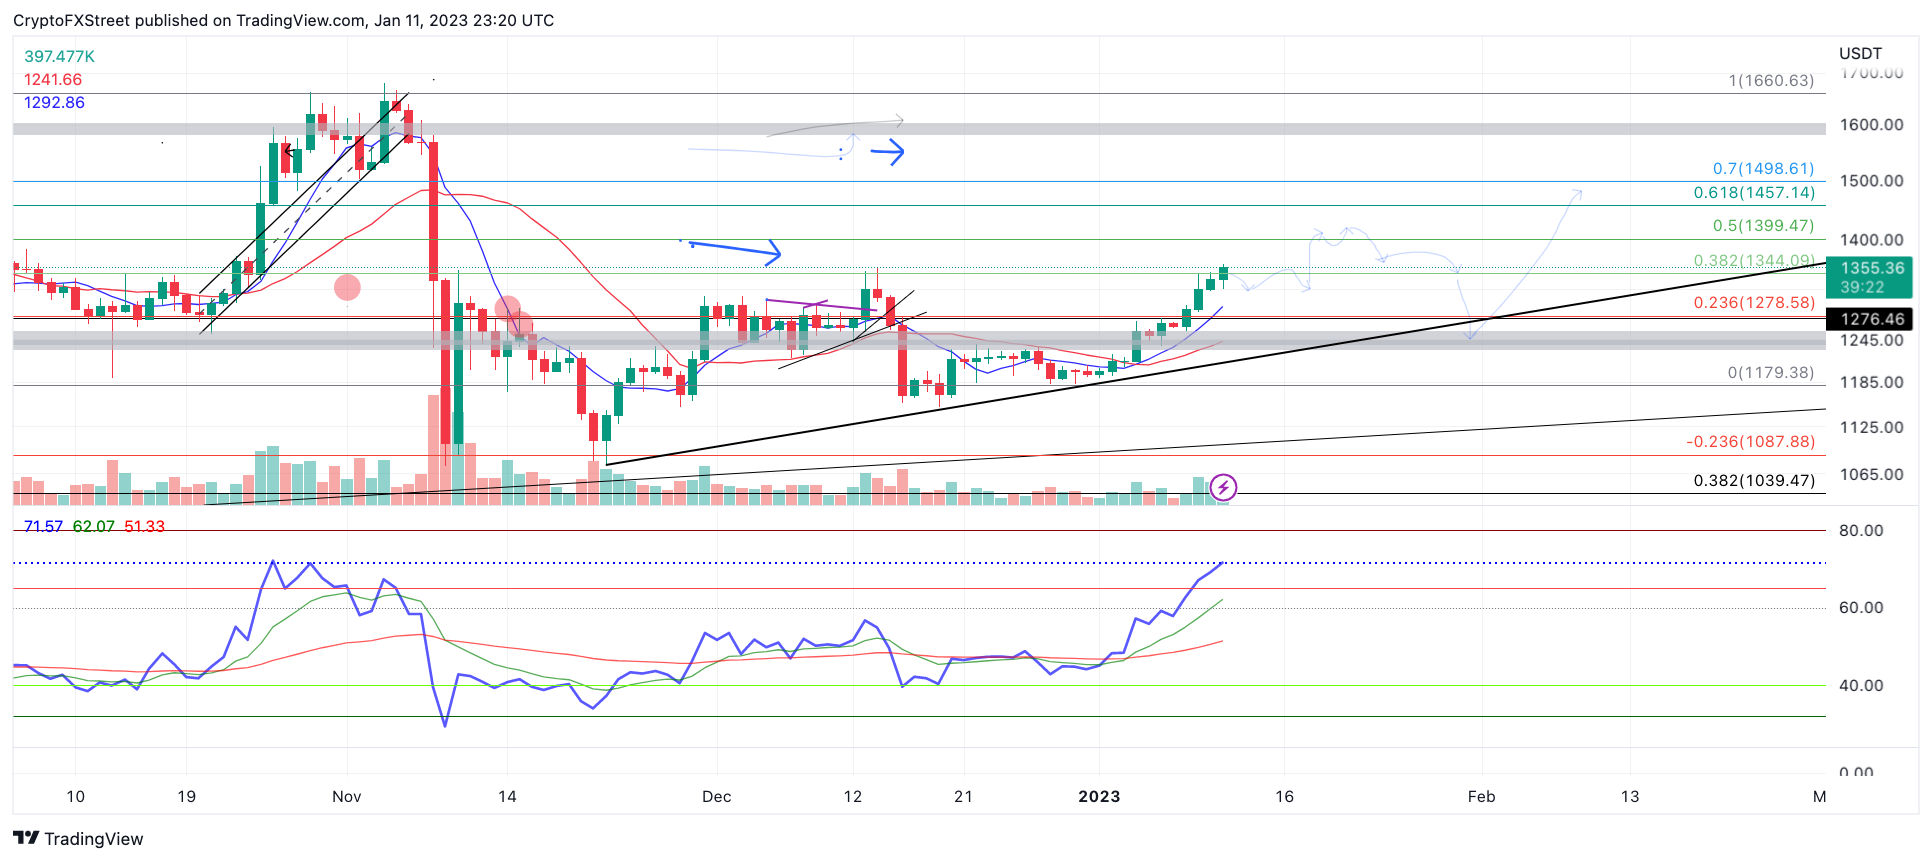
ETH/USDT 1-Day Chart
Invalidation of the uptrend could arise from a daily candlestick close beneath $1,328. A breach of the barrier could trigger a sell-off targeting the liquidity level near $1,070, resulting in a 23% decrease from Ethereum's current market value.
XRP price finally taking off
XRP price has traders honing in as the bulls accomplished a stunning trend change on smaller time frames. On January 11, the digital remittance token rose by 6% after finding support from the 8-day exponential and 21-day simple moving averages. The recent uptrend hike remains erected despite piercing multiple resistance levels in just 24 hours.
XRP price currently trades at $0.371, following the surpass of $0.366, the target from previous outlooks.Traders should be cautious around the current price level as the digital remittance token nears December's barrier of $0.38. A tag of the level could induce profit-taking followed by the next tradeable consolidation pattern.
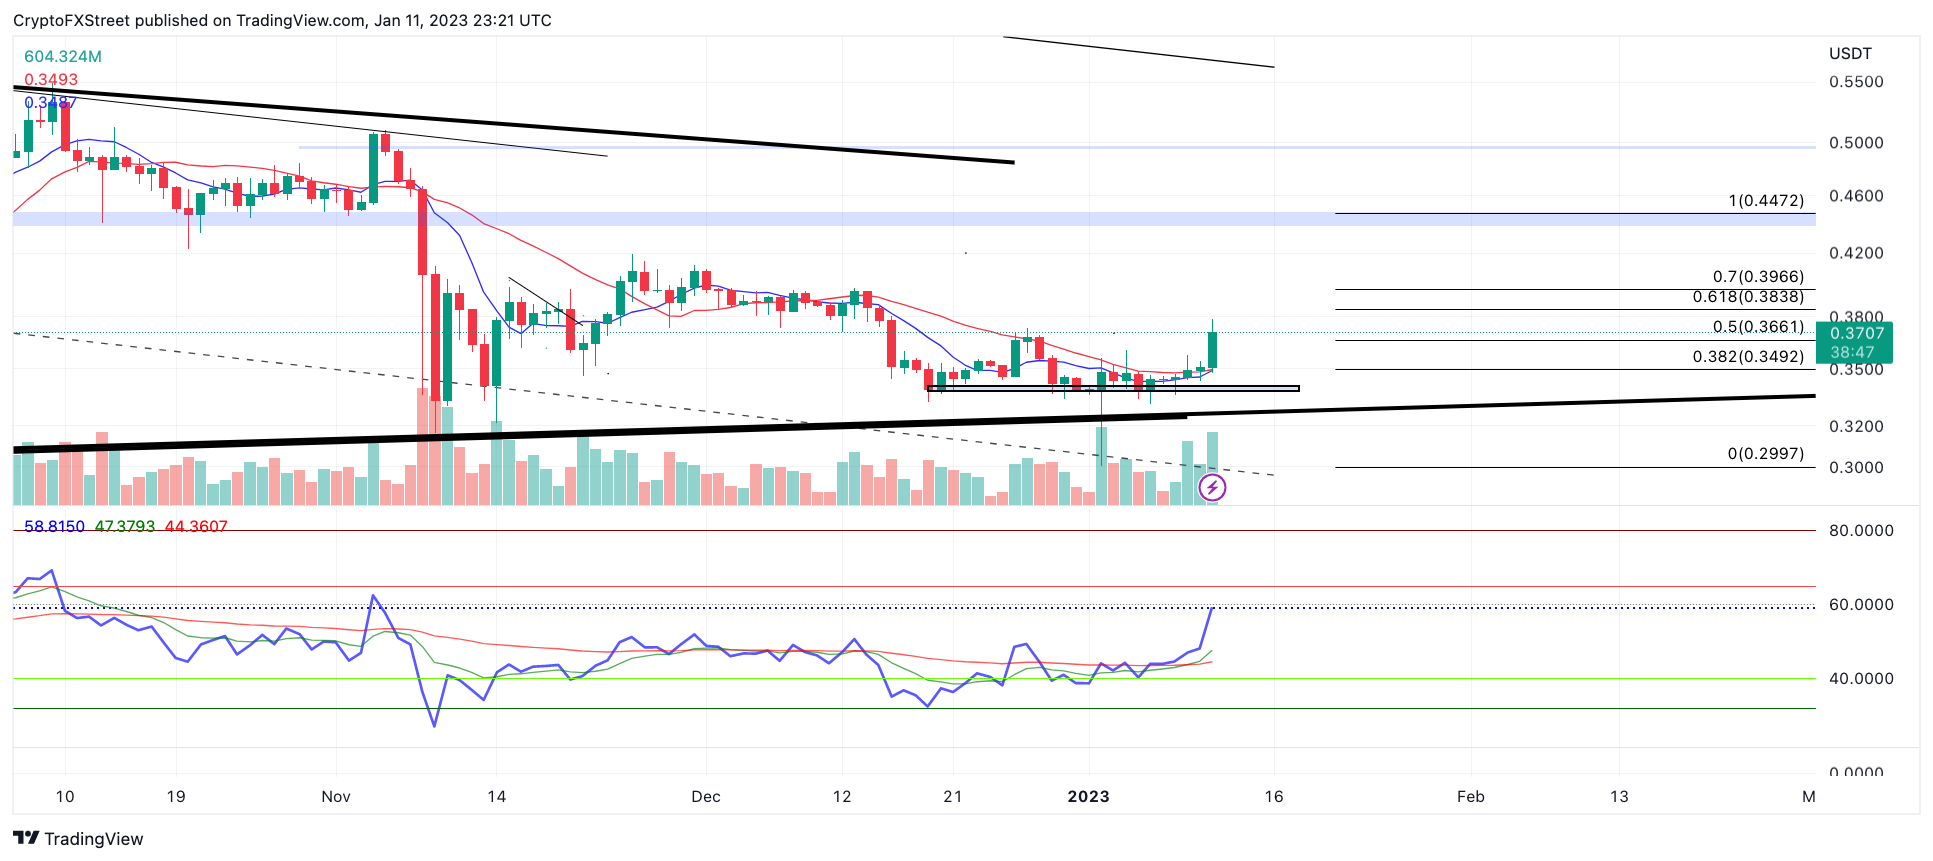
XRP/USDT 1-day chart
Based on the previous outlook, the uptrend's invalidation point remains below $0.343, the 8-day exponential moving average. A breach of the barrier could trigger a much more problematic scenario for XRP investors. Ultimately the $0.30 zone would be in jeopardy of a retest. The bearish scenario allows for a 17% decline from the current Ripple price.
Author

Tony M.
FXStreet Contributor
Tony Montpeirous began investing in cryptocurrencies in 2017. His trading style incorporates Elliot Wave, Auction Market Theory, Fibonacci and price action as the cornerstone of his technical analysis.


