Top 3 Price Prediction Bitcoin, Ethereum, Ripple: Euphoria takes its toll, volatility ahead
- Ethereum's failure at the $400 level kicked off a much-needed technical correction.
- Bitcoin regains market share in a typical rotation of consolidation phases.
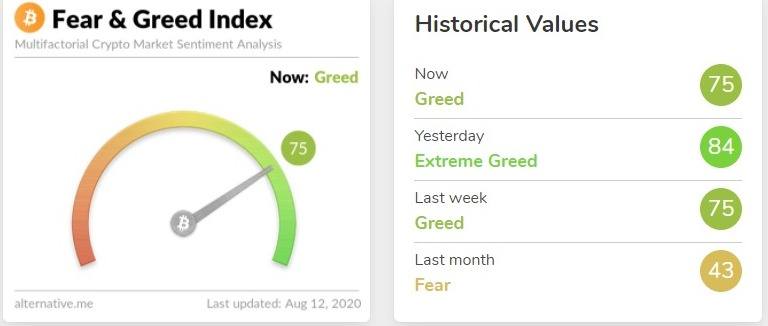
- Sentiment levels fall by 10% after reaching extreme euphoria levels.

The overbought level in the crypto market, reflected in extreme bullish sentiment levels, called for a pause in the uptrend and has come in recent hours.
Ethereum, the undisputed leader of the bullish movement, met stiff resistance due to price congestion at $400 and was unable to break out.
The crypto segment needed to look for fresh money and moves now into a price decline that will take the minds off of buyers who were reluctant to buy after a significant cumulative rise.
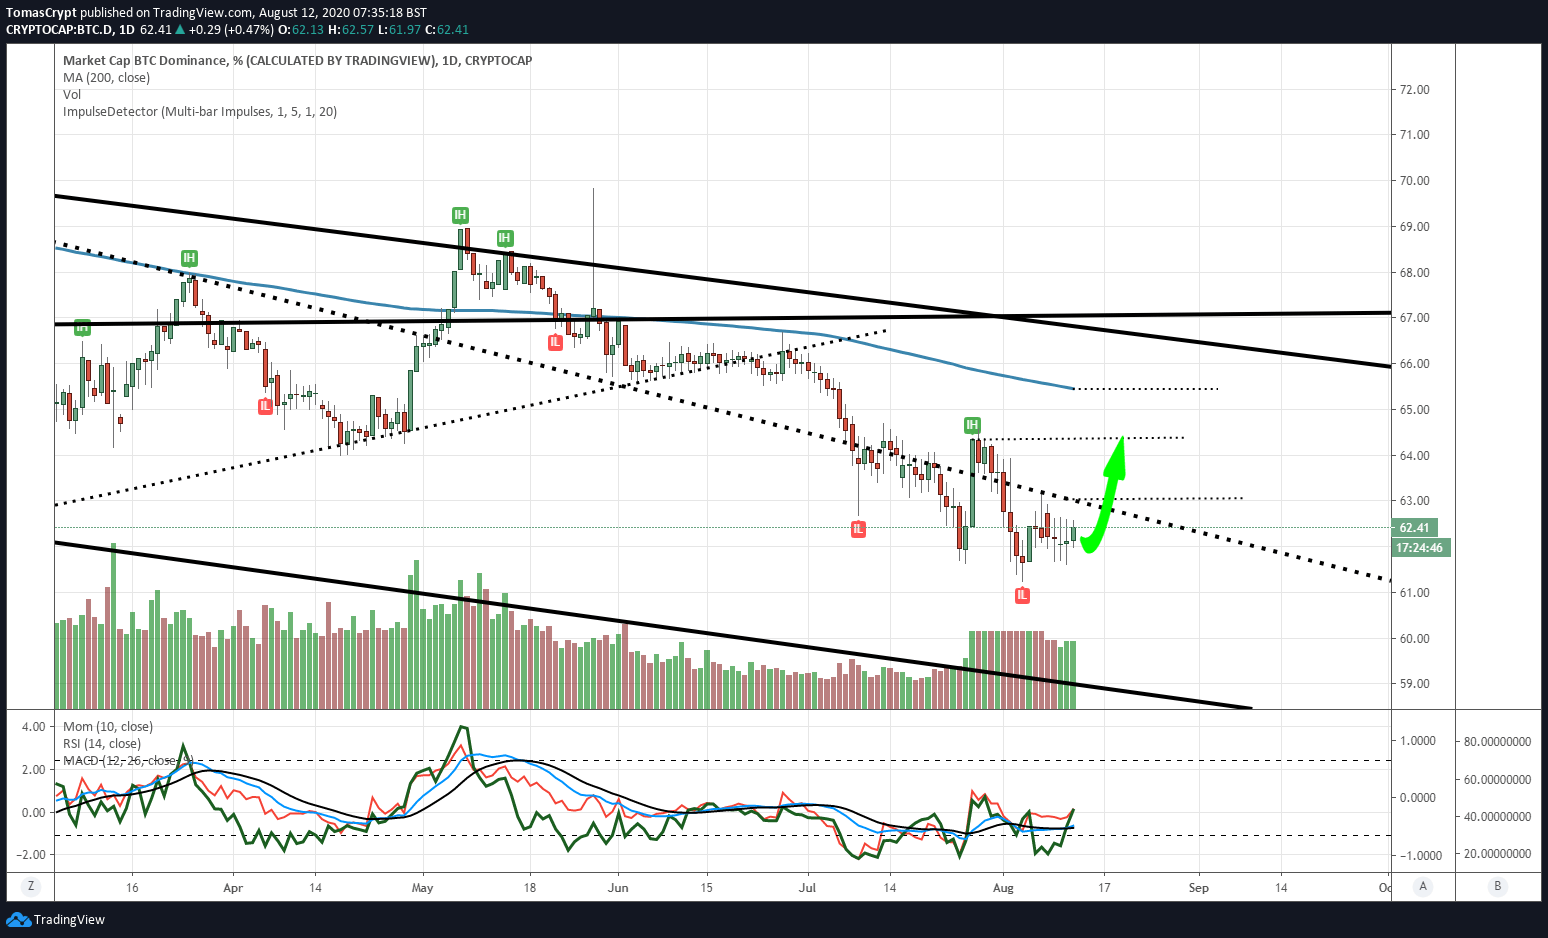
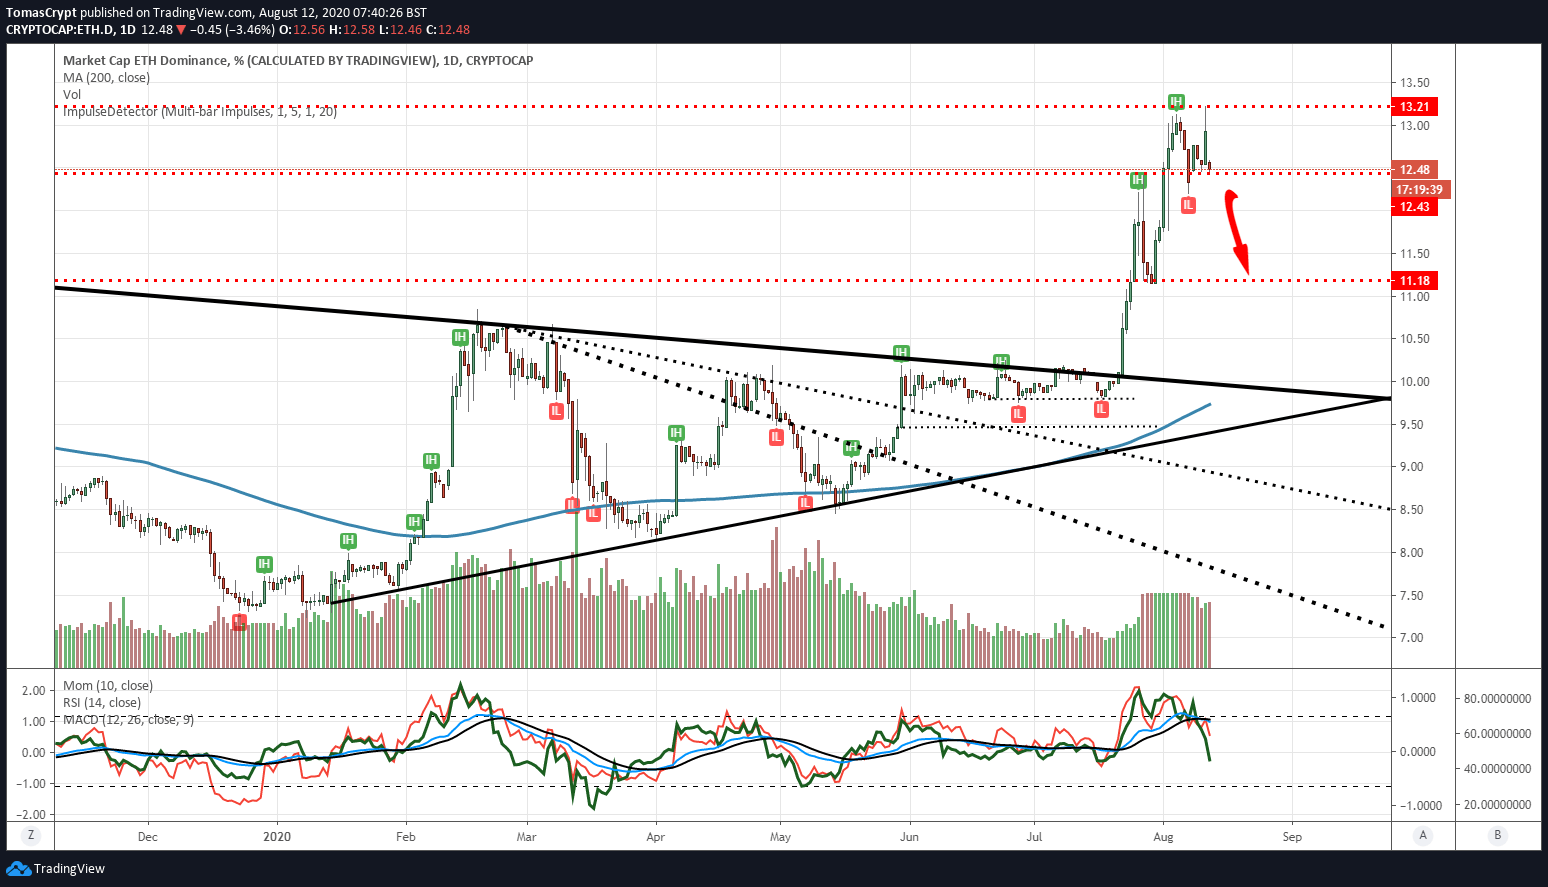
The Bitcoin and Ethereum dominance charts also suggested a change of course, with it now being Bitcoin's turn to make up some of the lost ground.
The effect on sentiment levels has been immediate, falling more than 10% to level 75 from 84 yesterday. This level is still high but should find traction again in the 60-65 range.
Today is an excellent day to retrieve past technical analysis and check the validity of the levels that we already announced months ago. The charts accompanying the report are from January 15, 2020.
ETH/BTC Daily Chart
The ETH/BTC pair is currently trading at the price level of 0.0329 and is losing support due to price congestion at 0.032. Throughout the bullish stretch, ETH/BTC has been moving between levels of congestion that have provided support and resistance generated in previous months. The price level of 0.030 seems to be the most likely target for the reversal that has begun in the last few hours.
Above the current price, the first resistance level is at 0.0332, then the second at 0.0351 and the third one at 0.0368.
Below the current price, the first support level is at 0.0316, then the second at 0.0302 and the third one at 0.0291.
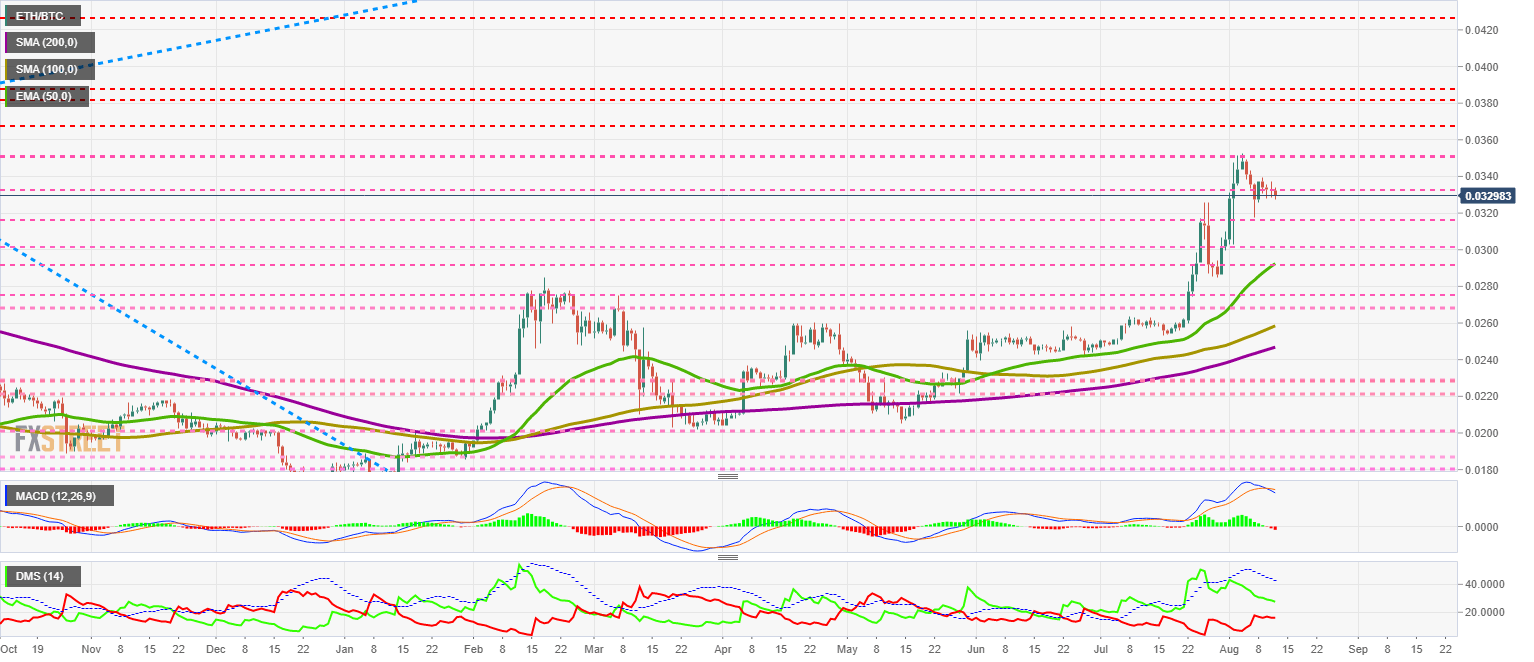
The MACD on the daily chart is crossing downward with a significant downward slope. Such a steep profile suggests volatility and wide range movements.
The DMI on the daily chart shows bulls and bears moving in parallel downwards. The lack of activity on the sell side could indicate doubts about the validity of the move, probably due to the recent change in trend.
BTC/USD Daily Chart
The BTC/USD pair is currently trading at the price level of $11355 and is on the verge of a significant upward movement that will take it above the price congestion resistance level of $11850. BTC/USD could look for support in the $9750-$10000 range.
Above the current price, the first resistance level is at $11850, then the second at $14000 and the third one at $17200.
Below the current price, the first support level is at $10650, then the second at $10350 and the third one at $9700.
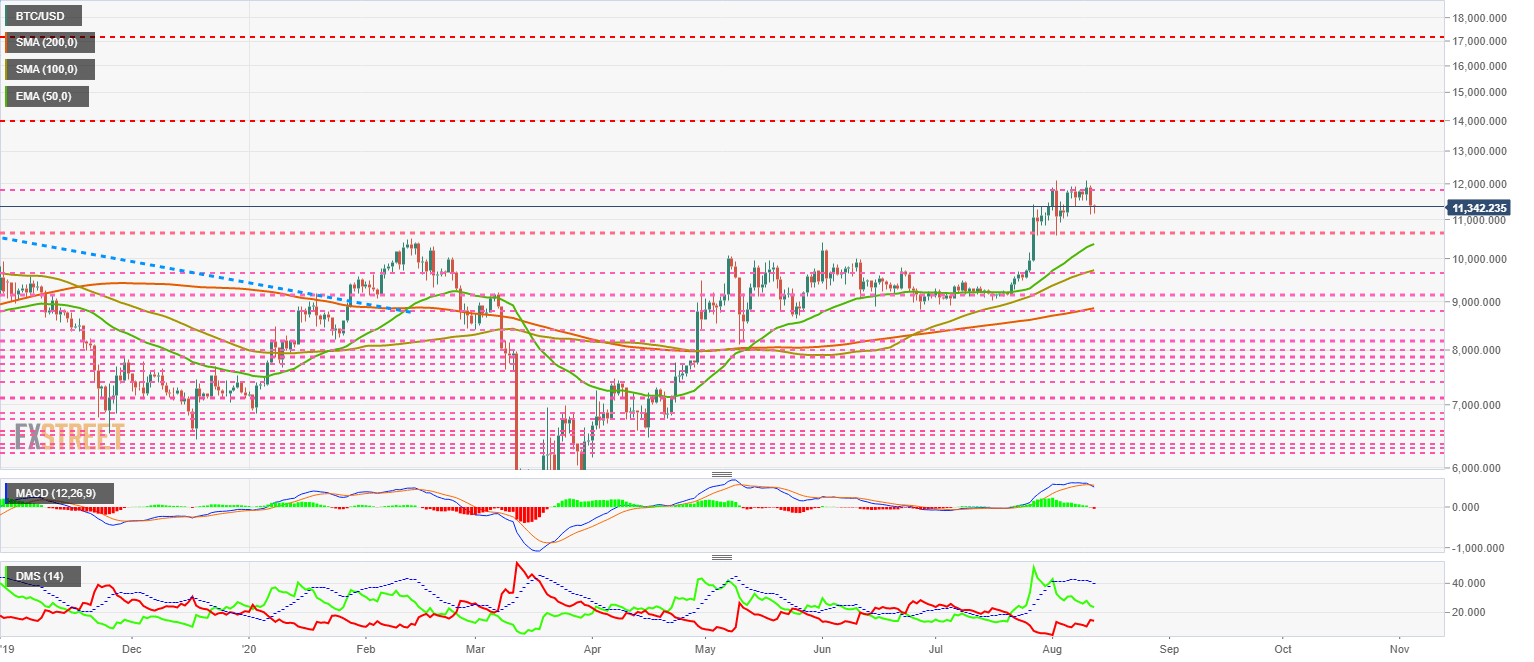
The MACD on the daily chart is crossing downward with a significant slope of the fast-moving average. This setup suggests that the technical retracement will be quick and relatively violent.
The DMI on the daily chart shows bulls and bears on a collision course, with a crossing horizon towards the end of the current week.
ETH/USD Daily Chart
The ETH/USD pair is currently trading at the $374 price level, and is giving way to the – now reinforced – resistance level of $400.
Above the current price, the first resistance level is at $400, then the second at $460 and the third one at $485.
Below the current price, the first support level is at $350, then the second at $315 and the third one at $300.
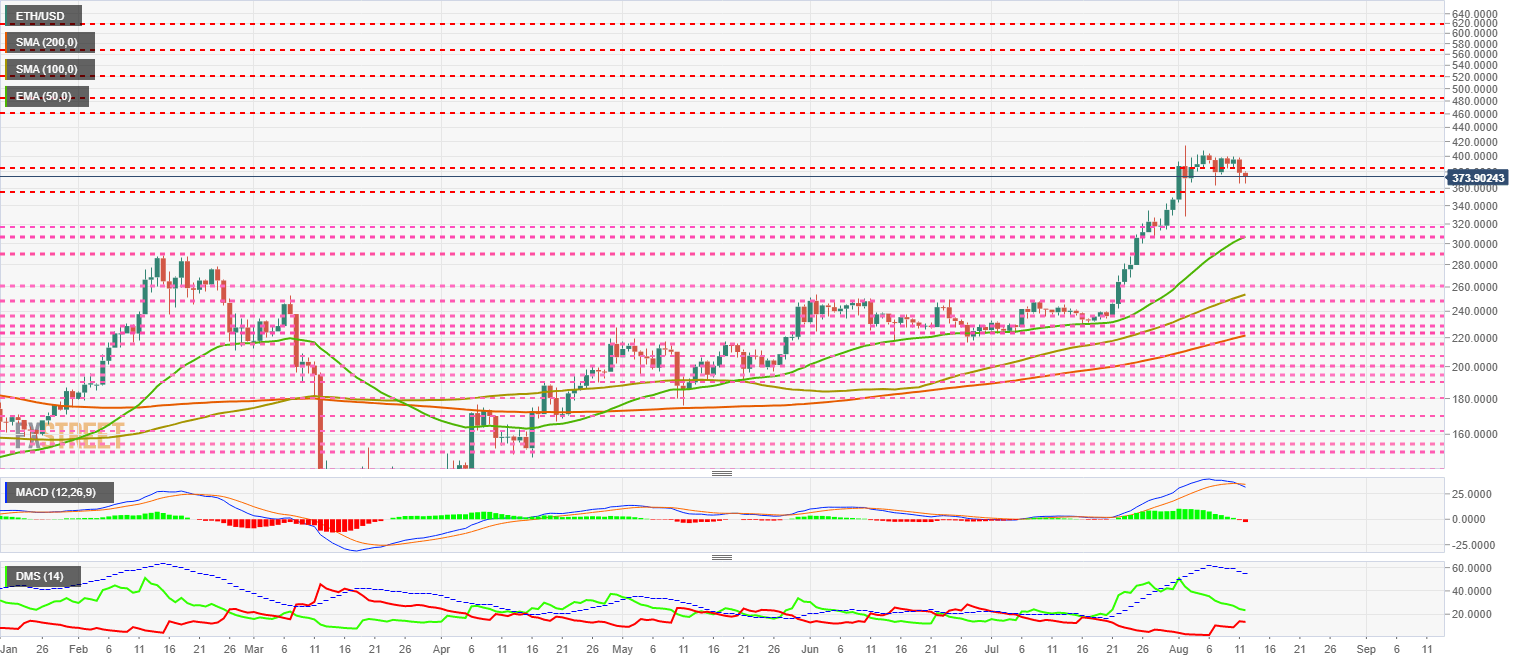
The MACD on the daily chart is crossing downward with a significant slope, which could lead to increased volatility in ETH/USD.
The DMI on the daily chart shows bulls and bears close. The cross between them is likely to occur before the end of this week. This setup could lead to a volatile trading session and a sharp change in direction.
XRP/USD Daily Chart
The XRP/USD pair is currently trading at the price level of $0.2775 and confirms the strength of the price congestion resistance level at $0.31. Ripple saved a critical technical situation during June and has recovered dramatically. The chart below was drawn on June 6, 2020.
Above the current price, the first resistance level is at $0.284, then the second at $0.308 and the third one at $0.34.
Below the current price, the first support level is at $0.263, then the second at $0.235 and the third one at $0.223.
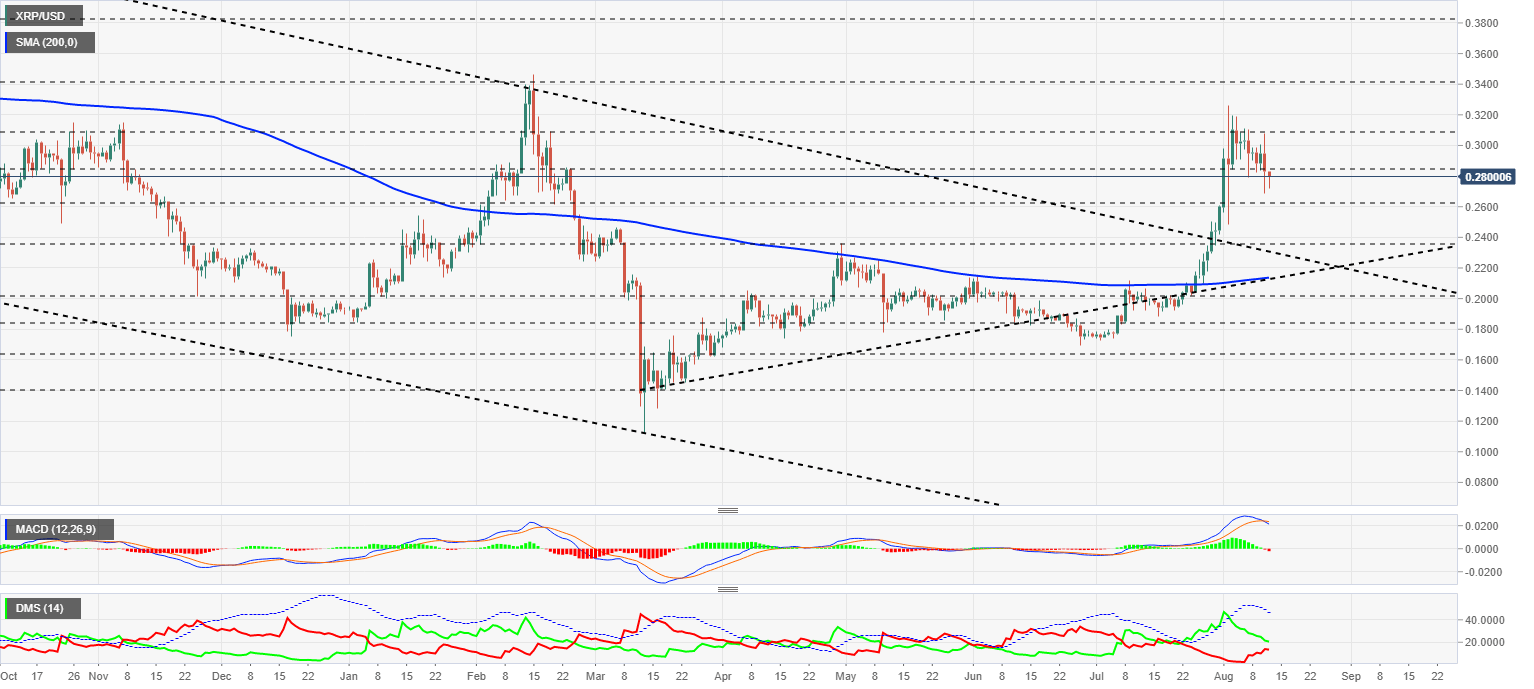
The MACD on the daily chart is crossing downwards and, as we have seen on Bitcoin and Ethereum, it is doing so with a significant downward slope. This setup implies that the pair is likely to go increasingly volatile, which in the case of the XRP/USD pair it could lead to exaggerated movements.
The DMI on the daily chart shows both sides of the market-facing each other, with a time horizon of a few hours before hostilities between the two groups begin.
Author

Tomas Salles
FXStreet
Tomàs Sallés was born in Barcelona in 1972, he is a certified technical analyst after having completing specialized courses in Spain and Switzerland. He expanded his technical training following the guidance of great experts on the financial markets.


