Ethereum Price Prediction: ETH bulls eye $2,500 after shattering crucial resistance level
- Ethereum price closed well above the MRI's breakout line at $2,345, suggesting a massive bullish momentum in play.
- Whales are accumulating non-stop, which hints at their interest in ETH at current price levels.
- A bullish divergence between the number of daily active addresses and exchange deposits reveals a move to $2,500 shortly.

Ethereum price has been on the rise despite a minor market-wide sell-off. This resilience suggests that ETH bulls are ready to drive it toward a new psychological level soon.
Ethereum price eyes record levels
Ethereum price consolidated between two converging trend lines that produced a series of lower highs and higher lows. Such price action is known as a symmetrical triangle pattern and forecasts a 36% move to either side.
Since ETH sliced through the upper trend line at $1,878 on March 31, a 36% upswing to $2,563 seems to be in play. The target is determined by measuring the distance between the first pivot high and low and adding it to the breakout point.
The Momentum Reversal Indicator's breakout line at $2,345 was a thorn in Ethereum's side. However, the buyers' bullish momentum allowed a breach of this critical level on Wednesday's trading session, resulting in a close at $2,432.
The last leg up for Ethereum price involves a mere 5.4% move to the upside to hit its intended target at $2,563.
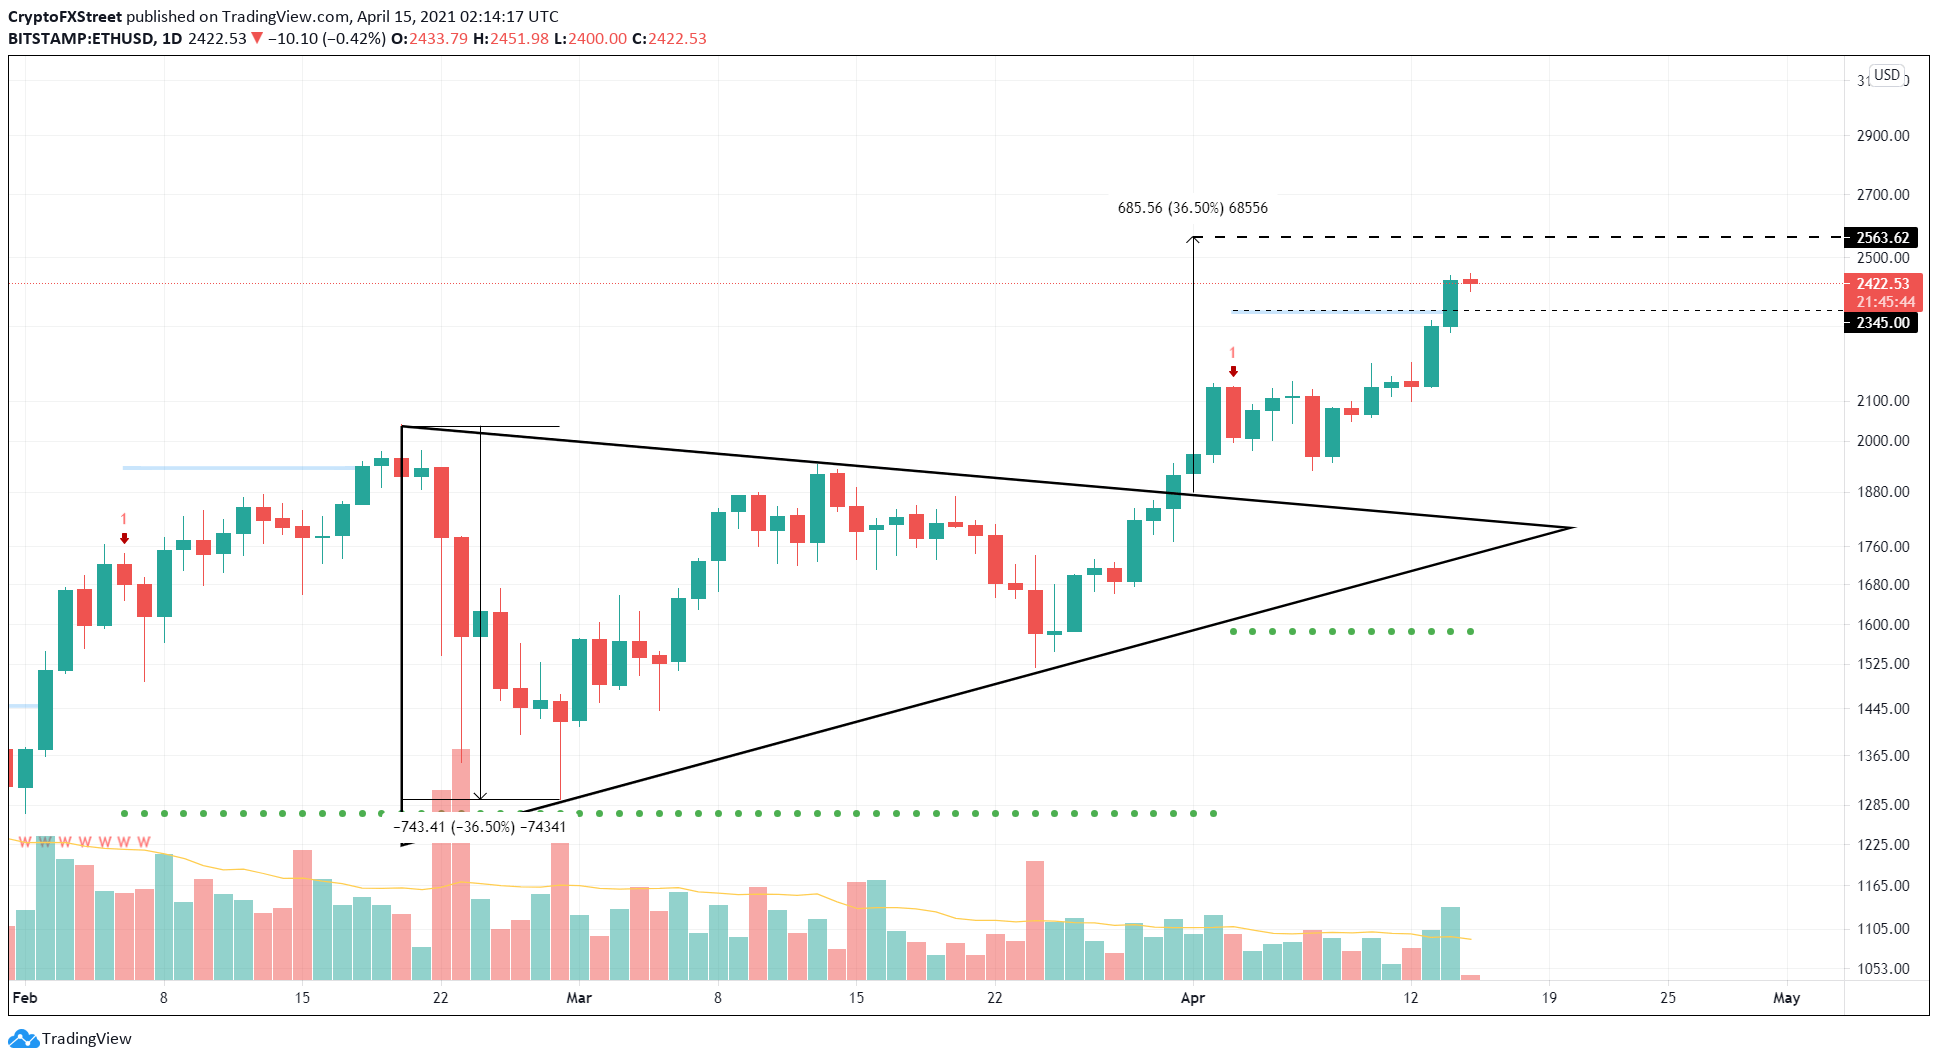
ETH/USD 1-day chart
Although rallies of this magnitude often see massive exchange deposits from investors willing to book profits, Ethereum investors seem unfazed. In fact, the 15,000 new daily active addresses have joined the ETH network since February 10, while the exchange deposit counts have dropped nearly 12,000 in the same time.
Such a divergence is a clear indication that Ethereum price is bullish and will continue to grow.
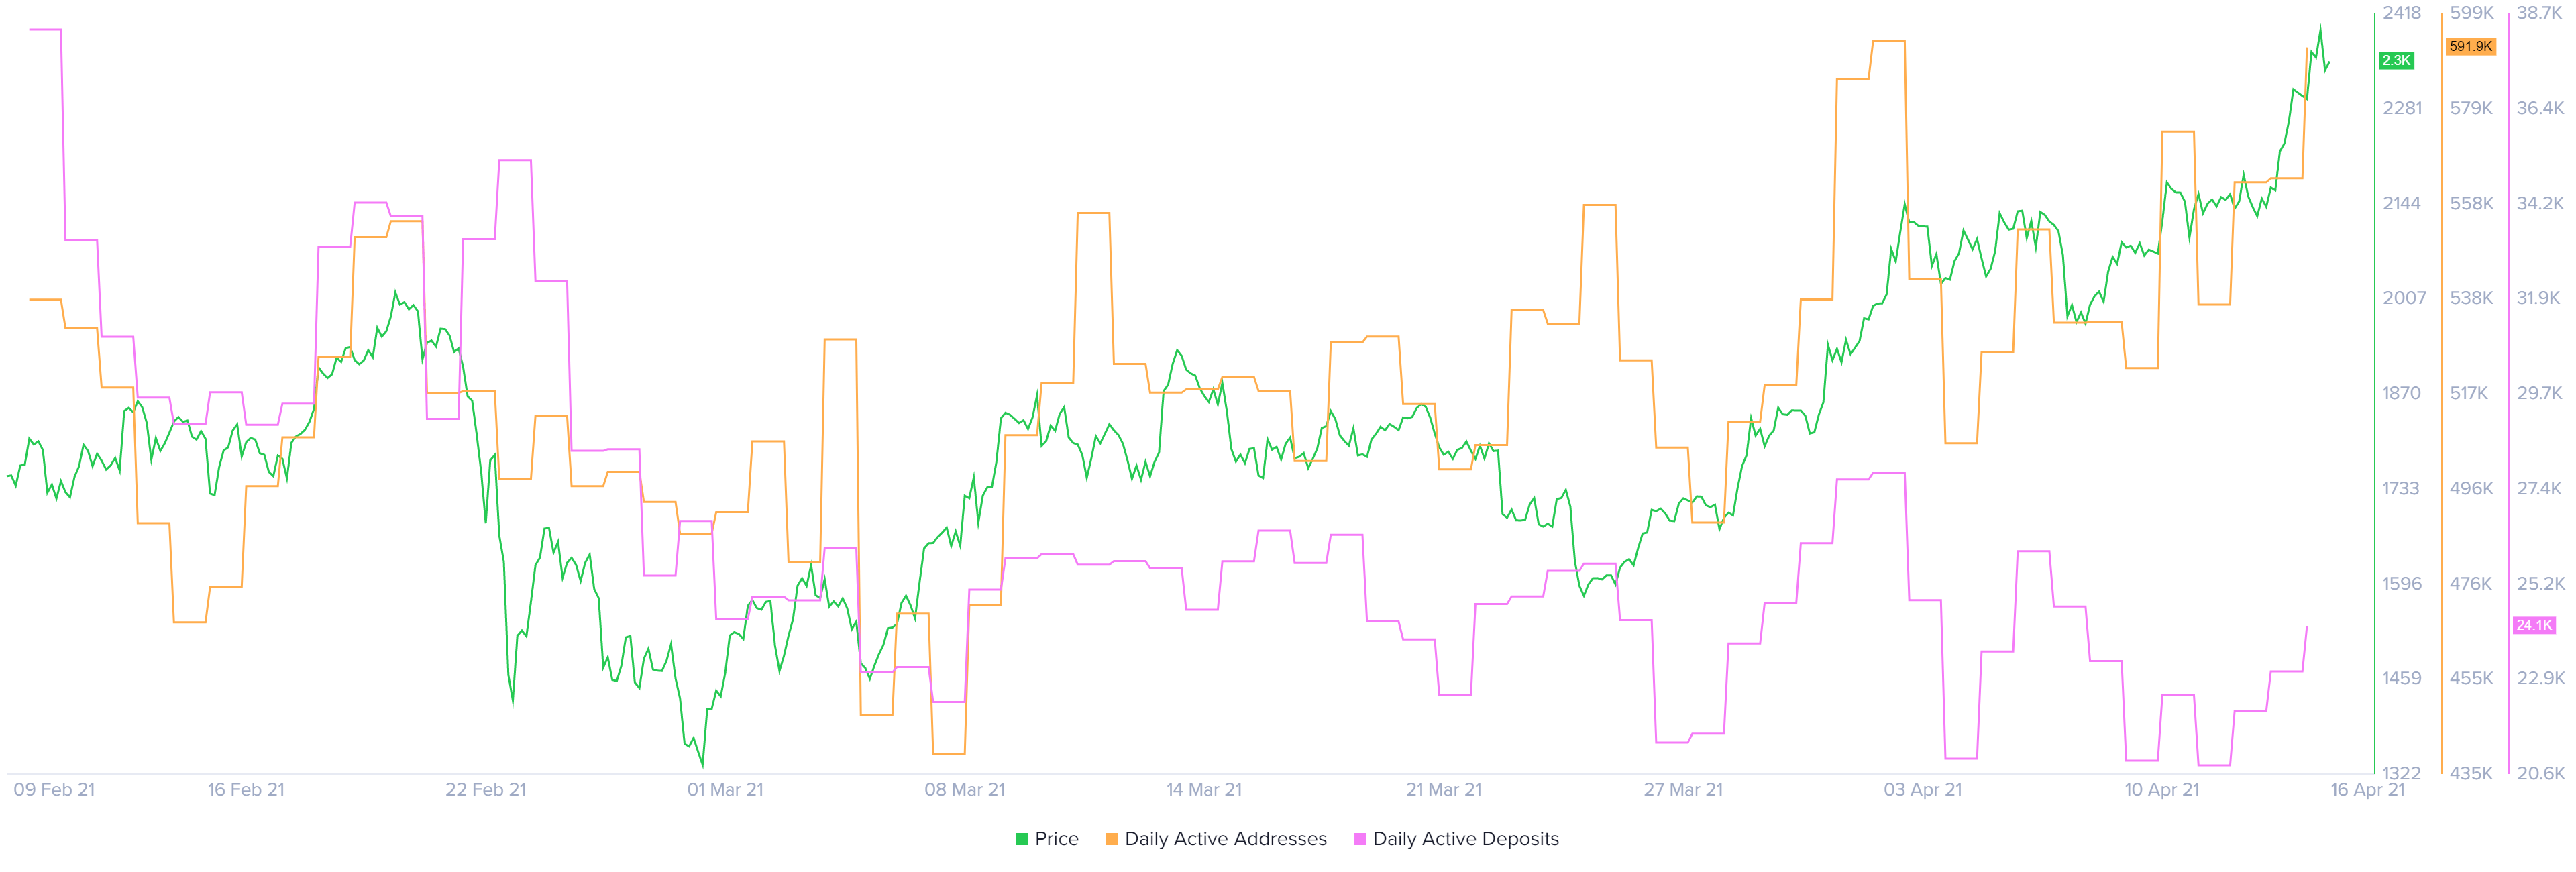
Ethereum daily active addresses and deposits chart
Providing a tailwind to Ethereum price are the wallets that hold between 100,000 to 1,000,000 ETH tokens. Since April 5, the balance of these addresses has increased by 9.4%, from 21.8% to 23.9%. This move suggests that whales are on an accumulation spree at the current price levels and are optimistic about the pioneer altcoin's performance in the near future.
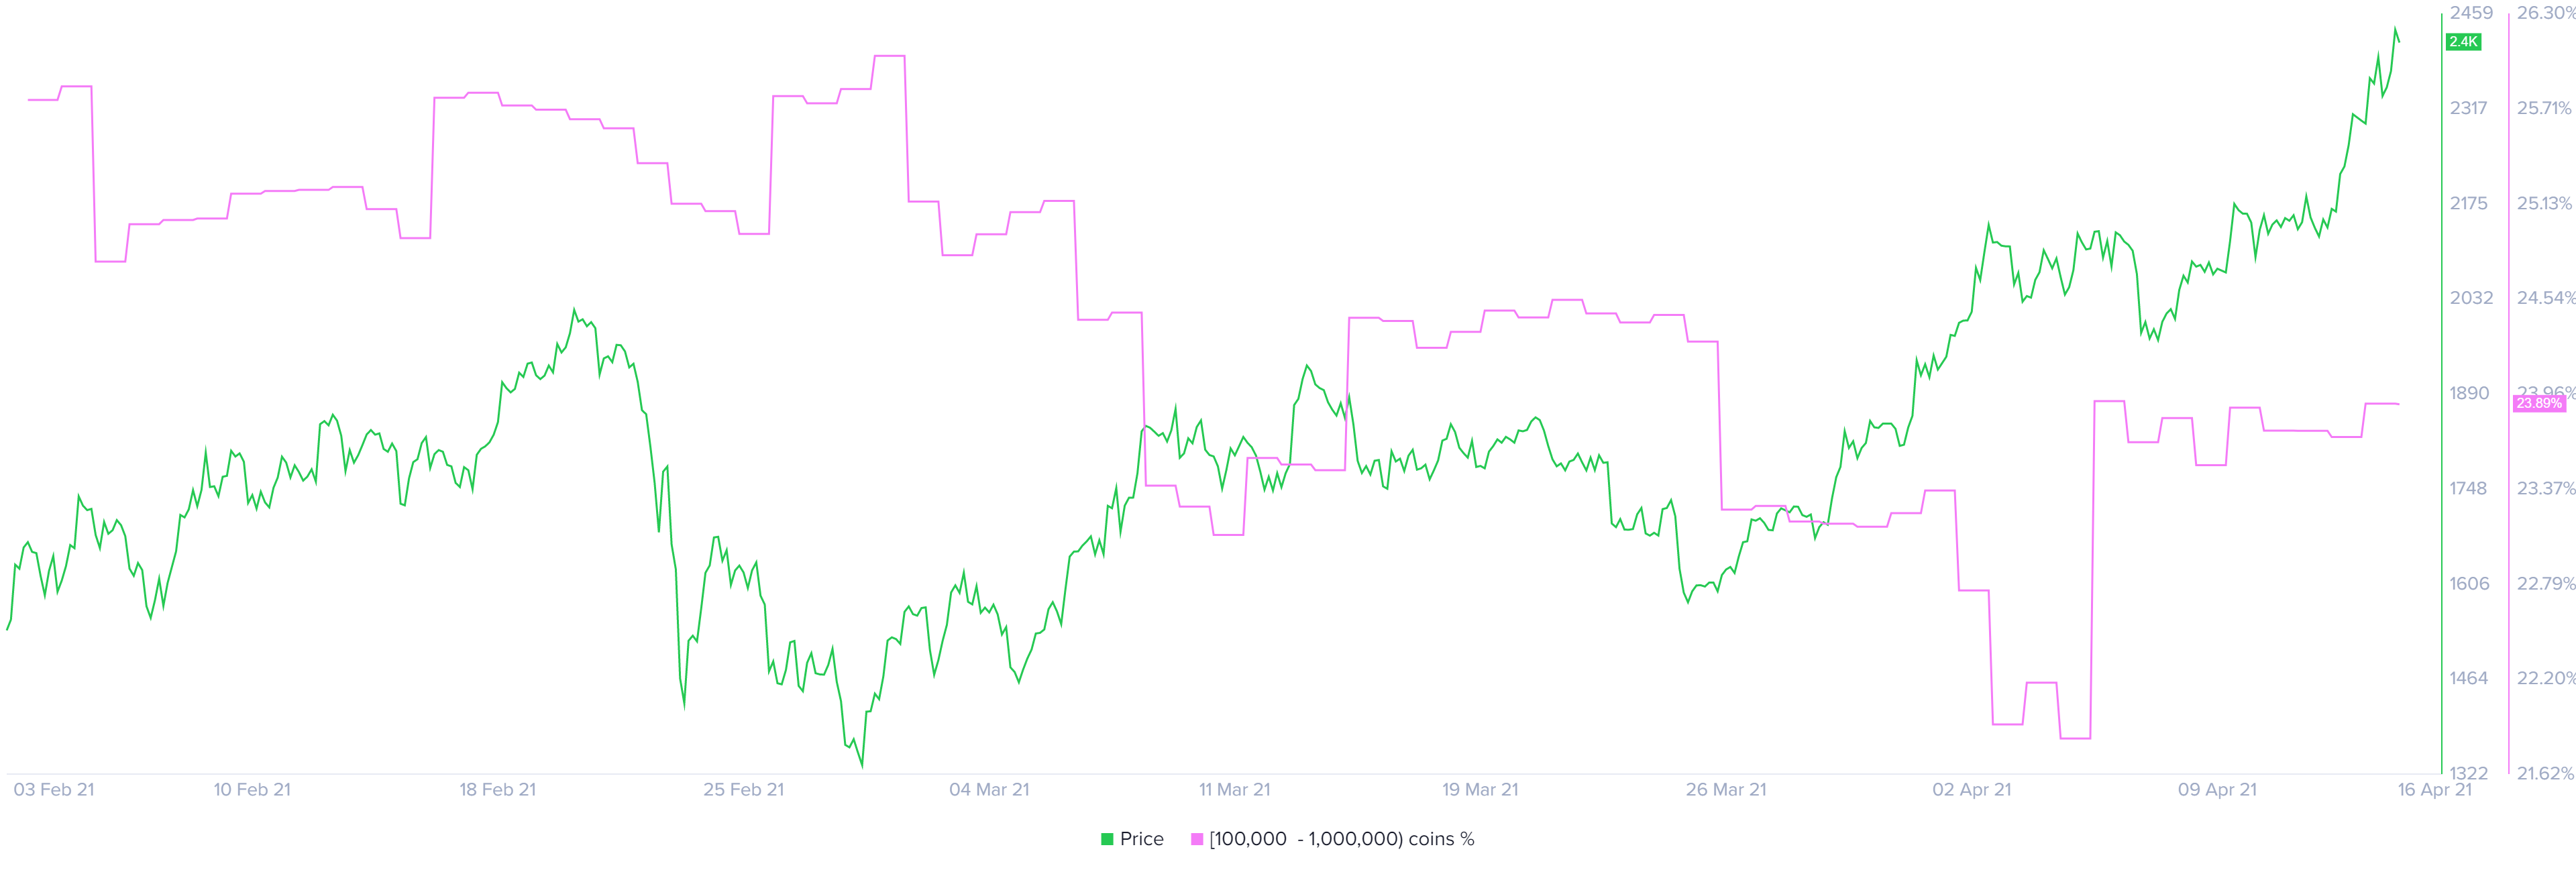
Ethereum supply distribution chart
Santiment's 30-day MVRV model for Ethereum serves as a proxy for the market participants in profit or loss. Hence, a surge in this metric suggests that an increasing number of investors are in profit and might be inclined to book profit, adding to the selling pressure.
Ethereum's MVRV value is currently sitting at 19.8%, but the cycle top appears to be around 27%, suggesting that there is room for growth.
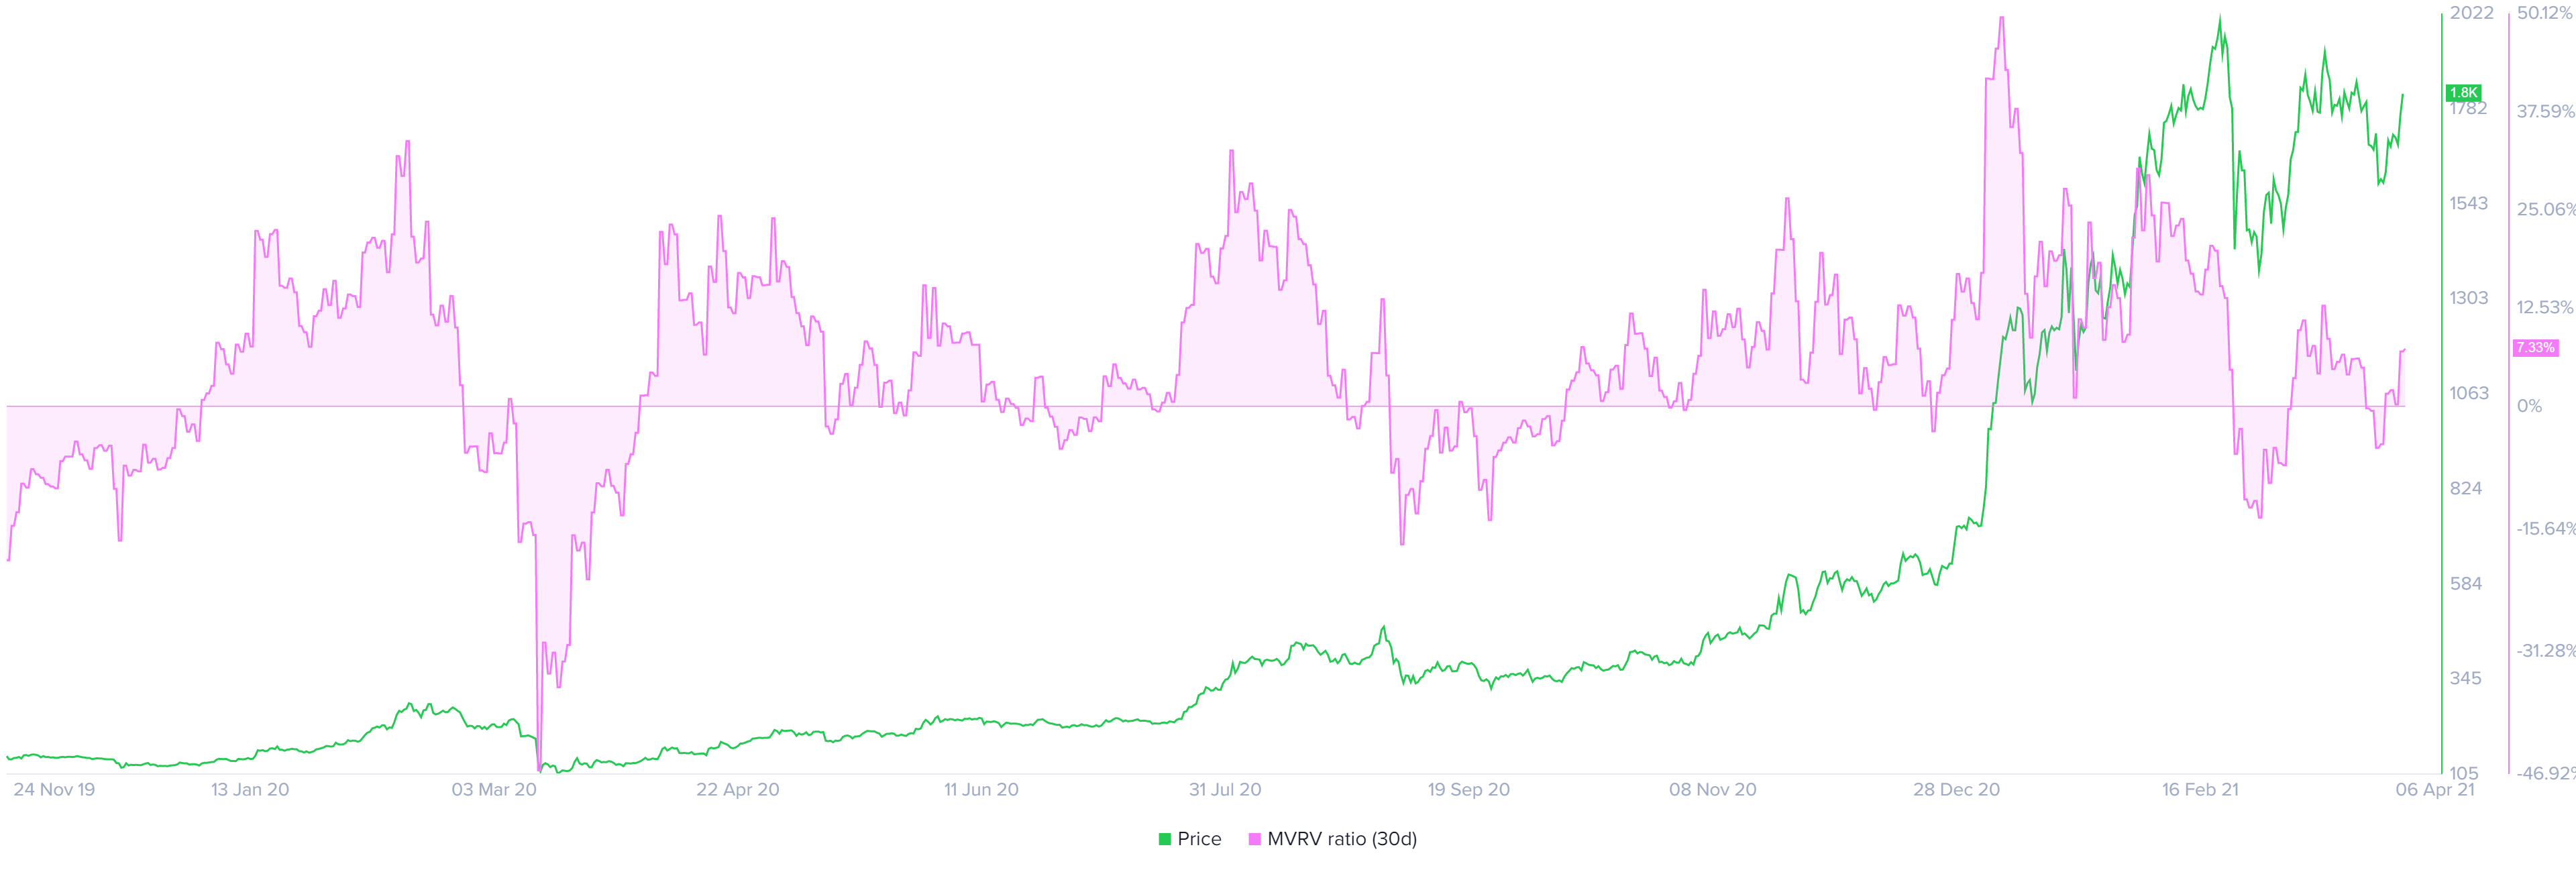
Ethereum MVRV chart
All in all, Ethereum price shows a bullish bias and is primed for a move higher. However, if investors start booking profits prematurely, this could hamper the upswing.
Therefore, a potential spike in selling pressure that leads to a decisive close below the breakout line at $2,345 will kick-start a retracement wave. If this were to happen, Ethereum price might drop 11% to the demand barrier at $2,081.
Author

Akash Girimath
FXStreet
Akash Girimath is a Mechanical Engineer interested in the chaos of the financial markets. Trying to make sense of this convoluted yet fascinating space, he switched his engineering job to become a crypto reporter and analyst.


