Top 3 Price Prediction Bitcoin, Ethereum, Ripple: Dominance war to push Ethereum to $270
- Bitcoin continues to lose market share, which could favor Ethereum and take it to the key resistance level at $270.
- Bitcoin remains in very narrow intraday ranges, encouraging possible explosive exits to the current impasse.
- XRP, trapped on the edge of the cliff, compelled to go above the $0.21 level in order to stay alive.

The Altcoin segment is still in full swing while the crypto board leaders, Bitcoin and Ethereum, remain stuck at the same levels as in recent weeks.
The dispute for market share, or dominance in technical terms, remains at a point of maximum tension.
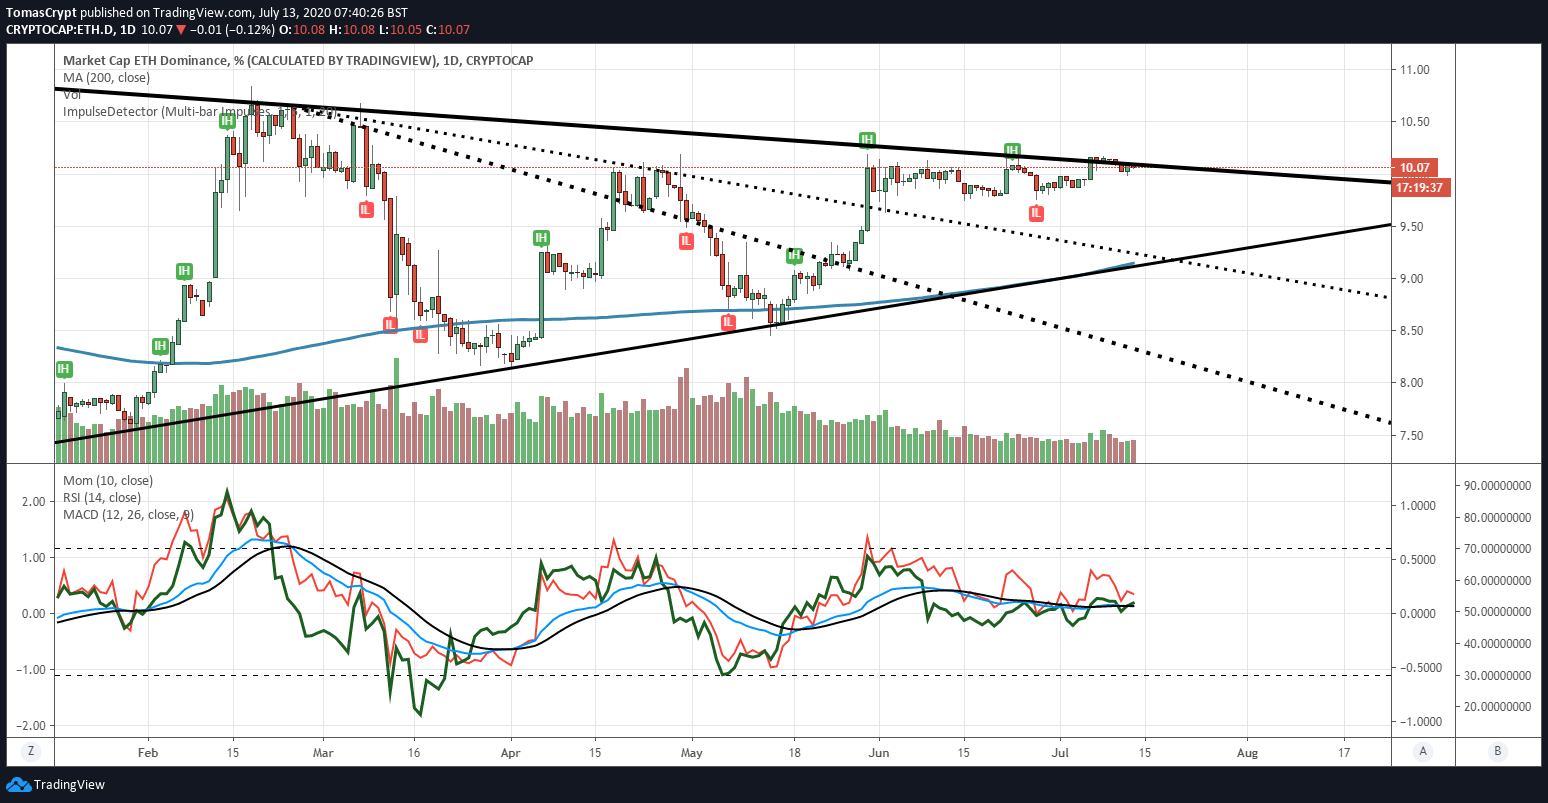
Ethereum managed to overcome days ago the highest resistance level by 10.10% of dominance level, but it can't get away and certify that its best moment has arrived.
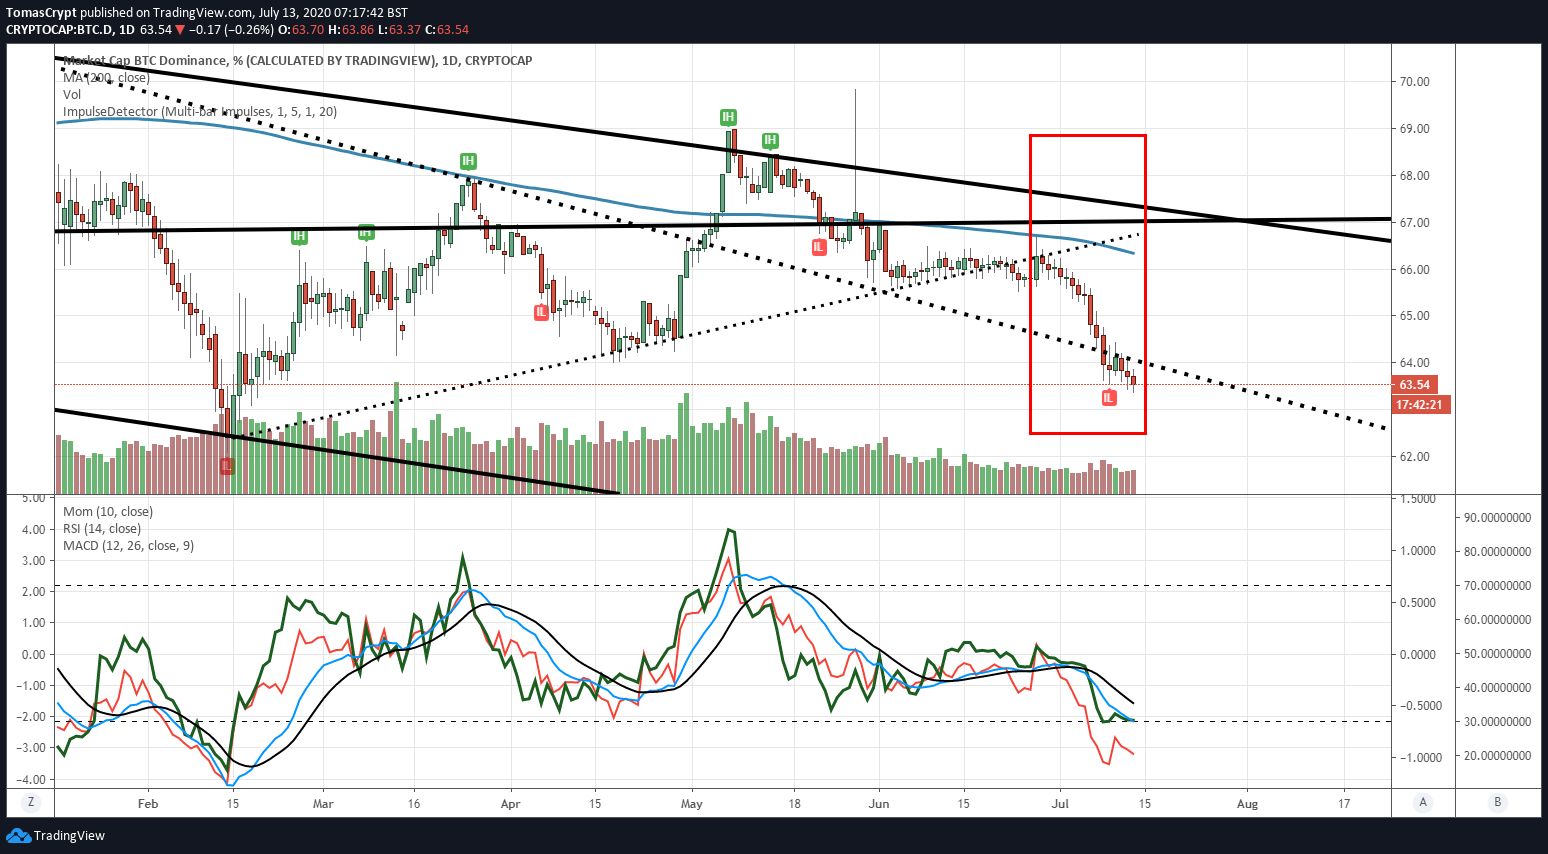
Bitcoin continues to lose market share, although it does not do so without putting up stiff resistance. The flow of capital out of Bitcoin is mainly moving towards the Top 20 Altcoins, such as Cardano, ChainLinkk or Stellar Lumens.
But what is the importance of this war for dominance in the crypto segment?
Not all participants in the crypto market aim to increase the balance sheet in fiduciary currency. In the long-term view, an important part of the trades with the sole objective of accumulating Bitcoin.
Bitcoin's strength or weakness concerning the Altcoin segment provides valuable information about where to position the portfolio to achieve the highest gain in Bitcoins.
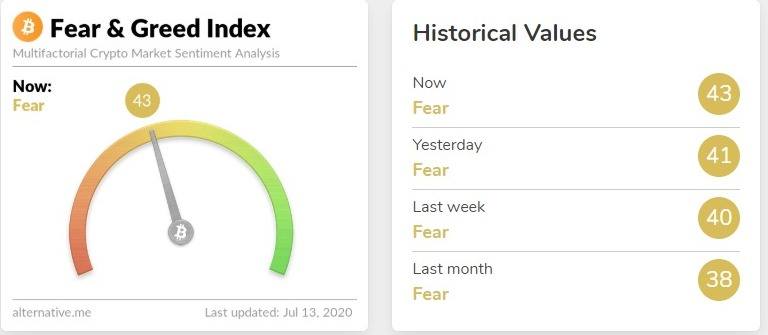
Source: alternative.me
The market sentiment level improves today to the 43rd level of the indicator prepared by the alternative.me site. The current value continues to indicate fear, something otherwise very reasonable when a market has been so many months under the rule of bears.
ETH/BTC Daily Chart
The ETH/BTC pair is currently trading at the price level of 0.02629, in an attempt to break out of the current resistance range at 0.02635.
The 200-day simple moving average accelerates its bullish profile and points towards the 0.030 level by the end of the summer.
Above the current price, the first resistance level is at 0.0276, then the second at 0.0295 and the third one at 0.0307.
Below the current price, the first support level is at 0.0258, then the second at 0.0248 and the third one at 0.0245.
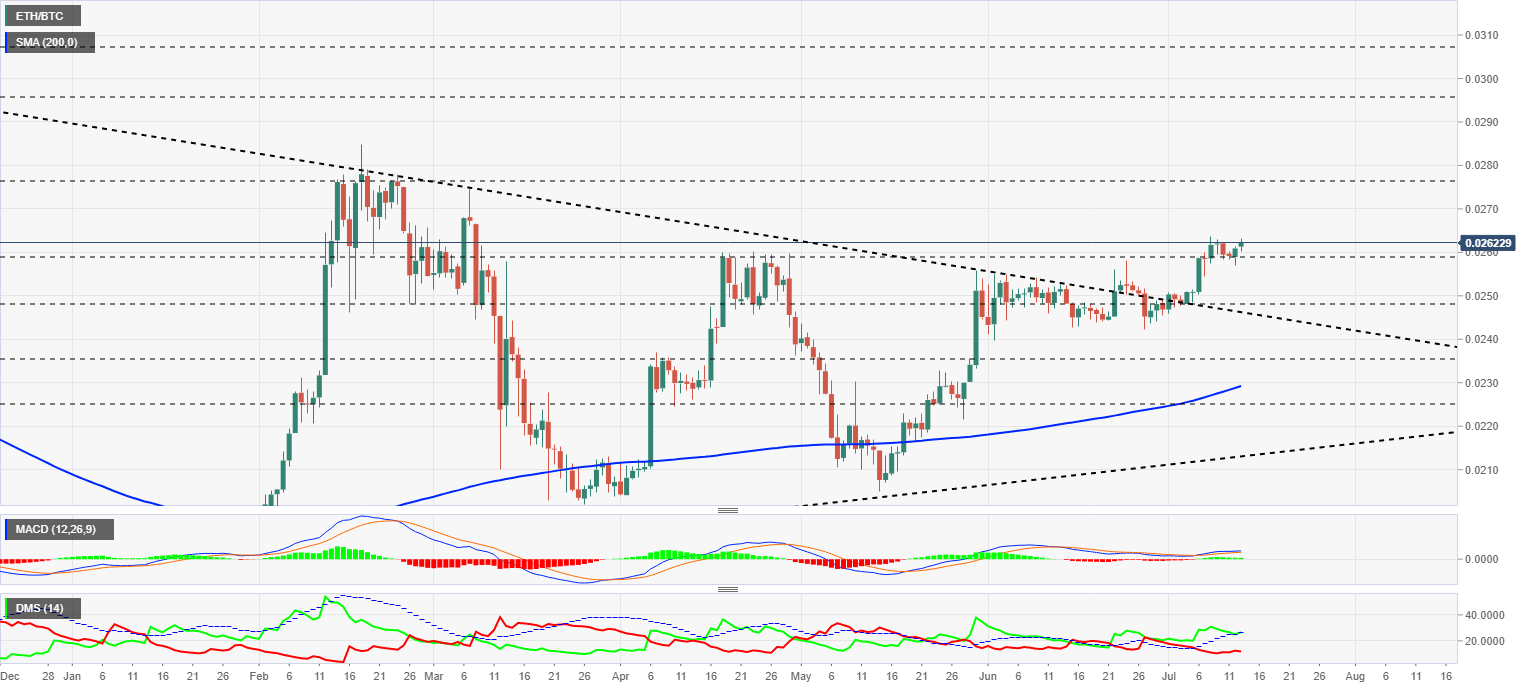
The MACD on the daily chart slightly increases the bullish profile and presents a favorable structure for more robust and broad-based development.
The DMI on the daily chart shows the bulls finding support on the ADX line. If the buying side bounces up from this position, the market can see an even bigger explosion of the Altcoin segment than the current one.
BTC/USD Daily Chart
The BTC/USD pair is currently trading at $9279, which is about the same price as the last four days. Since the relative lows in March, BTC/USD has never been in such a narrow range for four days.
Above the current price, the first resistance level is at $9500, then the second at $10400 and the third one at $10850.
Below the current price, the first support level is at $8850, then the second at $8750 and the third one at $8480.
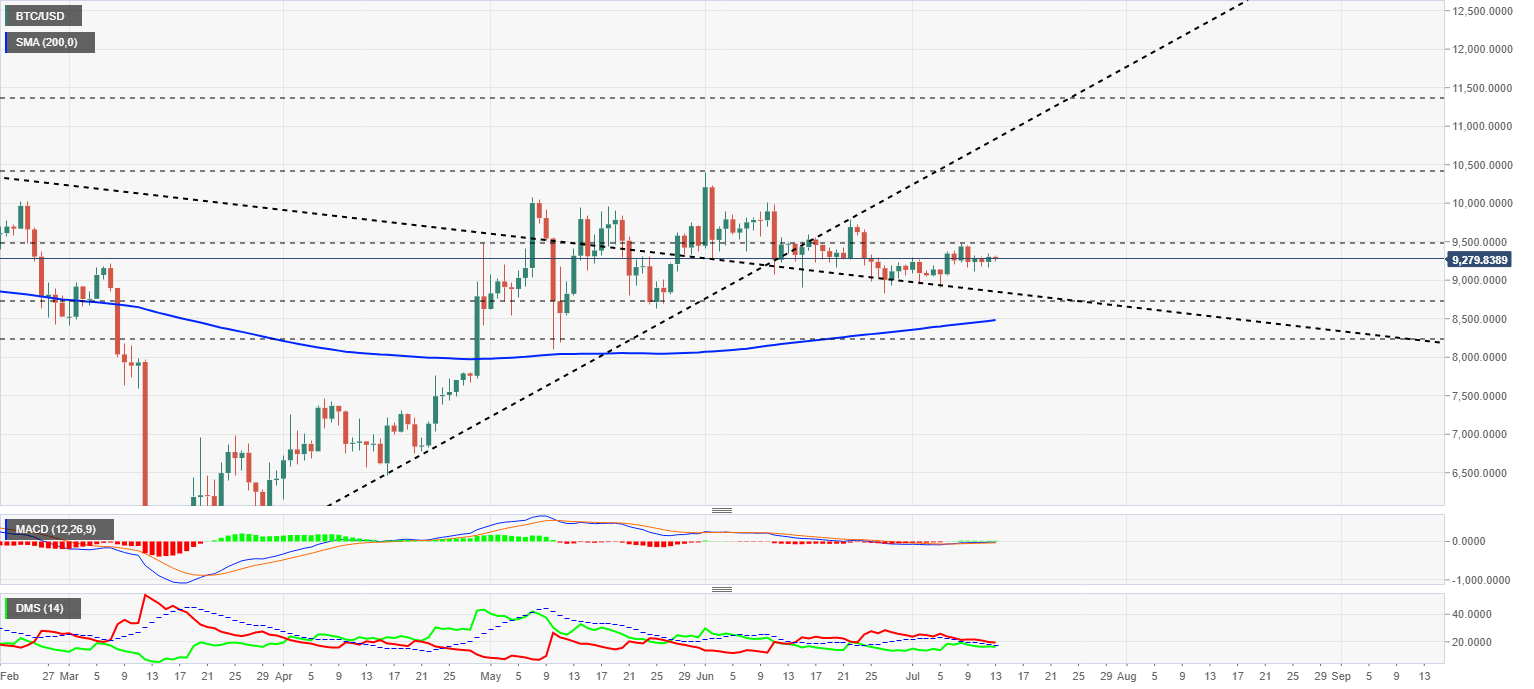
The MACD on the daily chart reflects the lack of movement and takes on a completely flat profile with no apparent direction or strength. This structure reinforces the idea of a possible sharp change that would bring this indicator back to life.
The DMI on the daily chart shows that the bears are still in command of the BTC/USD pair.
ETH/USD Daily Chart
The ETH/USD pair is currently trading at the price level of $243.7, unable to break through the price's congestion resistance at $245. The ETH/USD pair moves since early June within a congestion zone with support at the $220 level and a ceiling at $245.
The technical projection of a future move indicates, for a bullish breakout, the $270 level, while if the step is down the target would be the $195 level.
Above the current price, the first resistance level is at $245, then the second at $260 and the third one at $270.
Below the current price, the first support level is at $235, then the second at $220 and the third one at $200.
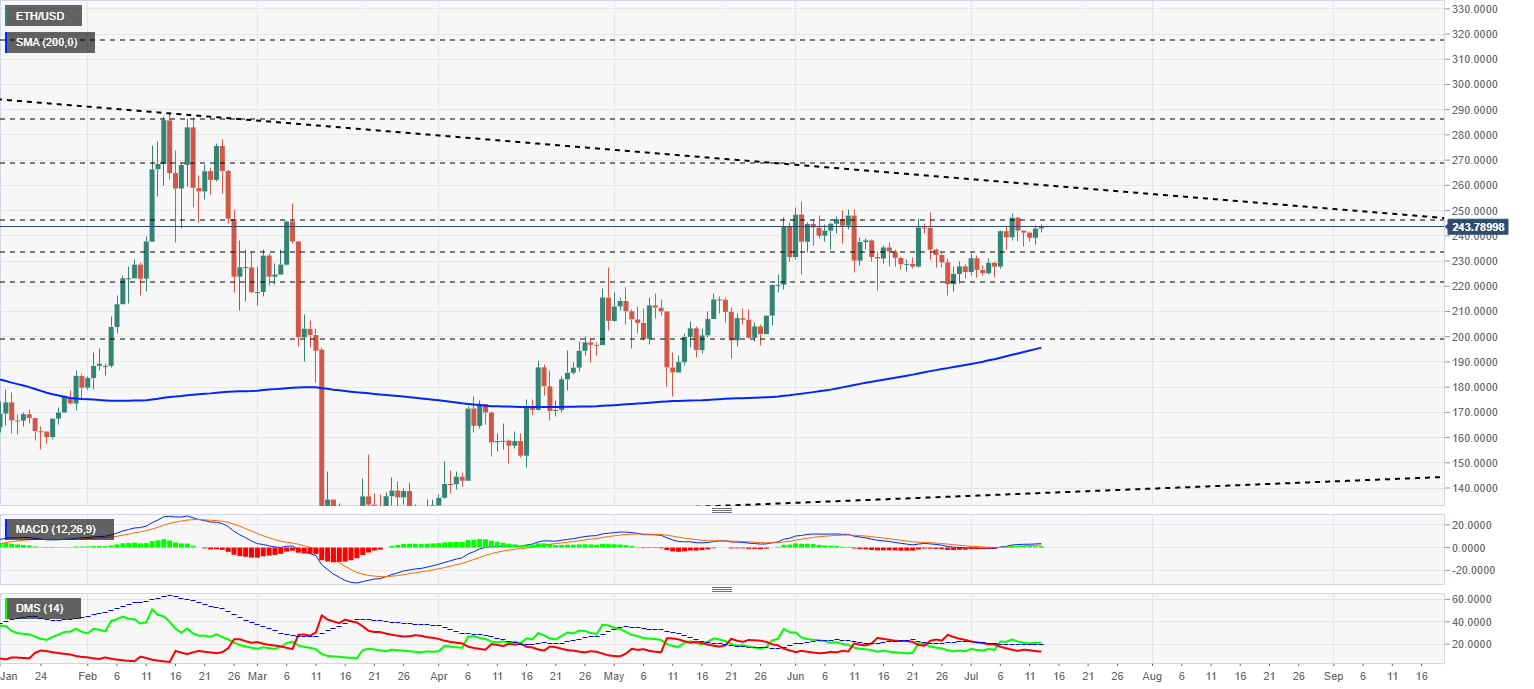
The MACD on the daily chart shows hardly any change in the slope of line spacing. The profile is conducive to medium-term bullish development.
The DMI on the daily chart shows the bulls supported by the ADX line. An upward bounce from this position would open a medium-term bullish scenario.
XRP/USD Daily Chart
The XRP/USD pair is currently trading at the price level of $0.201, a critical level because it has hardly any haven below it, but with the 200-day simple moving average just above it.
Above the current price, the first resistance level is at $0.202, then the second at $0.21 and the third one at $0.235.
Below the current price, the first support level is at $0.197, then the second at $0.185 and the third one at $0.163.
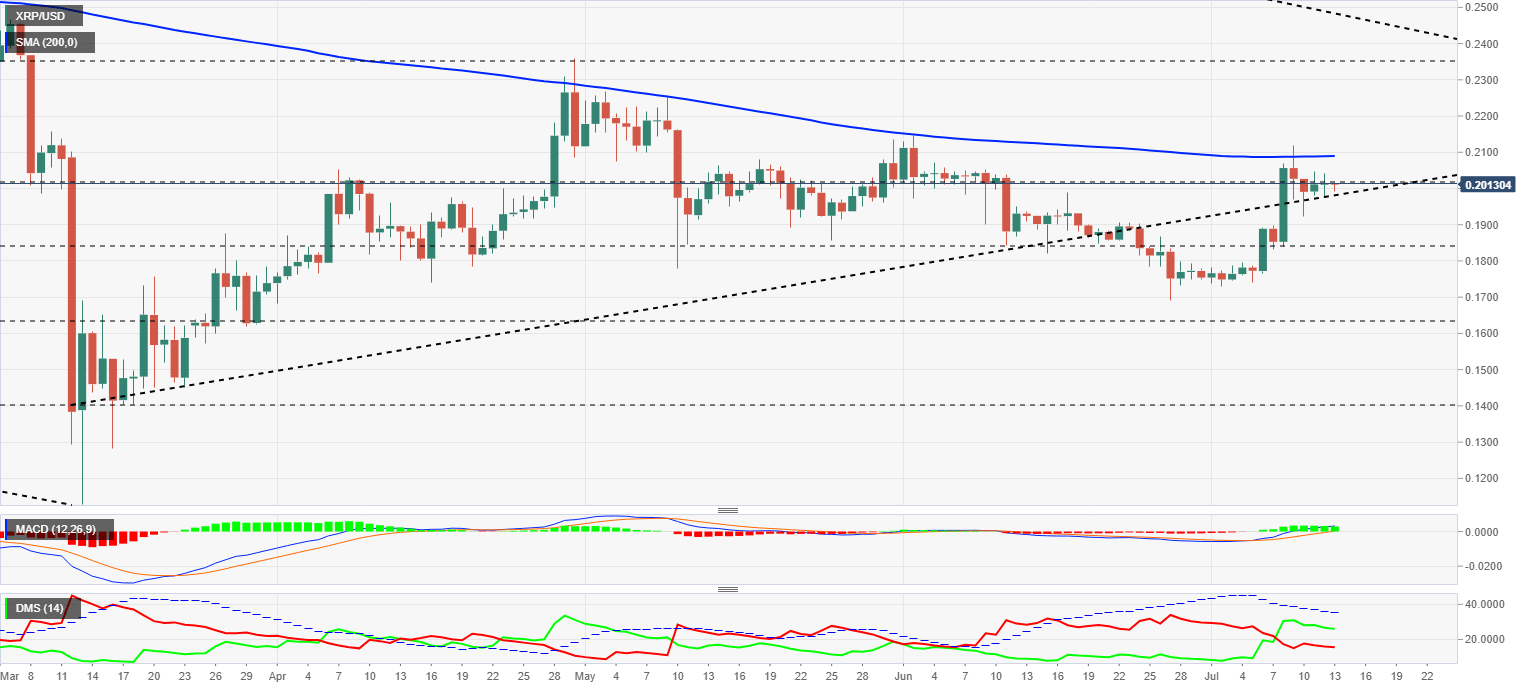
The MACD on the daily chart shows a flat profile but with significant line spacing. The MACD on the daily chart shows a flat profile but with a considerable line spacing. Last week's price increases are noticeable and provide volatility levels that neither Ethereum nor Bitcoin enjoys. The current profile promises significant moves in the short term but does not indicate the direction to take.
The DMI on the daily chart shows the bulls loosely controlling the XRP/USD pair. The bears don't seem to want to take control and continue to lose strength slightly but steadily.
Author

Tomas Salles
FXStreet
Tomàs Sallés was born in Barcelona in 1972, he is a certified technical analyst after having completing specialized courses in Spain and Switzerland. He expanded his technical training following the guidance of great experts on the financial markets.


