Top 3 Price Prediction Bitcoin, Ethereum, Ripple: Capital rushes into BTC as it breaks $50,000
- Bitcoin spike above $50,000 leads to another bullish impulse across the crypto market.
- Ethereum hunts for support above $1,800, as bulls keep the focus on $2,000.
- Ripple holds the 50 SMA support on the 4-hour chart, but action above $0.6 will validate the uptrend.

Bitcoin has broken above $50,000 for the first time in history. The pioneer cryptocurrency gained momentum after finding support at $49,000 early on Tuesday.
The leading smart-contract token has also shot above $1,800 and is securing the path to $2,000. Ripple continues to suffer under heightened overhead pressure, but a breakout is in the cards.
On the other hand, a handful of altcoins are recording double-digit gains like Polkadot (up 14%), Cosmos (up 30%), IOTA (up 14%) and Kusama (up 21%).
Bitcoin soars past the coveted $50,000
Bitcoin is holding at the ascending channel’s middle layer, as illustrated on the 4-hour chart. The break above $50,000 is likely to renew retail investor interest as they speculate on higher levels.
Note that the Relative Strength (RSI) is moving toward the overbought area. In other words, the uptrend could get more aggressive.
On the downside, support is expected at $49,000, but higher support will help sustain the uptrend, preferably above $50,000.
%20-%202021-02-16T154005.416-637490773030797140.png)
BTC/USD 4-hour chart
It is worth keeping in mind that Bitcoin will resume the downtrend if it closes the day below $49,000. The channel’s middle boundary is also a massive buyer congestion zone, which, if lost, may see BTC break down to $46,000.
Ethereum gains ground above $1,800
After suffering rejection at $1,838, price action extended below $1,800. Support at the 4-hour 50 SMA was instrumental in the ongoing recovery. The pioneer smart-contract token is exchanging hands at $1,805 at the time of writing. Note that closing the above $1,800 will add credence to the bullish picture.
The RSI is almost breaking above the bearish divergence, bringing to light a potential massive bullish impulse. This pattern is printed when the RSI forms a series of lower highs while the asset hits higher lows. It is characterized by a decrease in volume and often leads to a correction.
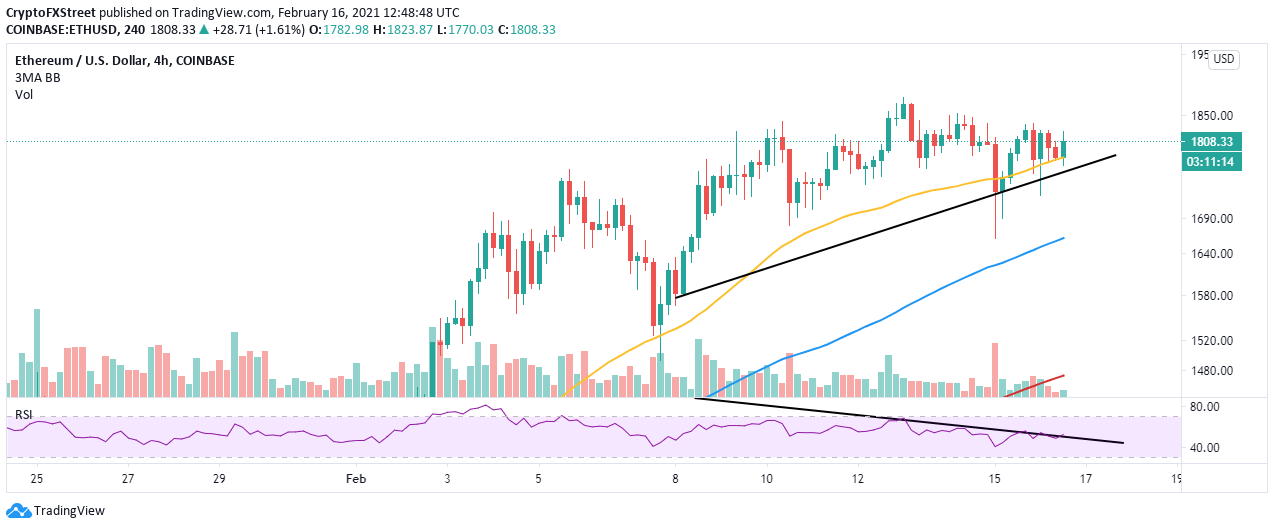
ETH/USD 4-hour Chart
Consequently, the Parabolic SAR points have also turned bearish, suggesting that bears are currently in control. On the downside, Ethereum expects to find support at the 100 SMA, presently holding the ground at $1,660.
Ripple defends crucial support ahead of breakout
Ripple has held firmly to the support provided by the 4-hour 50 SMA. This has ensured that losses under $0.5 are avoided, thus changing the narrative to bullish. Breaking above $0.6 is among the bulls’ top priorities because it will get the cross-border token out of the woods, but first, the immediate hurdle at $0.57 must come down.
The RSI on the 4-hour chart will validate the uptrend if it closes the day above the midline because investors will be encouraged to increase their positions amid signals of a bullish impulse.
%20(96)-637490773182845416.png)
XRP/USD 4-hour chart
A bearish picture will take precedence if XRP breaks below the 50 SMA. Selling orders will soar, especially with the uncertainty that hovers above this token due to the ongoing lawsuits in the United States. If support at $0.5 shatters, Ripple will dive towards $0.4. However, the 100 SMA will absorb the selling pressure, limiting the breakdown.
Author

John Isige
FXStreet
John Isige is a seasoned cryptocurrency journalist and markets analyst committed to delivering high-quality, actionable insights tailored to traders, investors, and crypto enthusiasts. He enjoys deep dives into emerging Web3 tren



