Top 3 Price Prediction Bitcoin, Ethereum, Ripple: BTC remains strong while altcoins falter
- Bitcoin price can advance at least 8% due to the fair value gap present up to $56,361.
- Ethereum price slows down as it approaches a critical resistance level at $4,071.
- Ripple price to face a confluence of resistance at $1.70 or before it.

Bitcoin price has been on a tear with its recent ascent. However, the same cannot be said for Ethereum, Ripple or other altcoins that are showing signs of a sell-off.
Bitcoin price shows strength
Bitcoin price recently pierced the $50,000 barrier in hopes of pushing higher. The fair value gap (FVG) formed during the May 12 crash suggests that BTC should have a resistance-free path up to $56,361, roughly an 8% ascent.
However, this optimistic scenario depends solely on buyers’ ability to keep BTC above the $51,483 level, which is the lower limit of the FVG. If BTC sticks to its boundaries, investors can expect a run-up to $56,361 and, if the bullish momentum persists, the bellwether crypto could take a jab at the $60,000 psychological level.
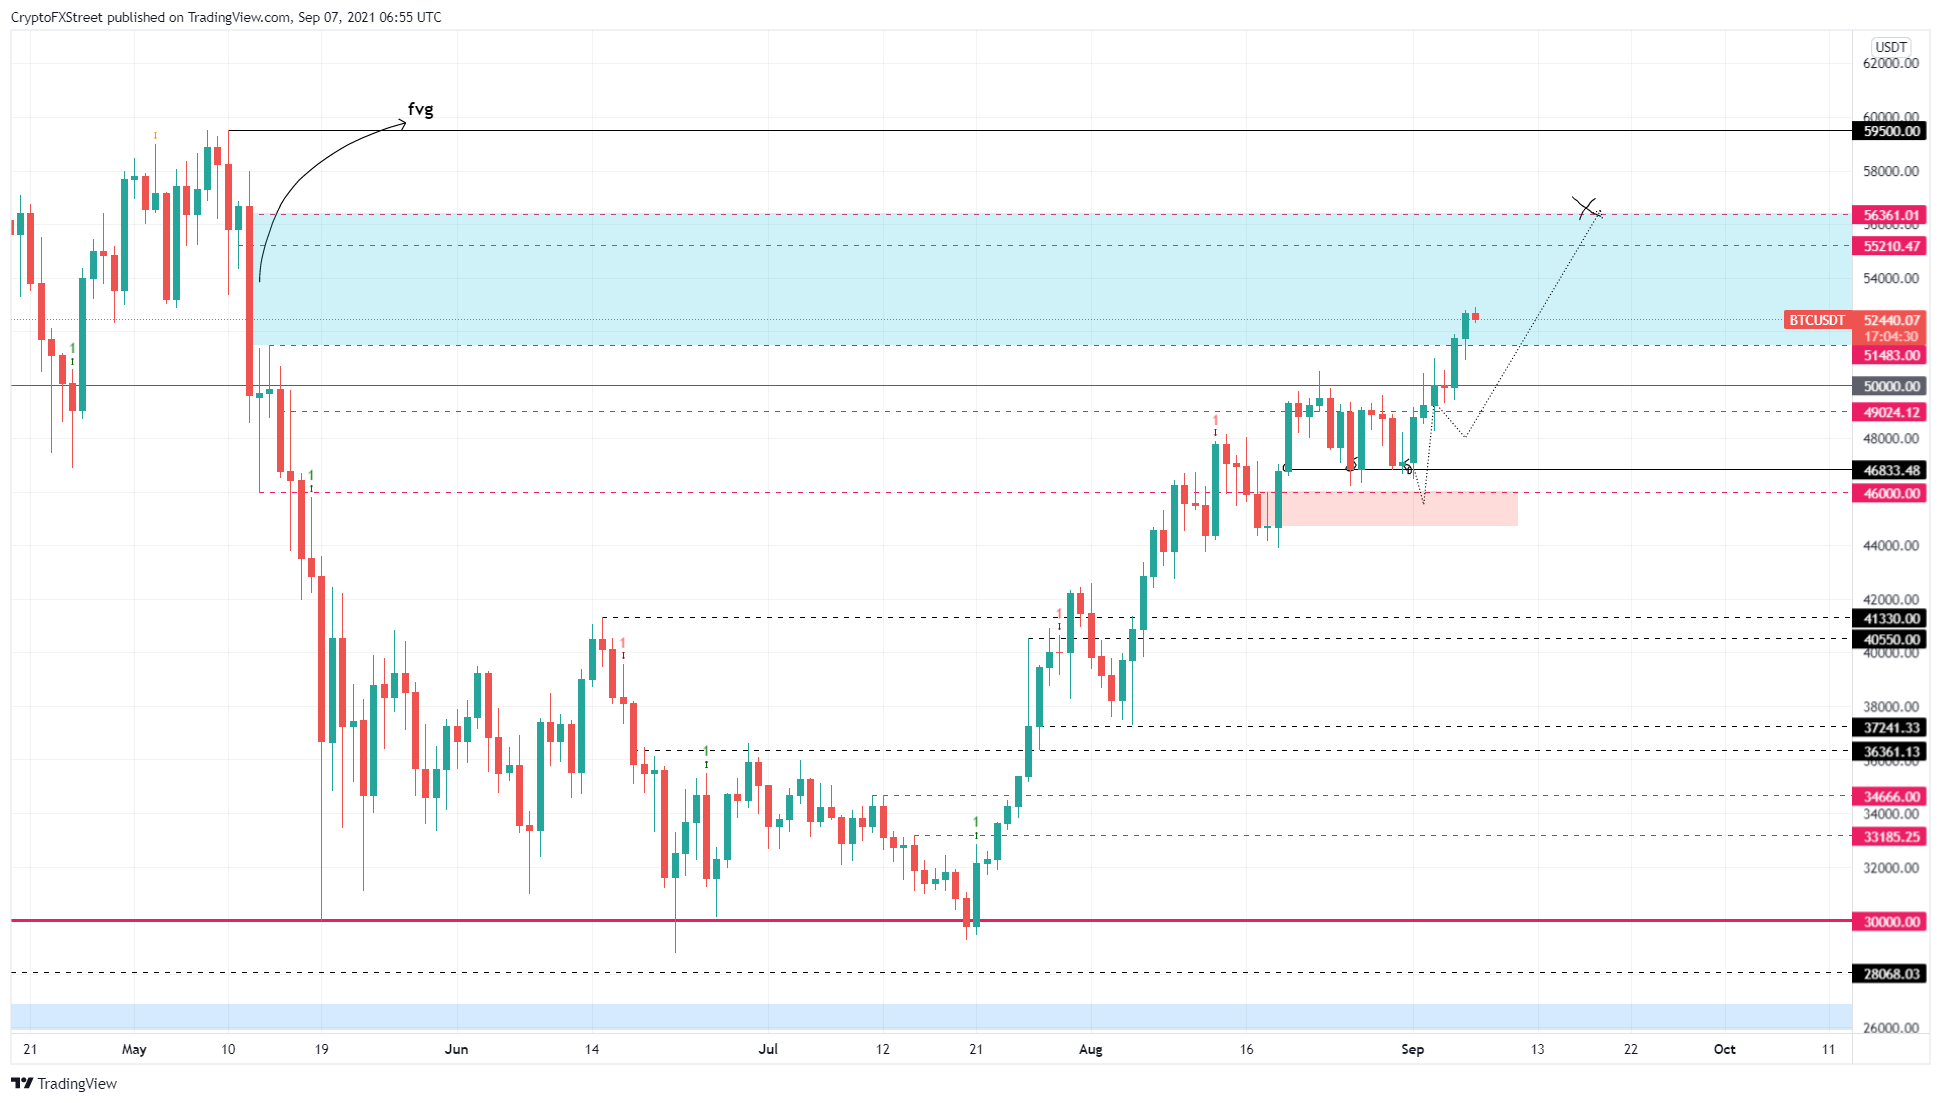
BTC/USDT 1-day chart
However, if BTC breaks below the FVG’s lower limit at $51,483, it will indicate that there is a weakness among buyers. Such a development will lead to further downswings. A breach of the $50,000 psychological level will invalidate the bullish thesis.
This breakdown could trigger Bitcoin price to a consolidative phase or a move lower.
Ethereum price looks toppy
Ethereum price entered the FVG on September 1 as it rallied roughly 11%. However, this ascent fell short mid-way, leading to consolidation. However, considering the highly cautious nature of Bitcoin price action, things could go south quickly for ETH if BTC crashes.
Therefore, investors should expect a minor crash to $3,524 and, in a bearish case, a 13% descent to the $3,345 support level.
However, any dips in ETH price below $3,345 are expected to be brief due to the massive consolidation between August 8 and August 30.
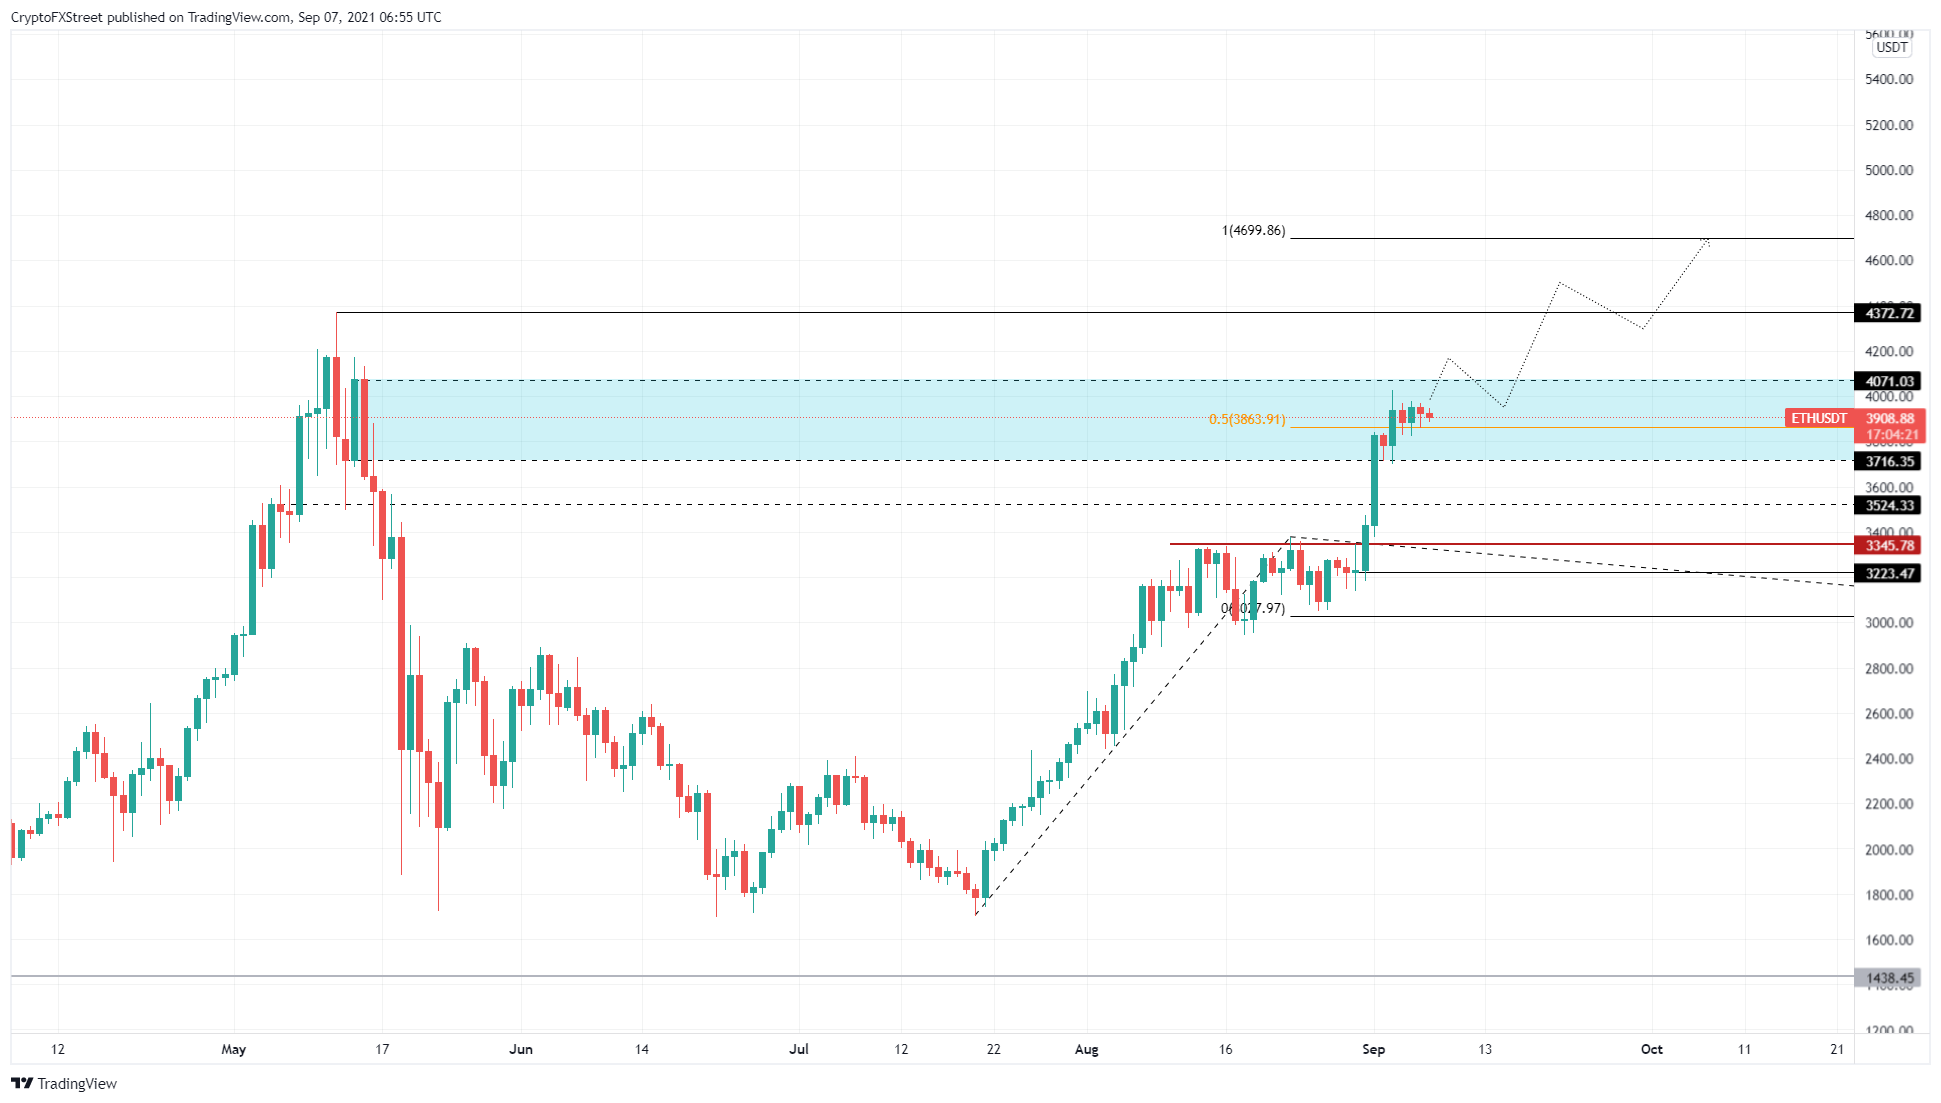
ETH/USDT 1-day chart
On the other hand, if ETH shows strength and breaches through the upper limit of the FVG at $4,071, it will indicate the resurgence of buyers. Such a move will invalidate the bearish thesis and open the path for a retest of $4,372.
Ripple price approaches confluence of resistance
Ripple price surged roughly 30% between August 31 and September 6 as it pierced the FVG formed on May 19. This ascent indicated strength, but the current state of the market suggests that the trend could reverse, putting XRP price in a tough spot.
On an optimistic note, if the remittance token continues in its direction, investors can expect an 18% upswing until it tags the $1.60 barrier, which is the upper limit of the FVG. Although a move higher is possible, it is unlikely considering the parallel channel’s middle line is acting as a resistance, coinciding with $1.60.
In a bullish case, XRP price might overcome this confluence and tag $1.70.
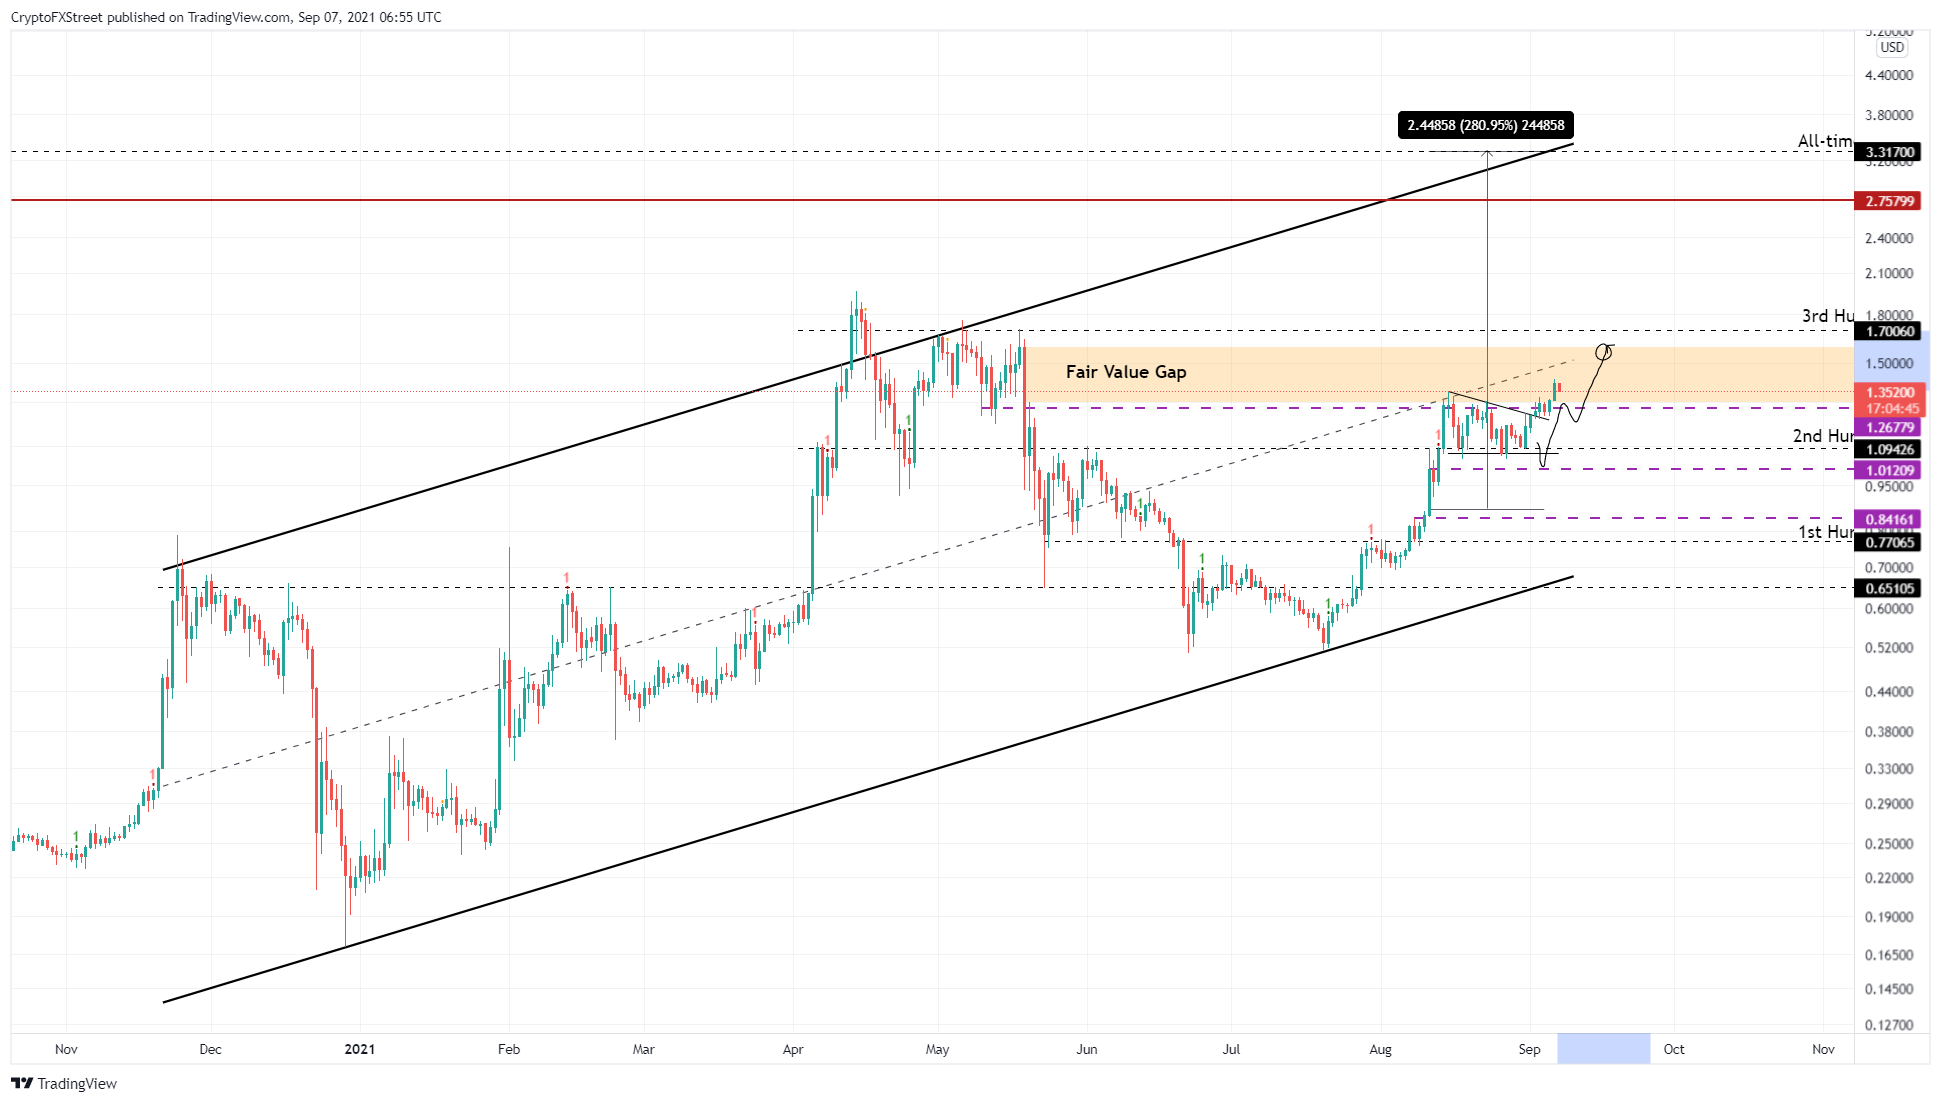
XRP/USDT 1-day chart
If BTC price shows weakness, XRP price could reflect it and continue to head lower. If the correction produces a decisive close below $1.27, it will indicate that many investors are booking profits.
However, a breakdown of the $1.09 support level will invalidate the bullish thesis and could drag XRP price down to $1.01 or $0.84.
Author

Akash Girimath
FXStreet
Akash Girimath is a Mechanical Engineer interested in the chaos of the financial markets. Trying to make sense of this convoluted yet fascinating space, he switched his engineering job to become a crypto reporter and analyst.



