Top 3 Price Prediction Bitcoin, Ethereum, Ripple: BTC, ETH, XRP gain as MicroStrategy buys $10.7 million BTC
- Bitcoin hovers close to $84,000 and observes a 1% gain on Monday.
- Ethereum and XRP are also in the green as Ether eyes a comeback to $2,000.
- MicroStrategy acquires 130 Bitcoins at an average price of $82,981, but Peter Schiff warns the firm could go bankrupt.

Bitcoin (BTC) daily price chart shows signs of recovery in the largest cryptocurrency. Strategy, one of the largest corporate holders of Bitcoin, acquired another 130 BTC last week, according to an announcement on Monday.
Ethereum (ETH) gained 1.54%, and XRP added 2.40% to its value today.
Bitcoin ready to cover lost ground, eyes return above $90,000
Bitcoin trades at $83,000 at the time of writing. Technical indicators on the BTC/USDT daily price chart support a thesis of gains in the largest cryptocurrency.
The Relative Strength Index (RSI) reads 42 and is sloping upward. The Moving Average Convergence Divergence (MACD) indicator flashes green histogram bars above the neutral line. The Bitcoin price trend has an underlying positive momentum on the daily timeframe.
The two key momentum indicators support Bitcoin’s gains, and a return to resistance at the $90,000 level is likely.
BTC price is currently 8.35% away from the $90,000 resistance. The $90,000 level is key to Bitcoin price since the token has been hovering under this level since March 7, as observed in the BTC/USDT chart below:

BTC/USDT daily price chart
Ethereum could test psychologically important $2,000 level
Ethereum trades at $1,902 at the time of writing. The largest altcoin in the crypto market looks prepared to test the psychologically important $2,000 level and attempt to close above the resistance.
The $2,000 level holds significance as it remained as key support for Ethereum for over a year, as observed on the ETH/USDT daily price chart.
A 5% rally from the current price could push Ether to $2,000. A successful daily candlestick close above the $2,000 mark could push the altcoin toward resistance at the lower boundary of the Fair Value Gap (FVG) at $2,533.
The rally to $2,533 would mark an over 30% gain from the current ETH price.
Two key momentum indicators, the RSI and MACD, support Ether’s recent gains. The RSI is sloping upward and reads 34, while the MACD shows an underlying positive momentum in Ethereum price trend.
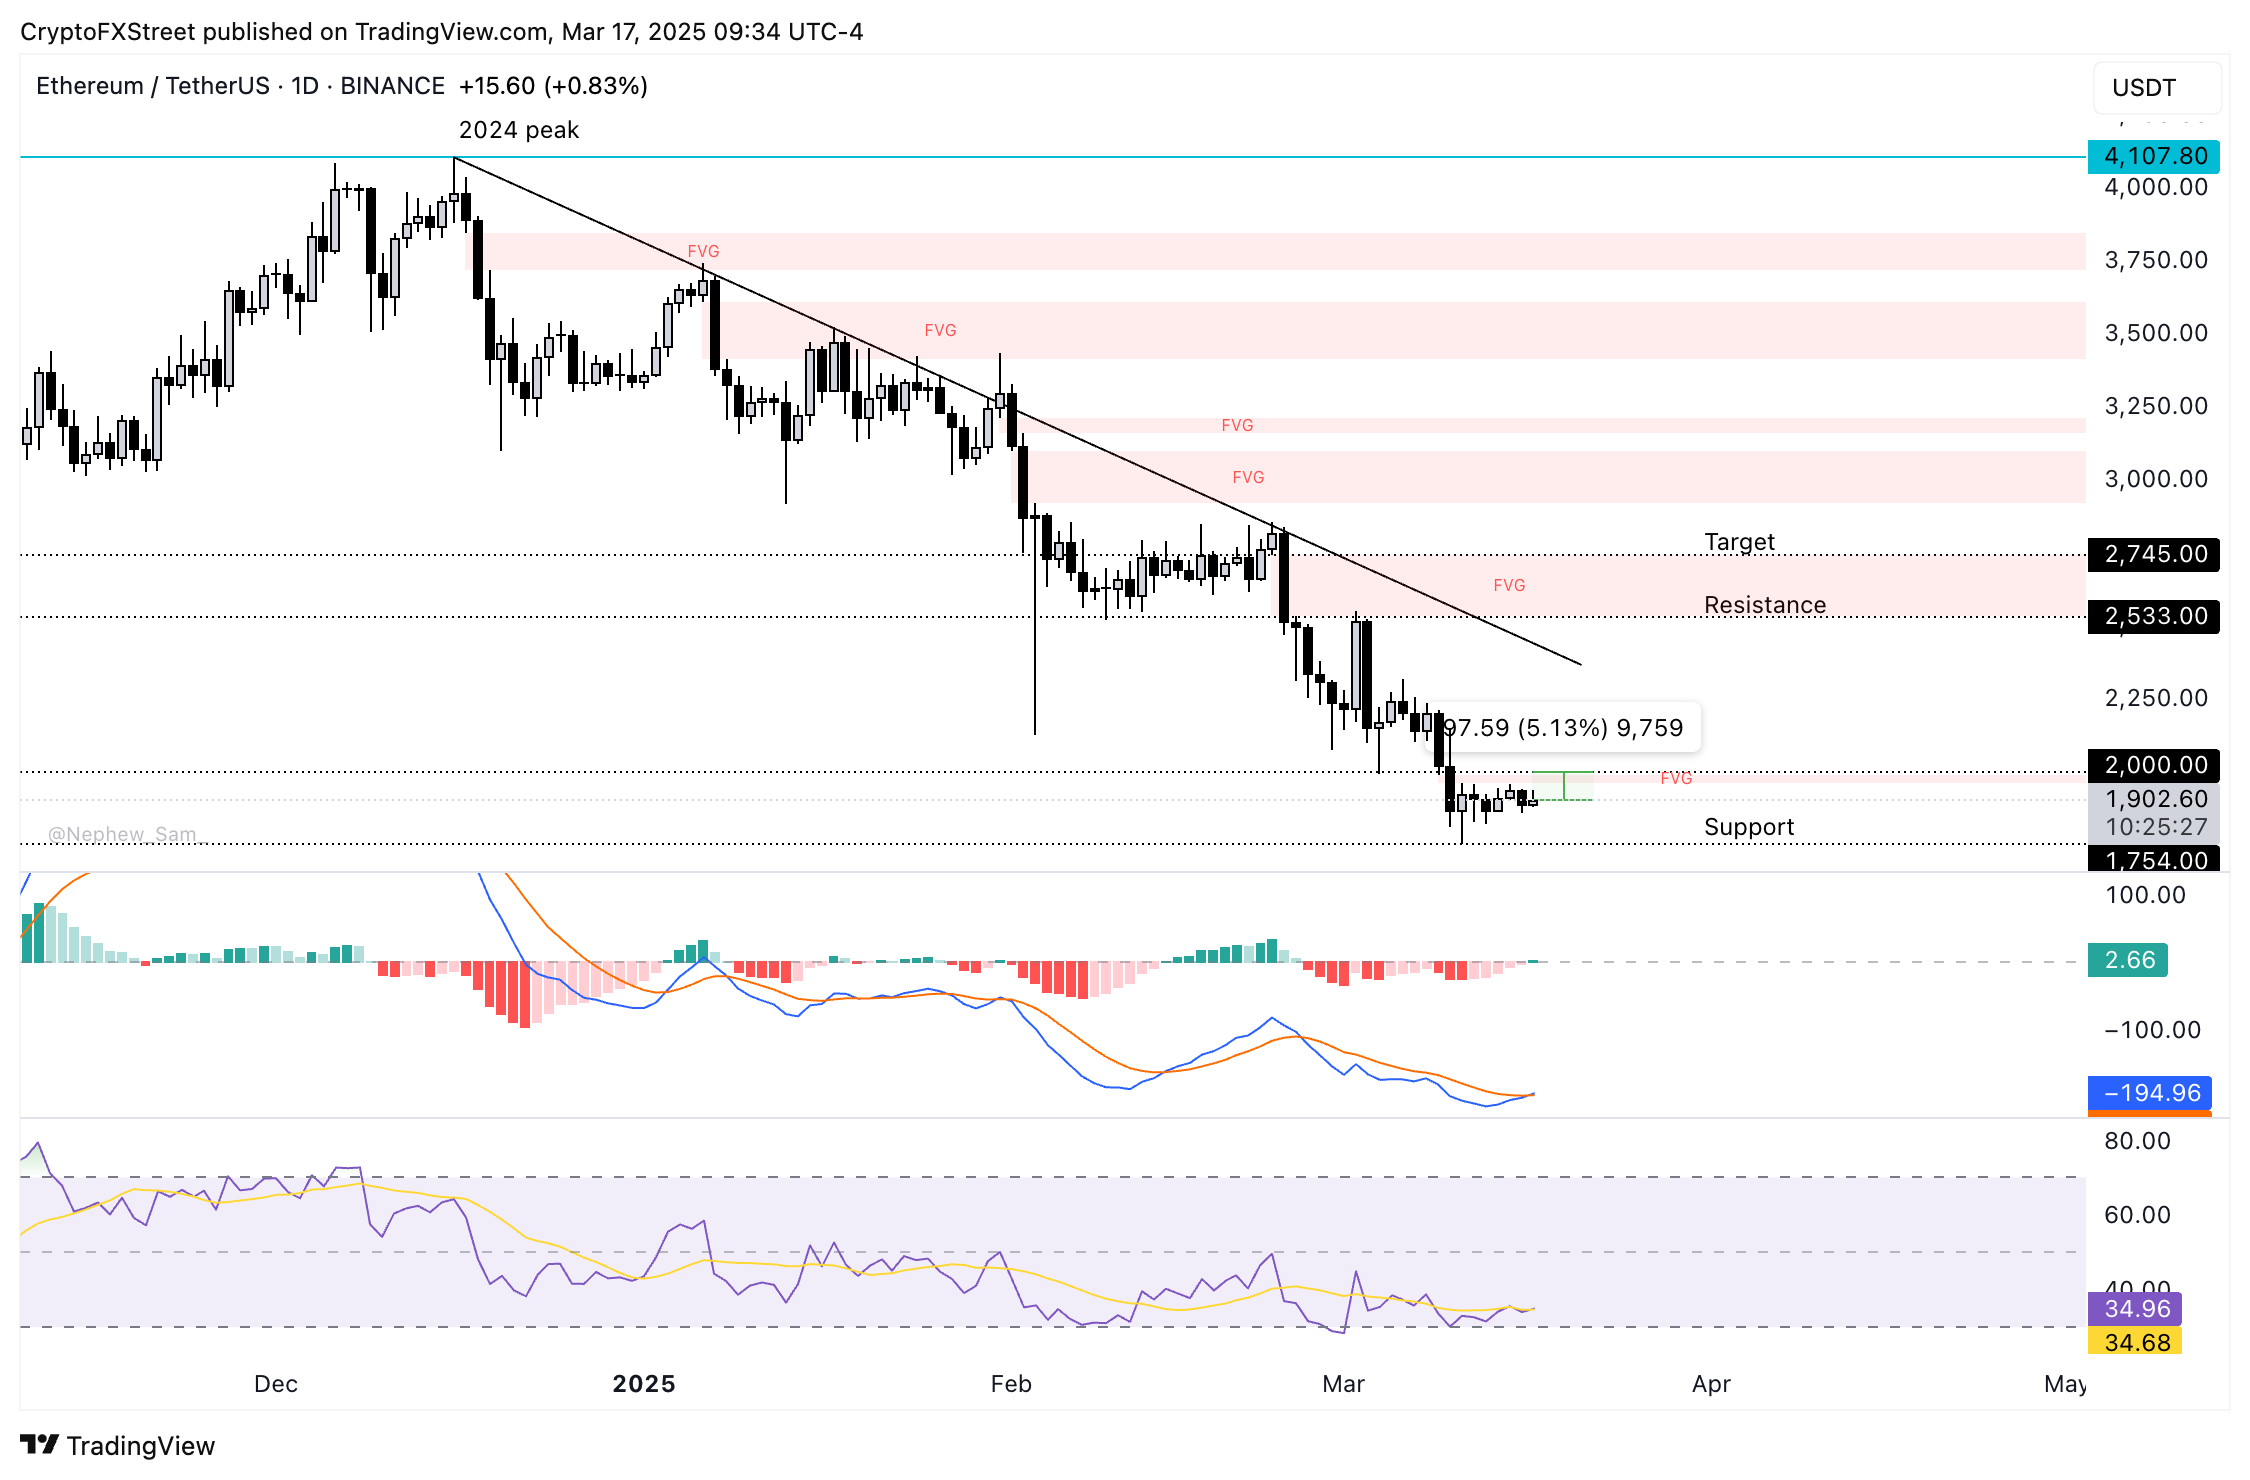
ETH/USDT daily price chart
A failure to test the $2,000 level could imply weakness in Ether’s price trend and the nearly 16-month low at $1,754 could come into play as support.
XRP could rally 10%, shows signs of recovery
XRP trades at $2.3386 at the time of writing on Monday. The altcoin gained nearly 2% on the day, and the momentum indicators on the daily price chart support gains in XRP.
The 50% Fibonacci retracement of XRP’s decline from the peak of $3.40 to the February low of $1.7711 — at $2.5856 — is a key resistance for the altcoin. A rally to this level could mark 10% gains in XRP.
The RSI reads 48 and is sloping upward, while the MACD flashes green histogram bars above the neutral line.
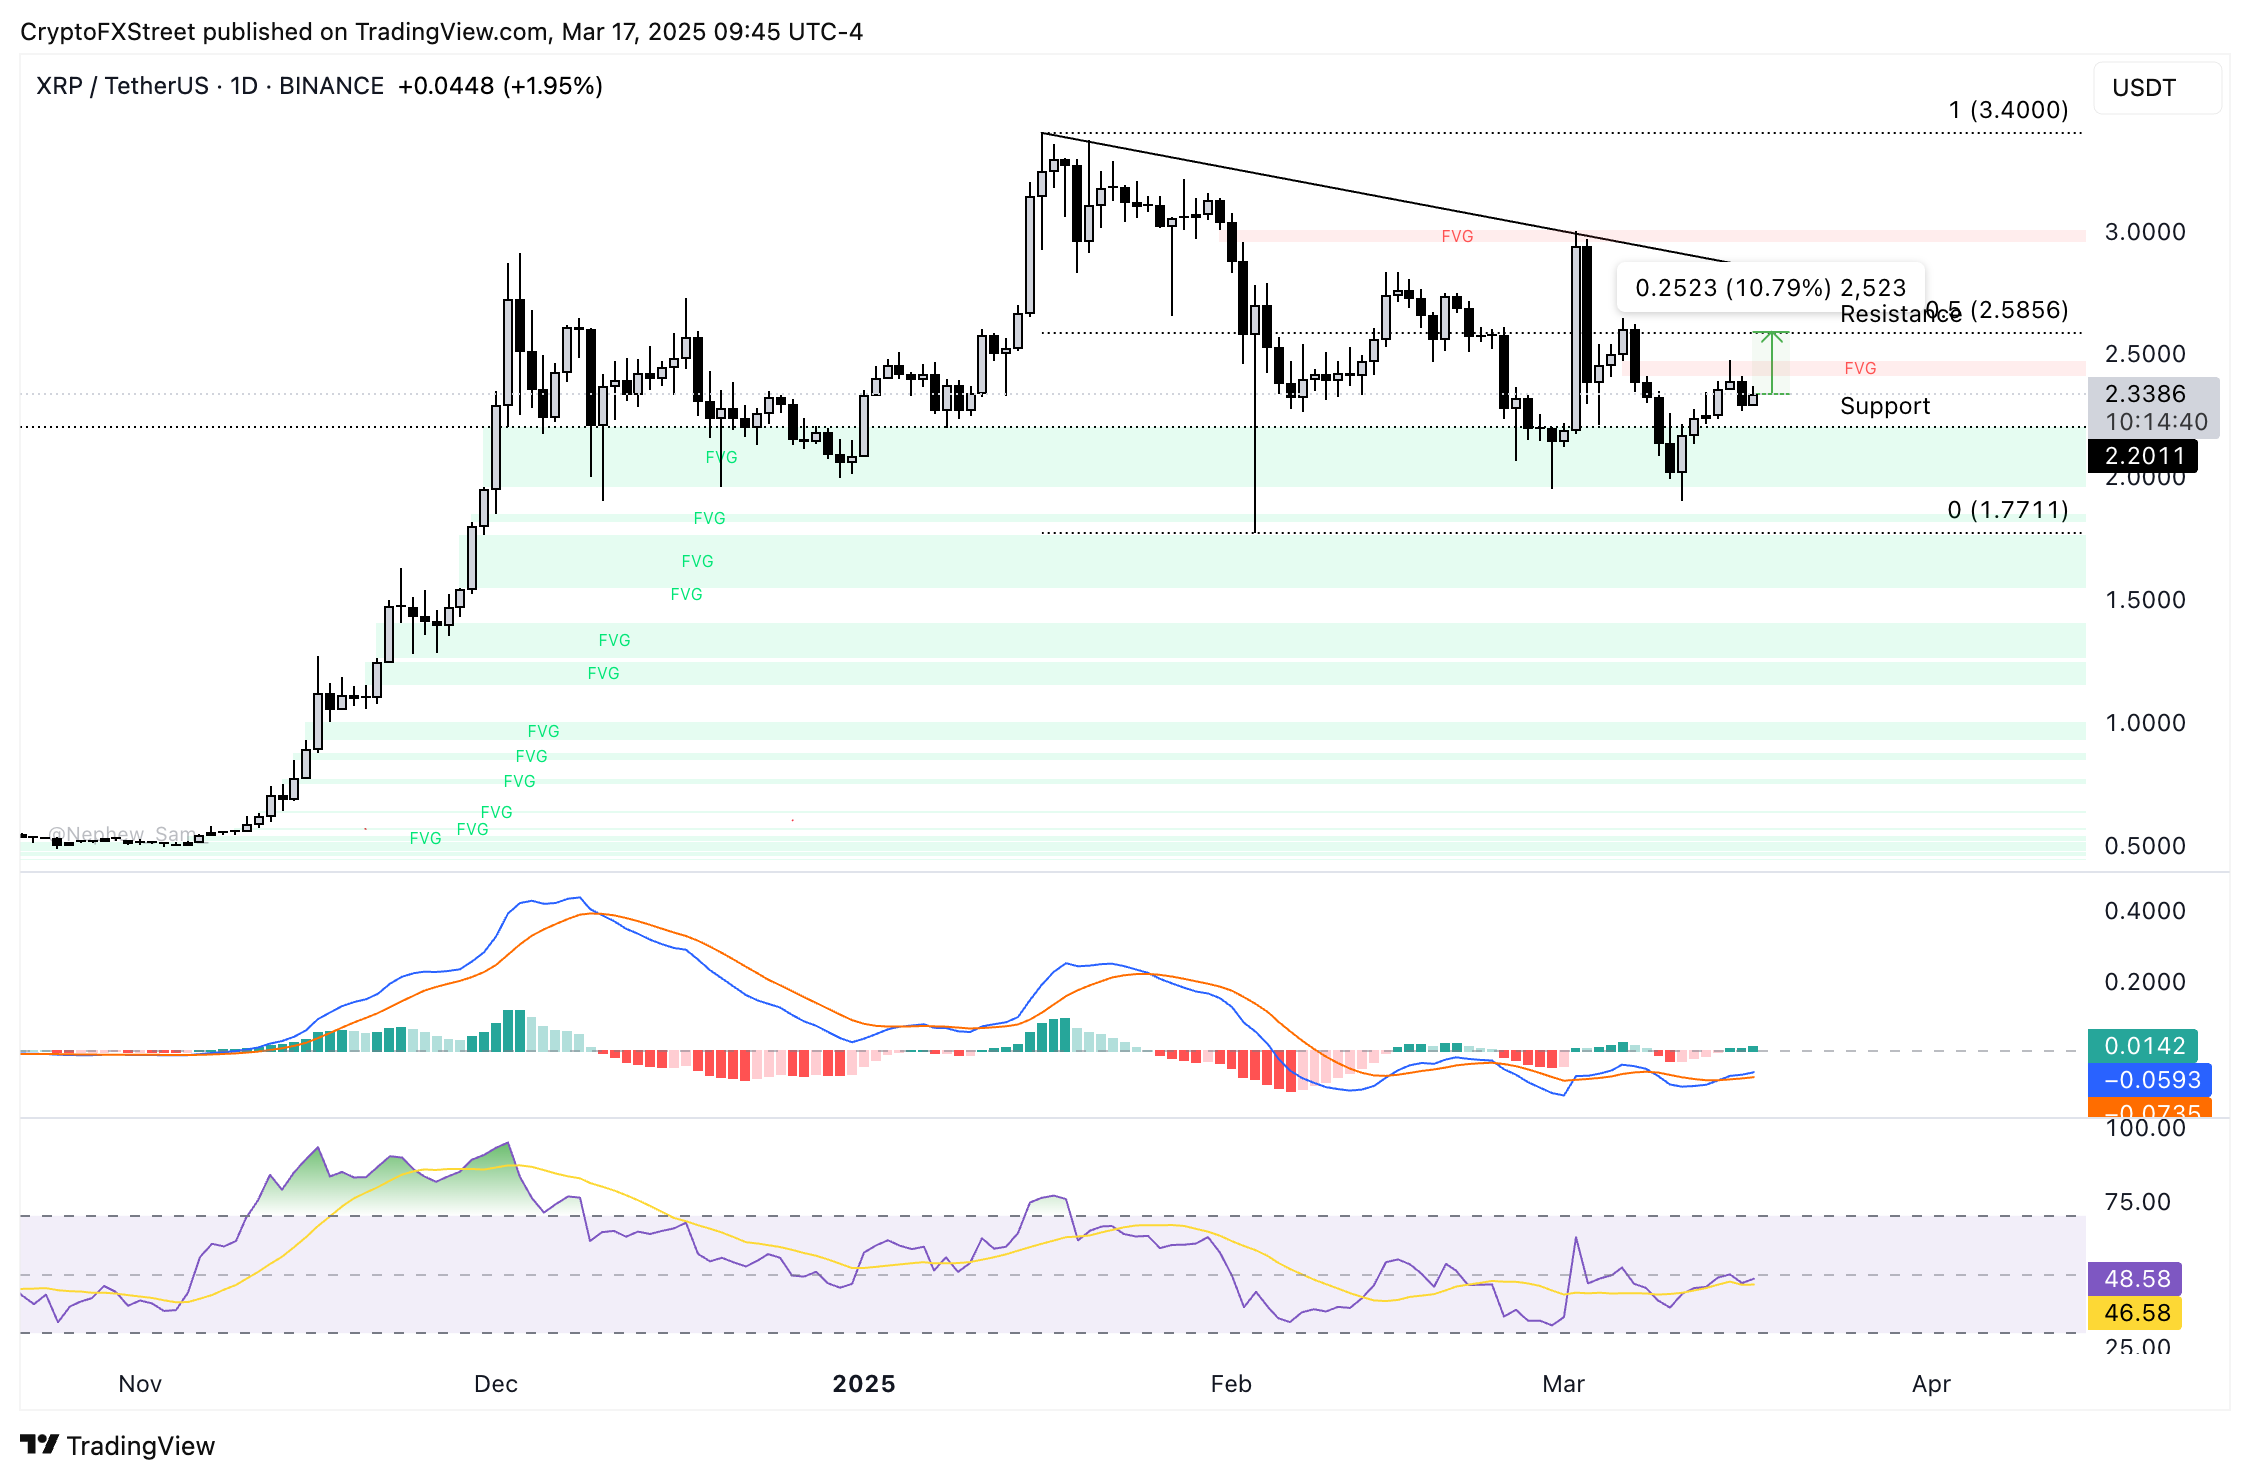
XRP/USDT daily price chart
In the event of a flash crash in Bitcoin, altcoins like XRP and Ether could face a correction. XRP could find support at the multi-month low of $1.7711 if there is a serious decline in the altcoin’s price.
Expert commentary on where Bitcoin and Ethereum are headed
Ryan Lee, Chief Analyst at Bitget Research, told FXStreet that the recent Bitcoin pullback put the spotlight on the $82,000 and $85,000 support levels.
Lee said, “It’s a classic post-rally consolidation phase that is healthy but also a test of whether Bitcoin’s recent momentum has real staying power. Institutional buying and the buzz around a potential US Strategic Bitcoin Reserve continue to prop up sentiment, but with resistance looming near $85,000–$90,000, a breakout won’t come easy.
Let’s not forget the macro wildcard: any unexpected FOMC moves could throw a wrench into the market. If sentiment turns bearish, we could see Bitcoin dip toward $75,000–$80,000, though a bullish macro backdrop could send it climbing back to $90,000.”
Observing that Ethereum and Bitcoin are tightly correlated and the altcoin tends to respond to shifts in the BTC price trend, Lee told FXStreet:
“The ETH/BTC ratio’s weakness suggests Ethereum is struggling to find independent strength, even with promising developments on the horizon. The Pectra upgrade and ongoing Layer 2 expansion give it a bullish long-term case, but in the short term, those fundamentals might not be enough to break resistance at $2,300–$2,500 without Bitcoin leading the charge. If market sentiment sours, ETH could slip to $1,800, but Ethereum could push toward the top of its range if BTC stages a recovery. Right now, it’s a waiting game—does Bitcoin hold the line, or does the market need a deeper reset before the next leg up?”
Author

Ekta Mourya
FXStreet
Ekta Mourya has extensive experience in fundamental and on-chain analysis, particularly focused on impact of macroeconomics and central bank policies on cryptocurrencies.


