Top 3 Price Prediction Bitcoin, Ethereum, Ripple: Bitcoin struggles around the $60,000 level
- Bitcoin price seems poised for a decline as it tests the crucial resistance level around $62,000.
- Ethereum price is at risk of a decline after encountering a significant resistance barrier around $2,843.
- Ripple price retests the daily level at $0.544; failure to maintain this support could result in a decline.

Bitcoin (BTC), Ethereum (ETH), and Ripple (XRP) each encountered resistance at key levels and declined on Sunday. Technical analysis and current market conditions suggest that these cryptocurrencies' overall downward trends are likely to continue in the coming days.
Bitcoin faces potential decline as it tests key $62,000 resistance level
Bitcoin's price was repeatedly tested and rejected by the 61.8% Fibonacci retracement level of $62,066 (drawn from the swing high of $70,079 on July 29 to Monday's low of $49,101). On Monday, it trades slightly lower by 0.3% at $58,564.
If the $62,066 level holds as resistance, aligning with the broken trendline and the 100-day Exponential Moving Average at approximately $63,021, selling pressure may rise.
Failure to surpass $62,066 could lead to a 19% drop, potentially revisiting the $49,917 daily support level.
The Relative Strength Index (RSI) indicator and Awesome Oscillator (AO) on the daily chart are trading below the neutral levels of 50 and zero. These momentum indicators strongly indicate bearish dominance.
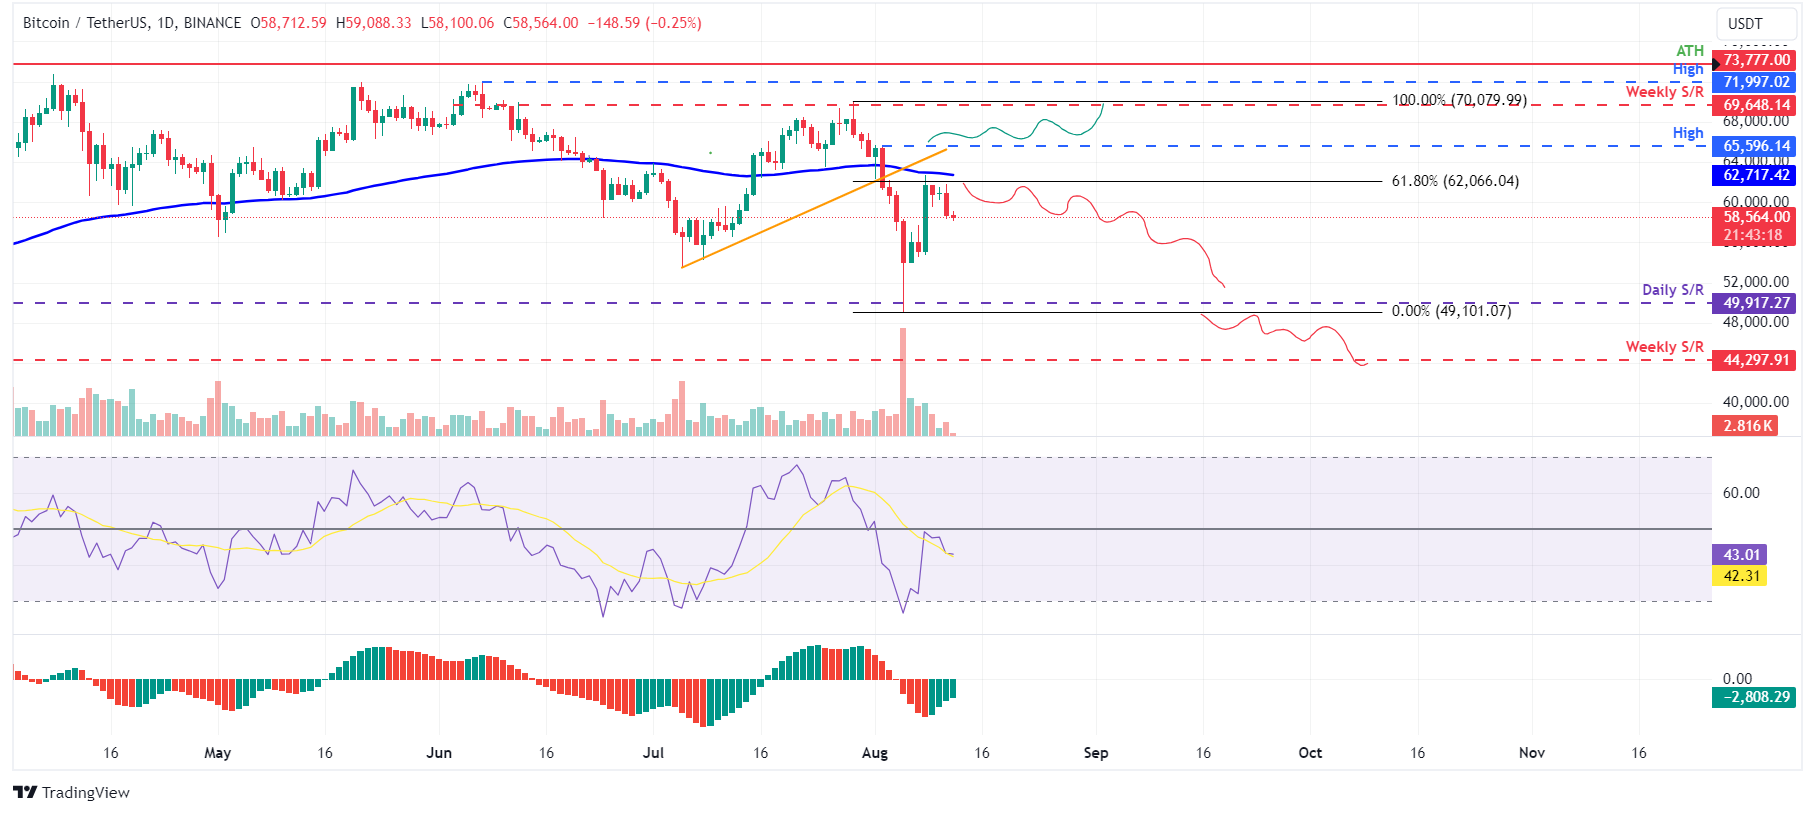
BTC/USDT daily chart
Conversely, if Bitcoin closes above the August 2 high of $65,596, it would establish a higher high on the daily chart, potentially driving a 6% increase in its price to challenge the weekly resistance at $69,648.
Ethereum price at risk of decline after facing key resistance barrier
Ethereum faces resistance around the 50% retracement level of $2,843, derived from the swing high of $3,562 on July 22 and the low of $2,124 on August 5. This level coincides closely with the daily resistance at $2,927. Following a bounce last week after finding support from the weekly support at $2,118 on August 5, Ethereum is currently trading slightly lower at $2,537, down 0.7% as of Monday.
If Ethereum price fails to surpass the $2,843 level, it could drop 25% to test its weekly support at $2,118.
This bearish thesis is supported by the daily RSI and AO, which have fallen below their neutral thresholds of 50 and zero, respectively, signaling a bearish dominance.
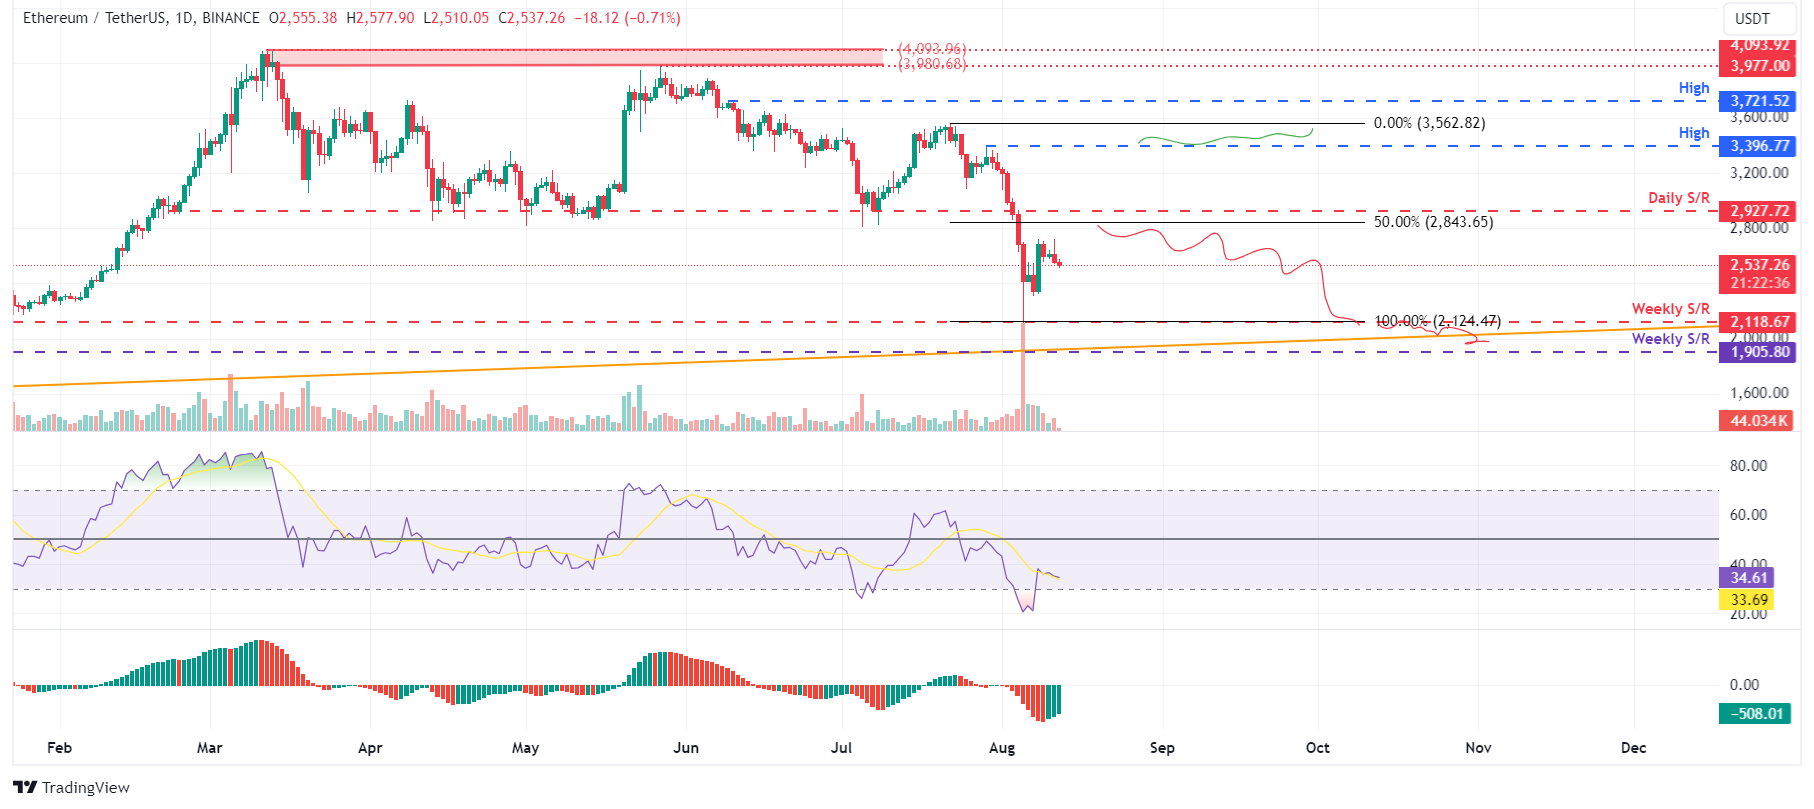
ETH/USDT daily chart
Conversely, if Ethereum's price closes above the July 29 high of $3,396, it will establish a higher high on the daily chart, potentially driving a 5% increase to revisit the July 22 high of $3,562.
Ripple price could fall deeper if a break below key daily support occurs
Ripple's price faced rejection at the daily resistance level of $0.643 on August 8, resulting in a 10.35% decline over the next three days. As of Monday, it has found support around $0.544 and is trading slightly higher by 1.45% at $0.560.
If XRP breaks below the $0.544 daily level, it could continue to decline 10% to retest the low of August 7 at $0.492.
The daily chart RSI has slipped below its neutral level of 50, and AO is on its way to doing the same. If both momentum indicators fall below their neutral levels, it will reinforce the bearish trend.
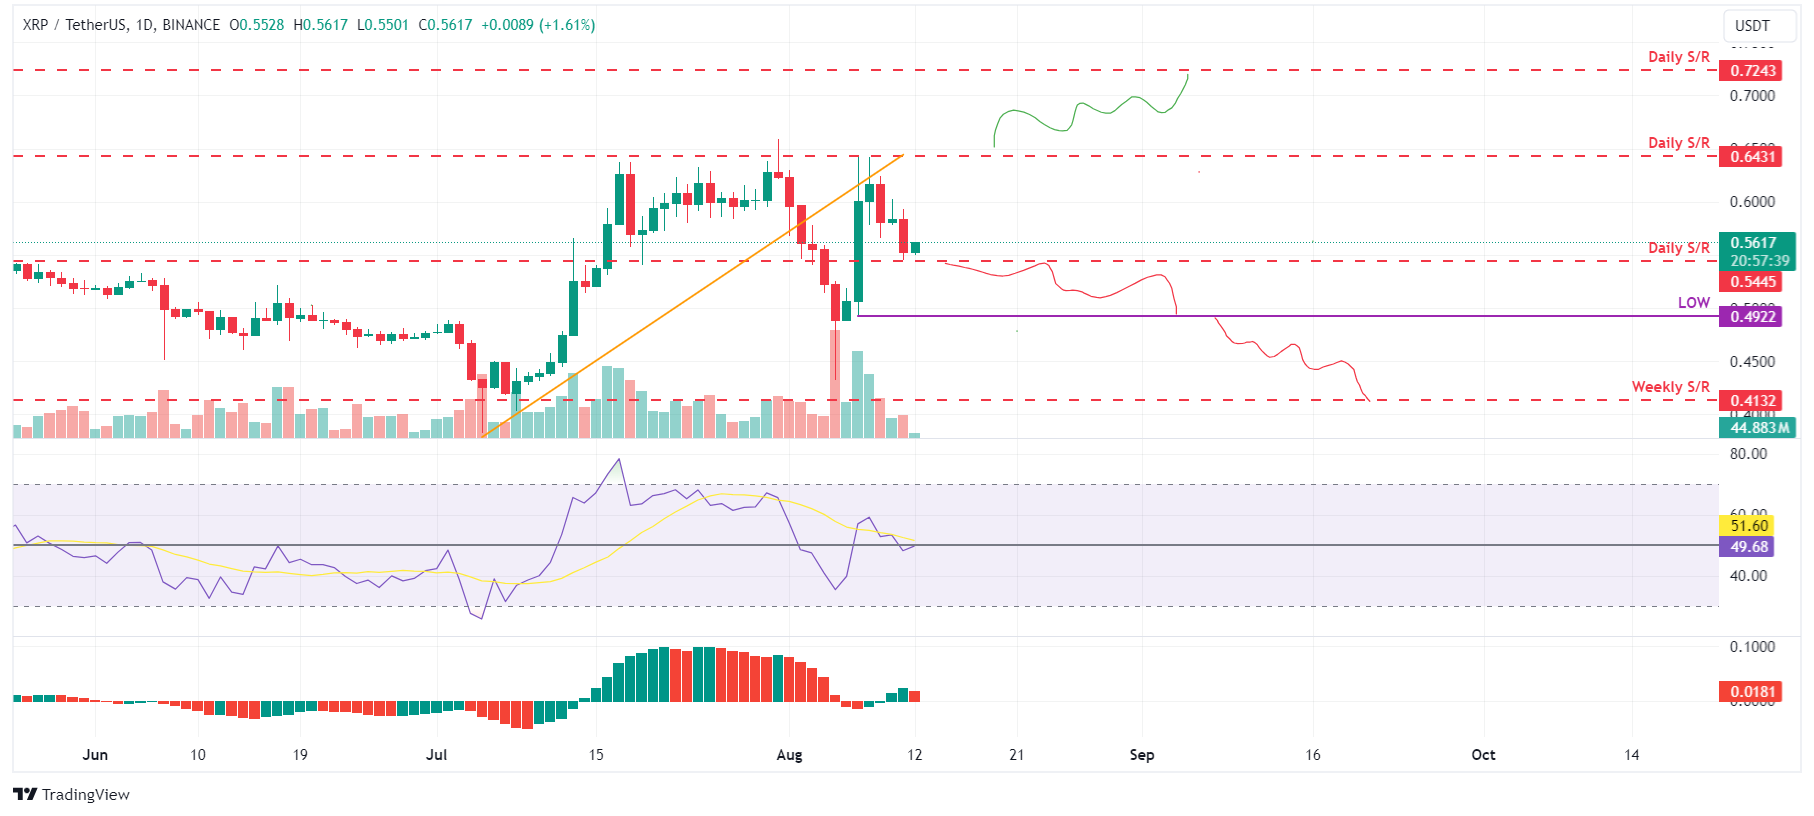
XRP/USDT daily chart
Conversely, if Ripple's price closes above the $0.643 daily resistance level, it would change the market structure by forming a higher high on the daily chart, potentially driving a 12% increase toward the next daily resistance level at $0.724.
Author

Manish Chhetri
FXStreet
Manish Chhetri is a crypto specialist with over four years of experience in the cryptocurrency industry.


