Crypto Today: Bitcoin, Ethereum, XRP tumble as retail dumps, risk-off mood prevails
- Bitcoin holds above $70,000 after testing $69,922 intraday low amid a retail investor exodus.
- Ethereum is largely in bearish hands despite support at $2,000 staying intact.
- XRP accelerates its decline, plunging below $1.40 as futures Open Interest fades while ETFs see mild inflows.

Bitcoin (BTC) is trading under pressure at the time of writing on Thursday, holding above $70,000 after hitting an intraday low of 69,922. The decline reflects weakening demand from both institutional and retail investors.
Altcoins across the board, including Ethereum (ETH) and Ripple (XRP), are also edging lower, with ETH testing key support level while XRP plunges below $1.40. The retail investor flight has left prices vulnerable amid persistent risk-off sentiment.
Retail sells Bitcoin, Ethereum and XRP as Open Interest shrinks
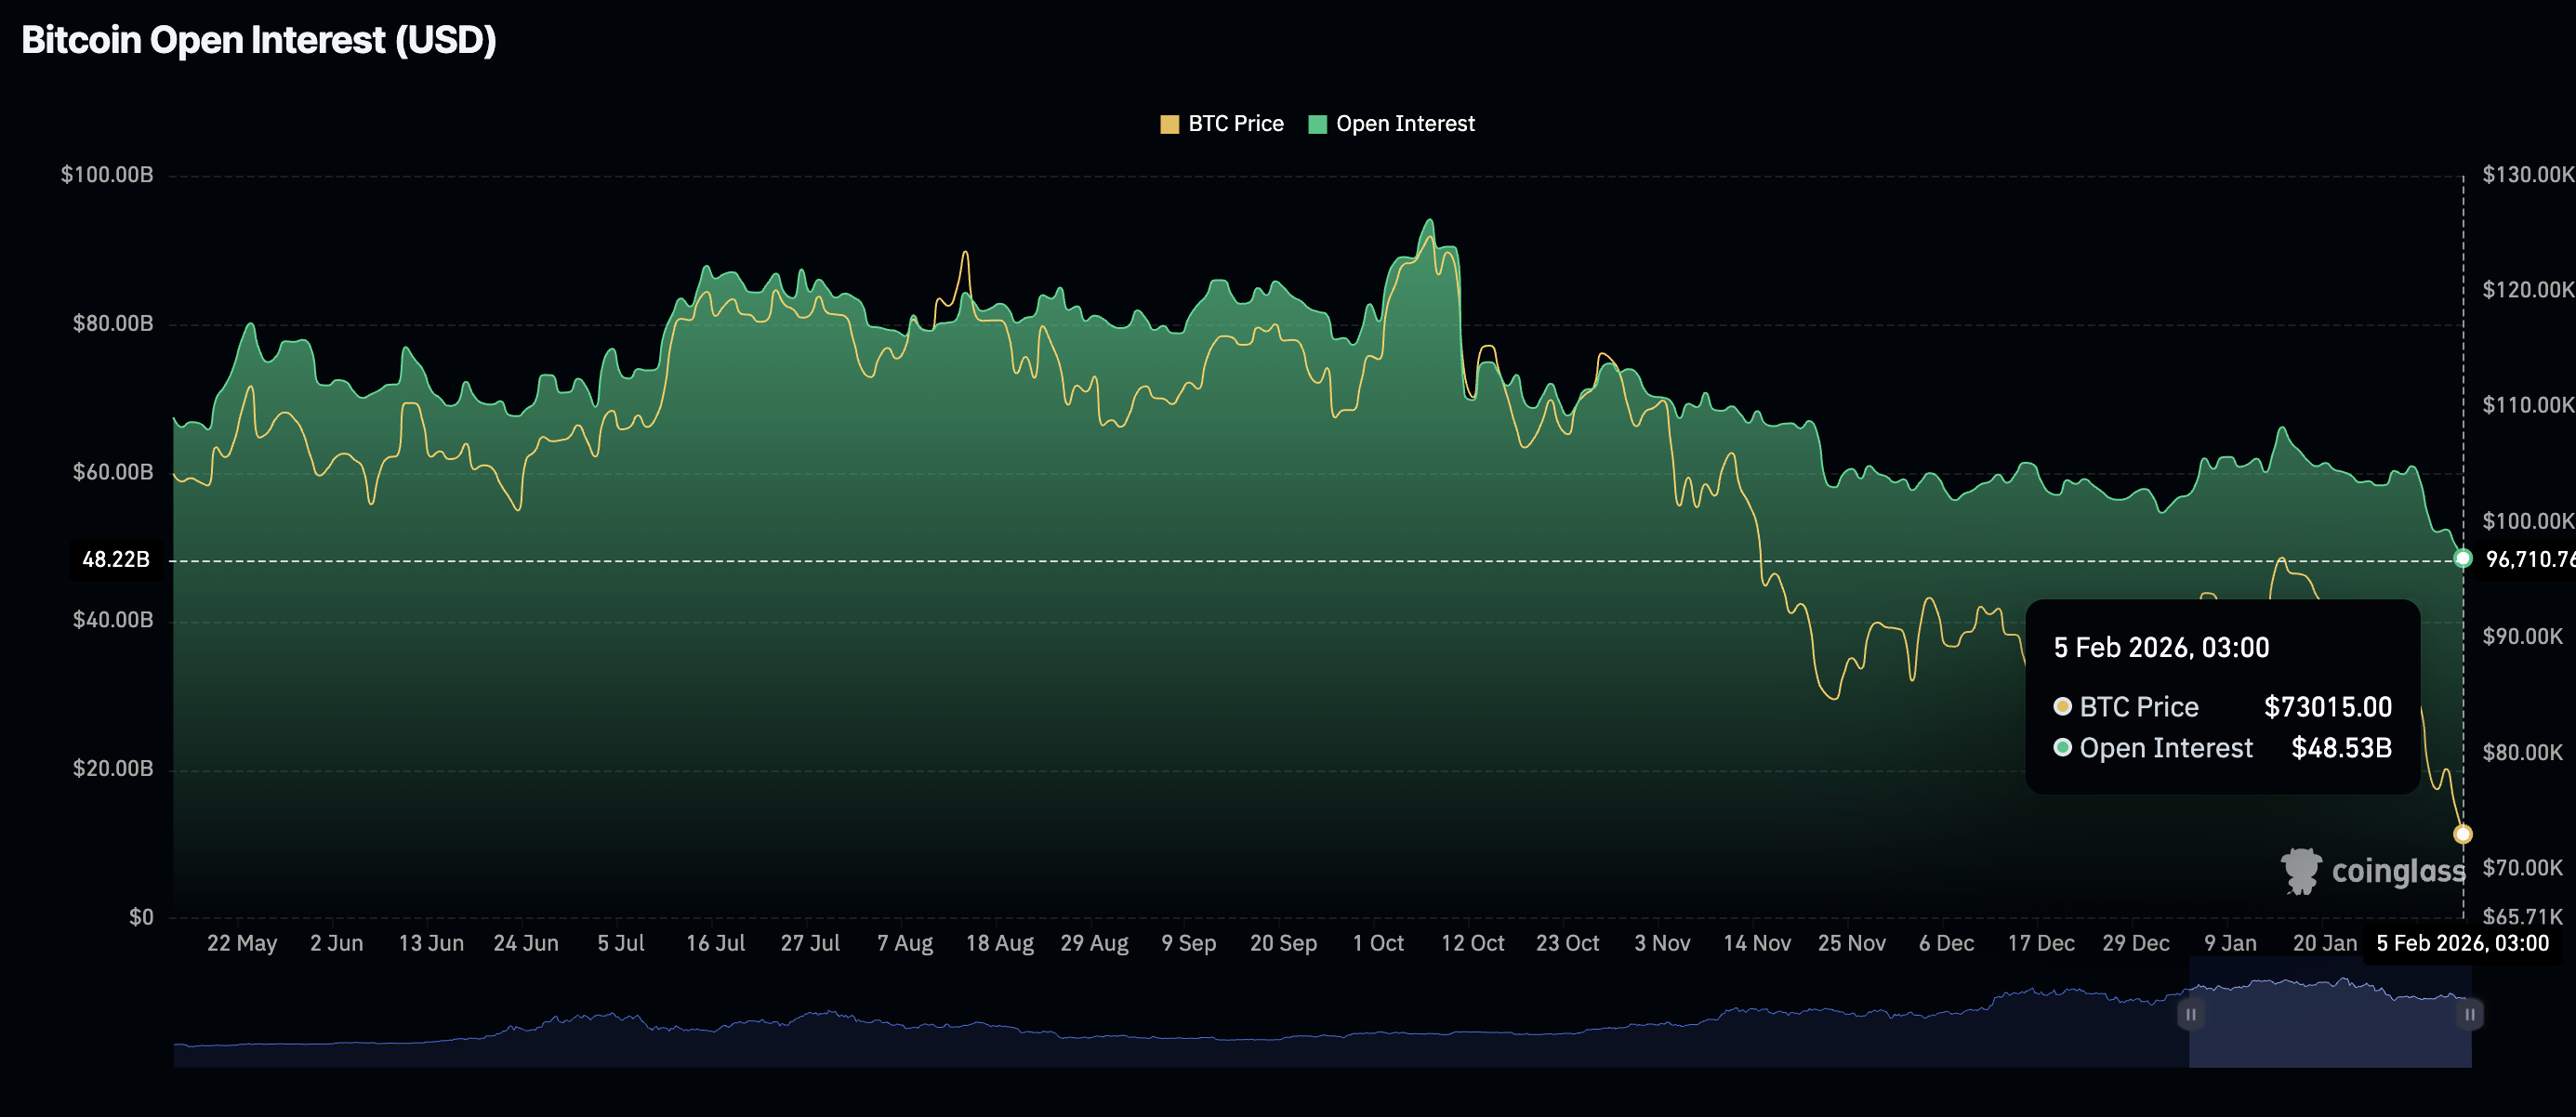
Bitcoin is facing a major exodus of retail investors, as futures Open Interest (OI) falls to $48.53 billion on Thursday, from $50.5 billion the previous day.
OI represents the notional value of outstanding futures contracts, which means a persistent decline reduces the liquidity required to support Bitcoin’s steady rise. CoinGlass data shows that OI hit a record $94.1 billion on October 7, ahead of the October 10 crash that liquidated over $19 billion in leveraged crypto assets.
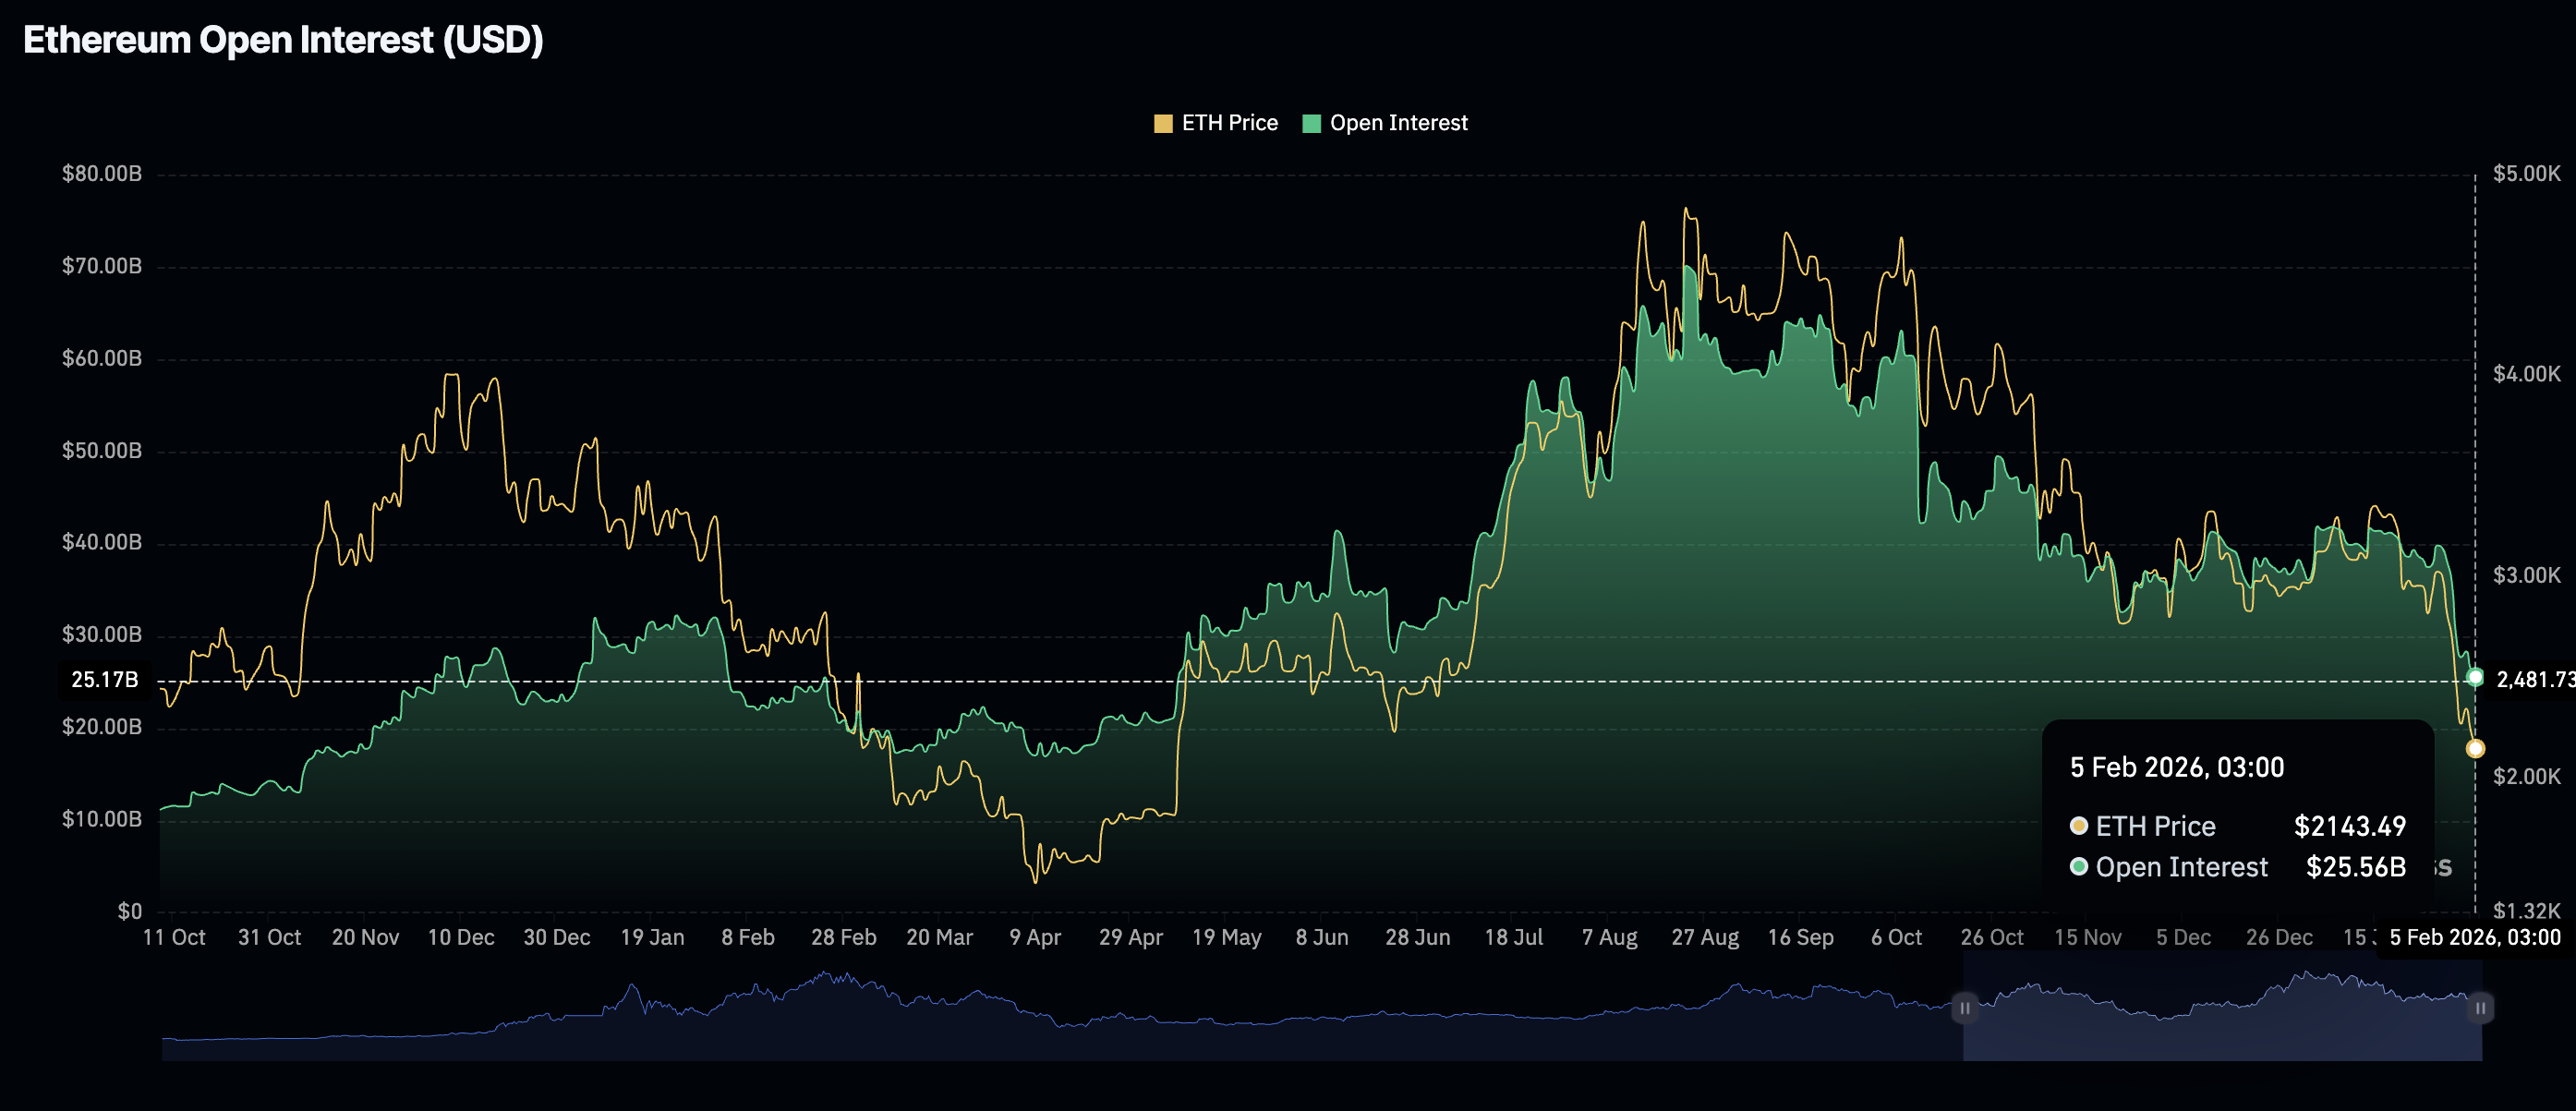
Similarly, Ethereum faces a significant drop in retail demand, as traders increasingly close positions rather than open new ones. The smart contract’s token’s derivatives market remains weak, with futures OI plummeting to $25.6 billion, from $26.3 billion the previous day.
The downtrend in retail interest accelerated from late January amid intense macro headwinds. Meanwhile, rebounds lose steam as bearish market sentiment dominates crypto headlines.
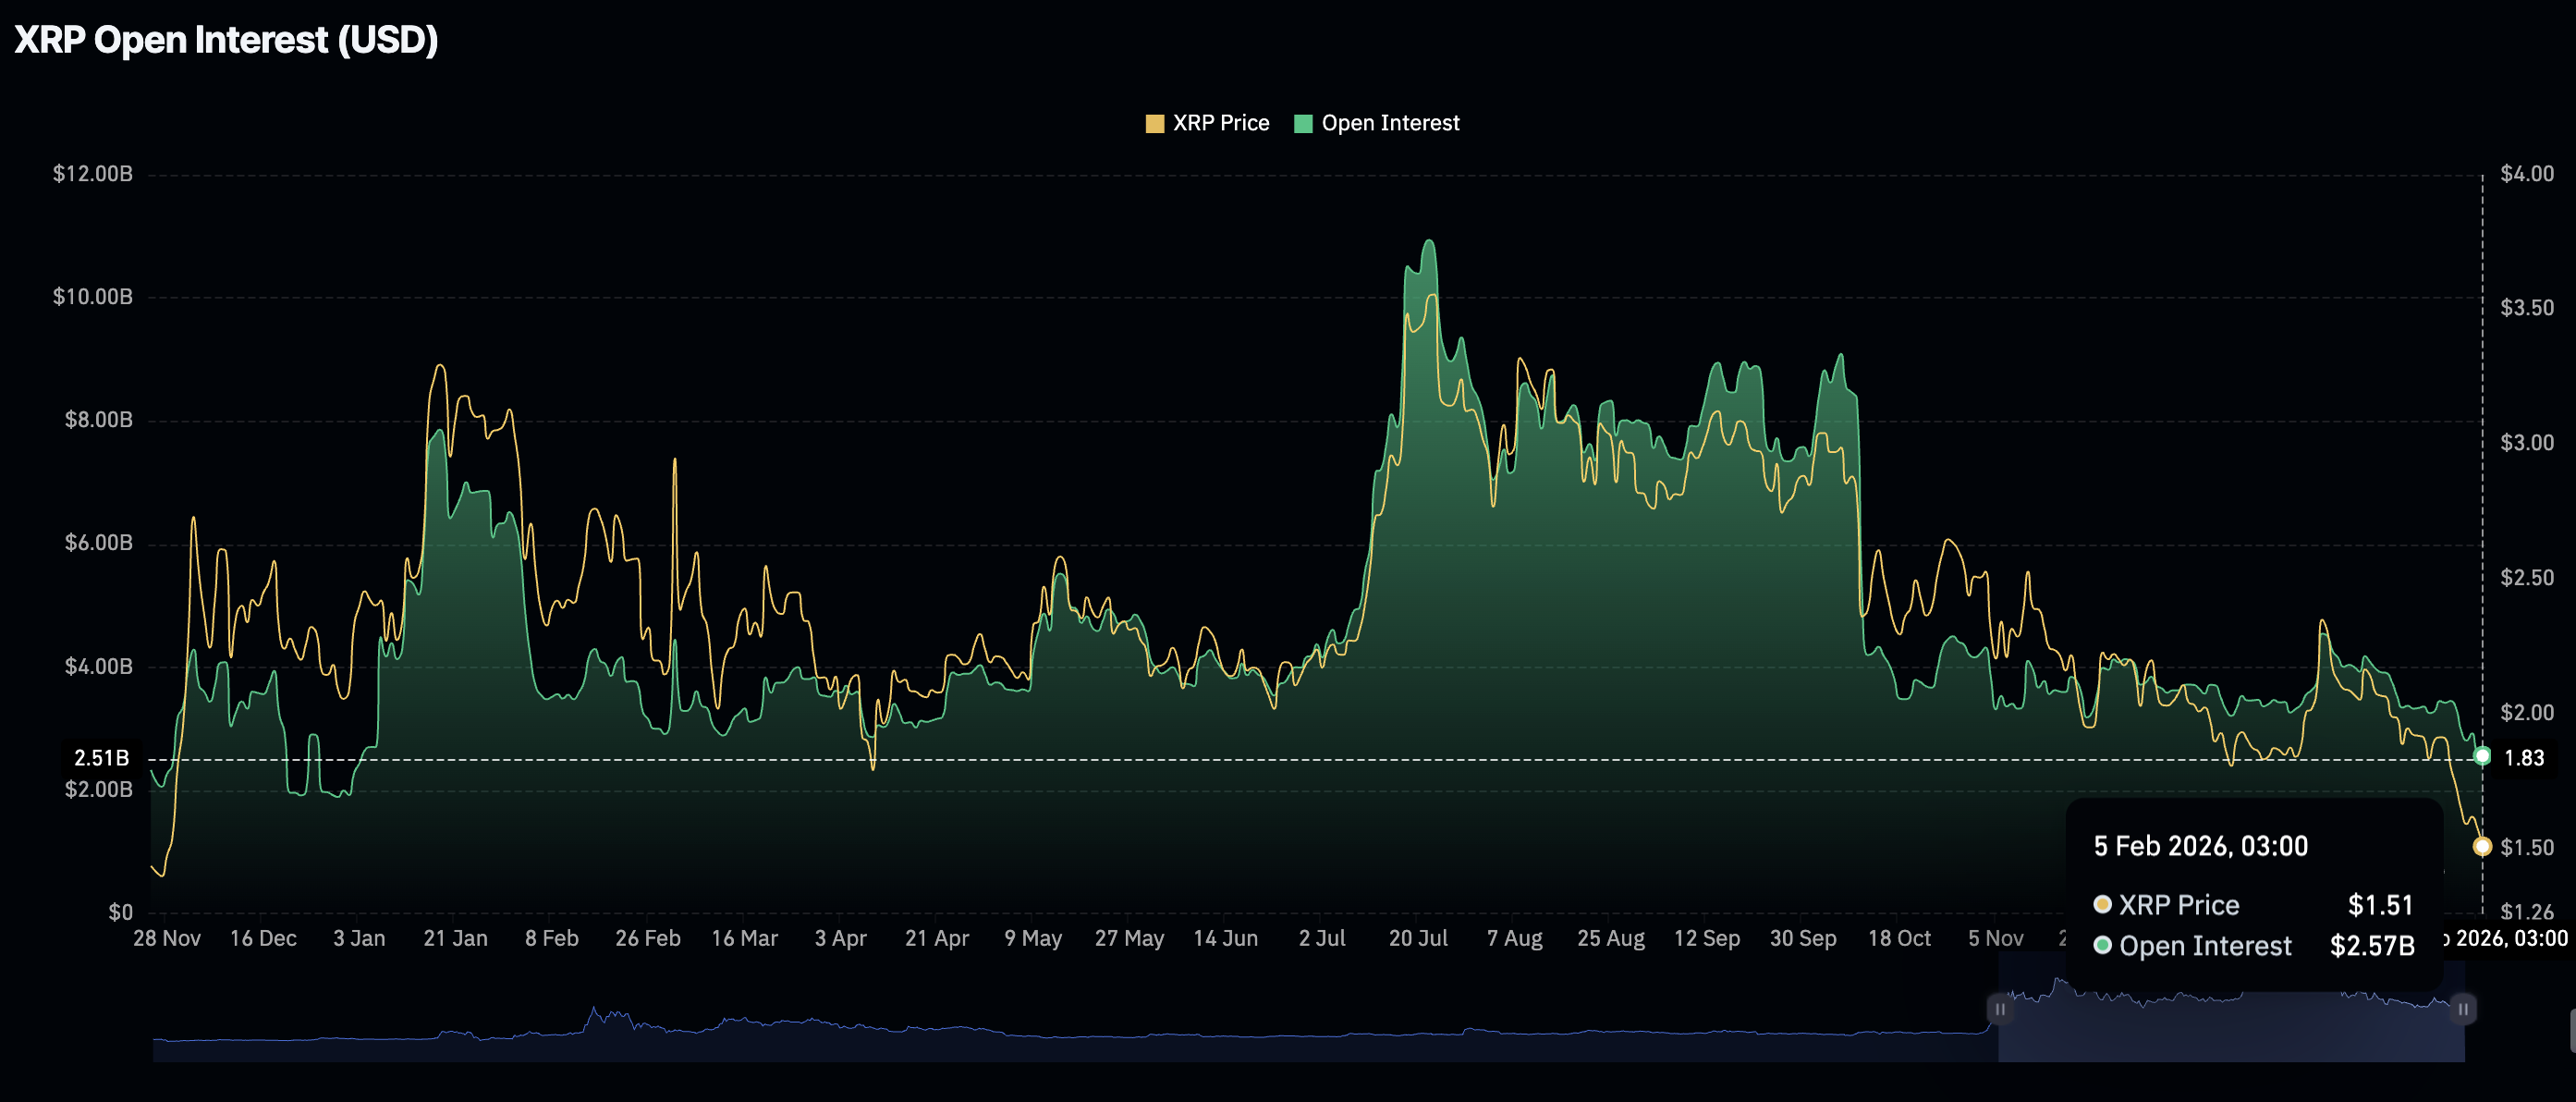
XRP paints a similar grim picture, with weak derivatives taking centre stage. The futures OI is down to $2.57 billion on Thursday, from the $2.61 billion recorded on Wednesday.
The OI has incessantly extended the downtown from its all-time high of $10.94 billion on July 22. XRP hit a historic high at $3.66 on July 18, underscoring the positive impact of rising OI on the price.
Despite the aggressive selling among retail investors, XRP spot Exchange-Traded Funds (ETFs) extended a two-day inflow streak, attracting nearly $5 million in deposits on Wednesday. The cumulative inflow currently stands at $1.21 billion, and net assets under management at $1.07 billion.
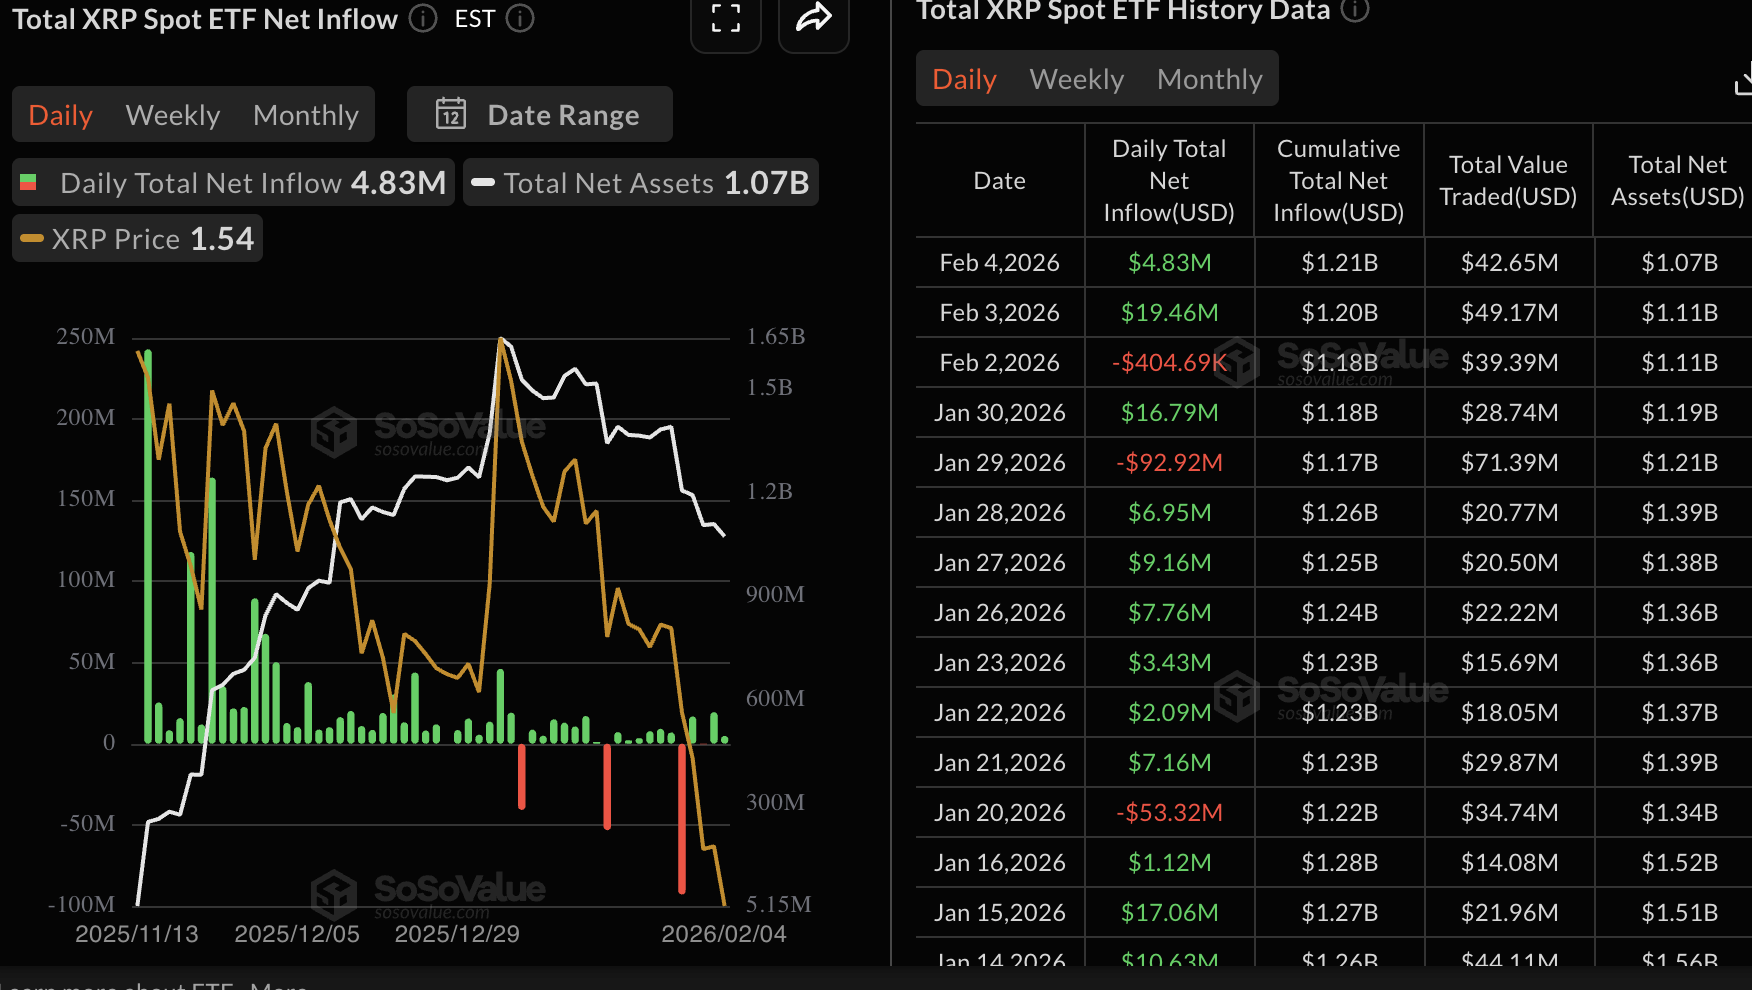
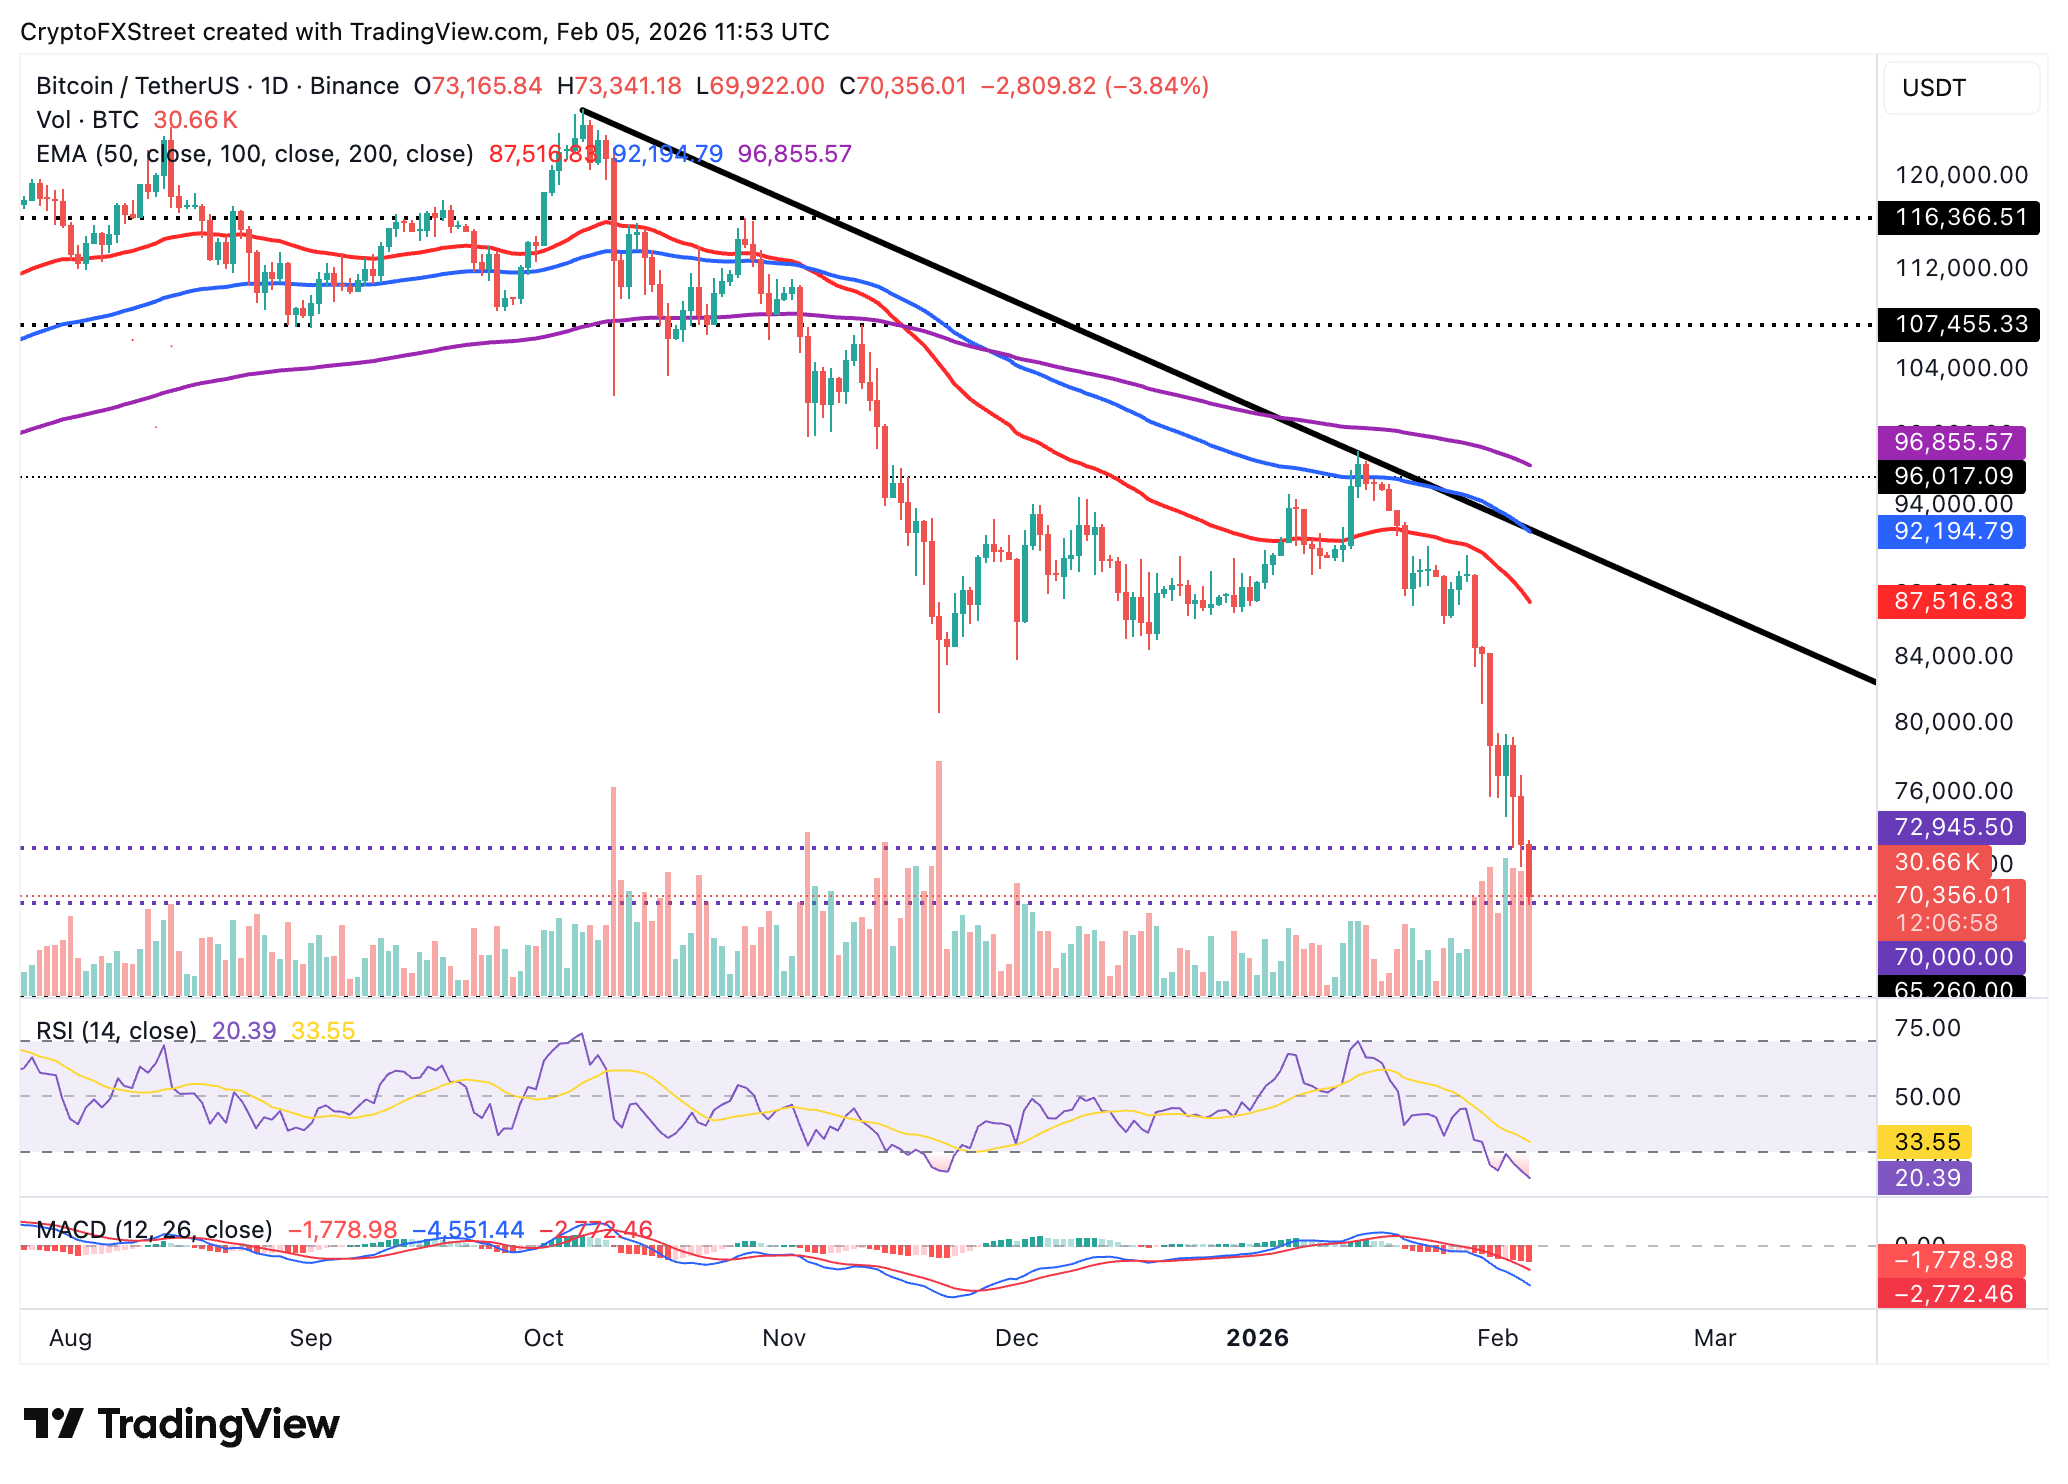
Chart of the day: Bitcoin eyes $70,000 breakdown
Bitcoin trades under aggressive bearish hands toward the psychological $70,000 threshold, weighed down by a weakening technical structure. The Relative Strength Index (RSI) has extended its decline to 20, placing it in oversold territory on the daily chart, as sellers maintain the bearish outlook.
In the meantime, the position of the Moving Average Convergence Divergence (MACD) indicator below the signal line on the same chart may continue to prompt investors to sell BTC and reduce risk exposure.
Closing below $70,000 may trigger a cascade of losses toward $65,260, a support tested on October 23, 2024.
Still, a knee-jerk reversal could be on the cards if bulls lean into risk, seeking exposure at lower prices.
Altcoins technical outlook: Ethereum, XRP sell-offs persist
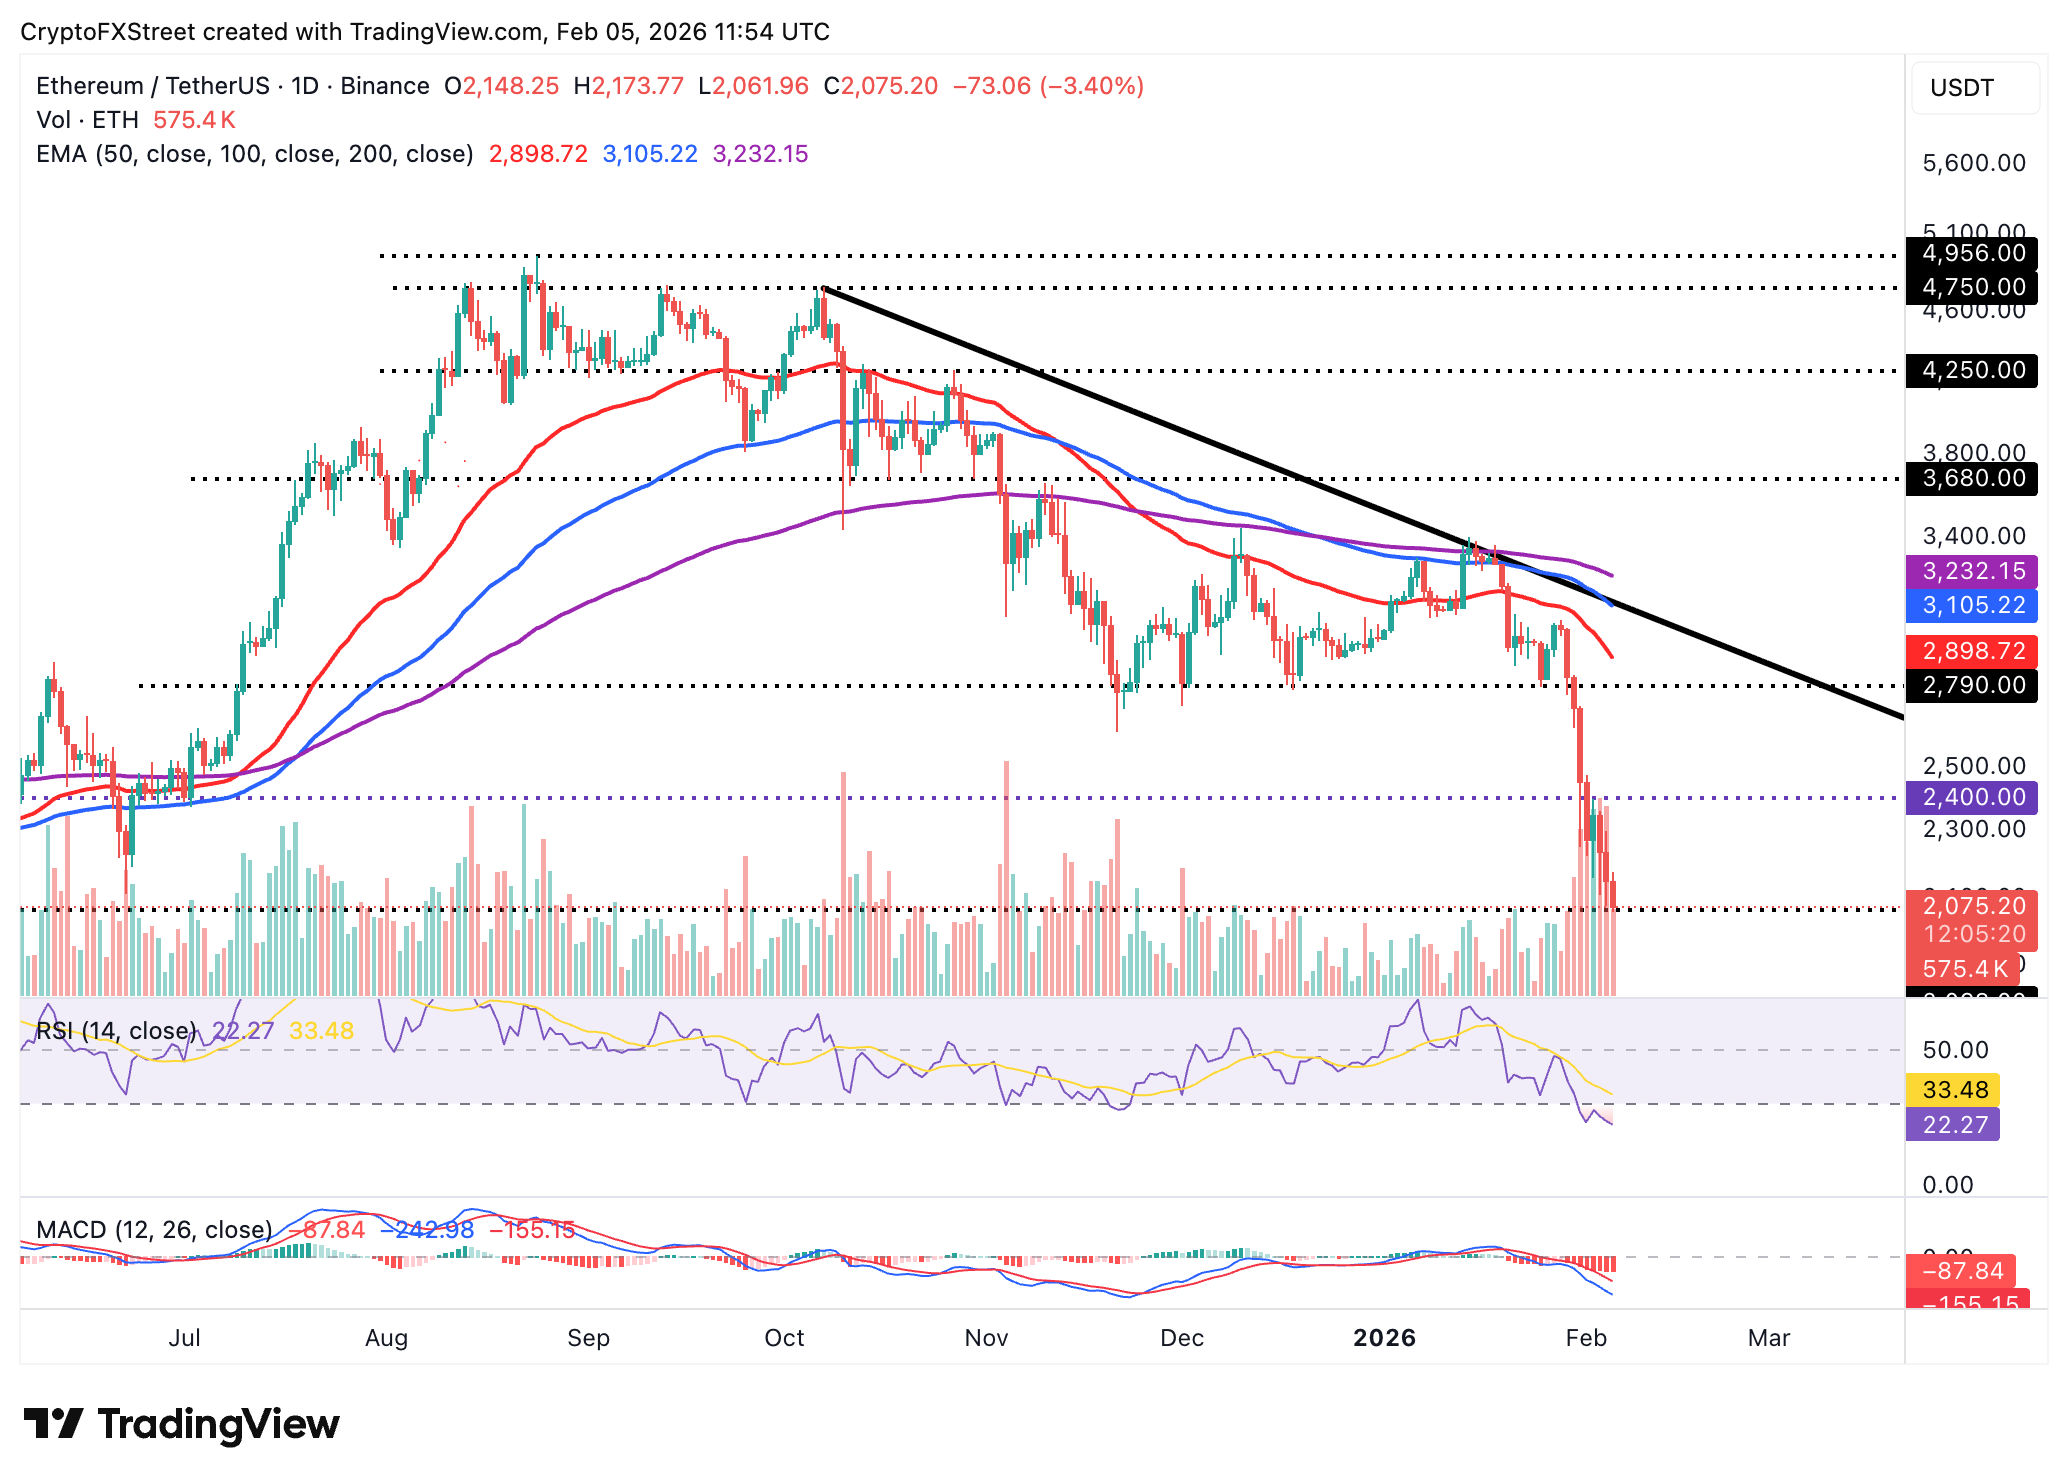
Ethereum exhibits subtle rebound signals after testing an intraday low of $2,068 and rising to trade above $2,000 at the time of writing on Thursday. However, the downward-trending 50-day Exponential Moving Average (EMA) at $2,899, the 100-day EMA at $3,105 and the 200-day EMA at $3,232 cap the token’s recovery potential.
The RSI has dropped to 22, indicating the daily chart is oversold and suggesting bearish momentum is building. A further decline in the RSI could trigger an extended sell-off below $2,000 and toward $1,800 – a level tested in early May.
Despite the bearish outlook and the MACD indicator remaining below its signal line, the red histogram bars show signs of contracting, which may prompt traders to lean into risk, adding to buying pressure and accelerating the recovery toward the $2,400 supply zone.
As for XRP, aggressive selling is underway, with the token down approximately 9.5% intraday. The remittance token plunges below the $1.40 level, and given the downtrending 50-day EMA at $1.90, the 100-day EMA at $2.07, and the 200-day EMA at $2.23, the path of least resistance remains downward.
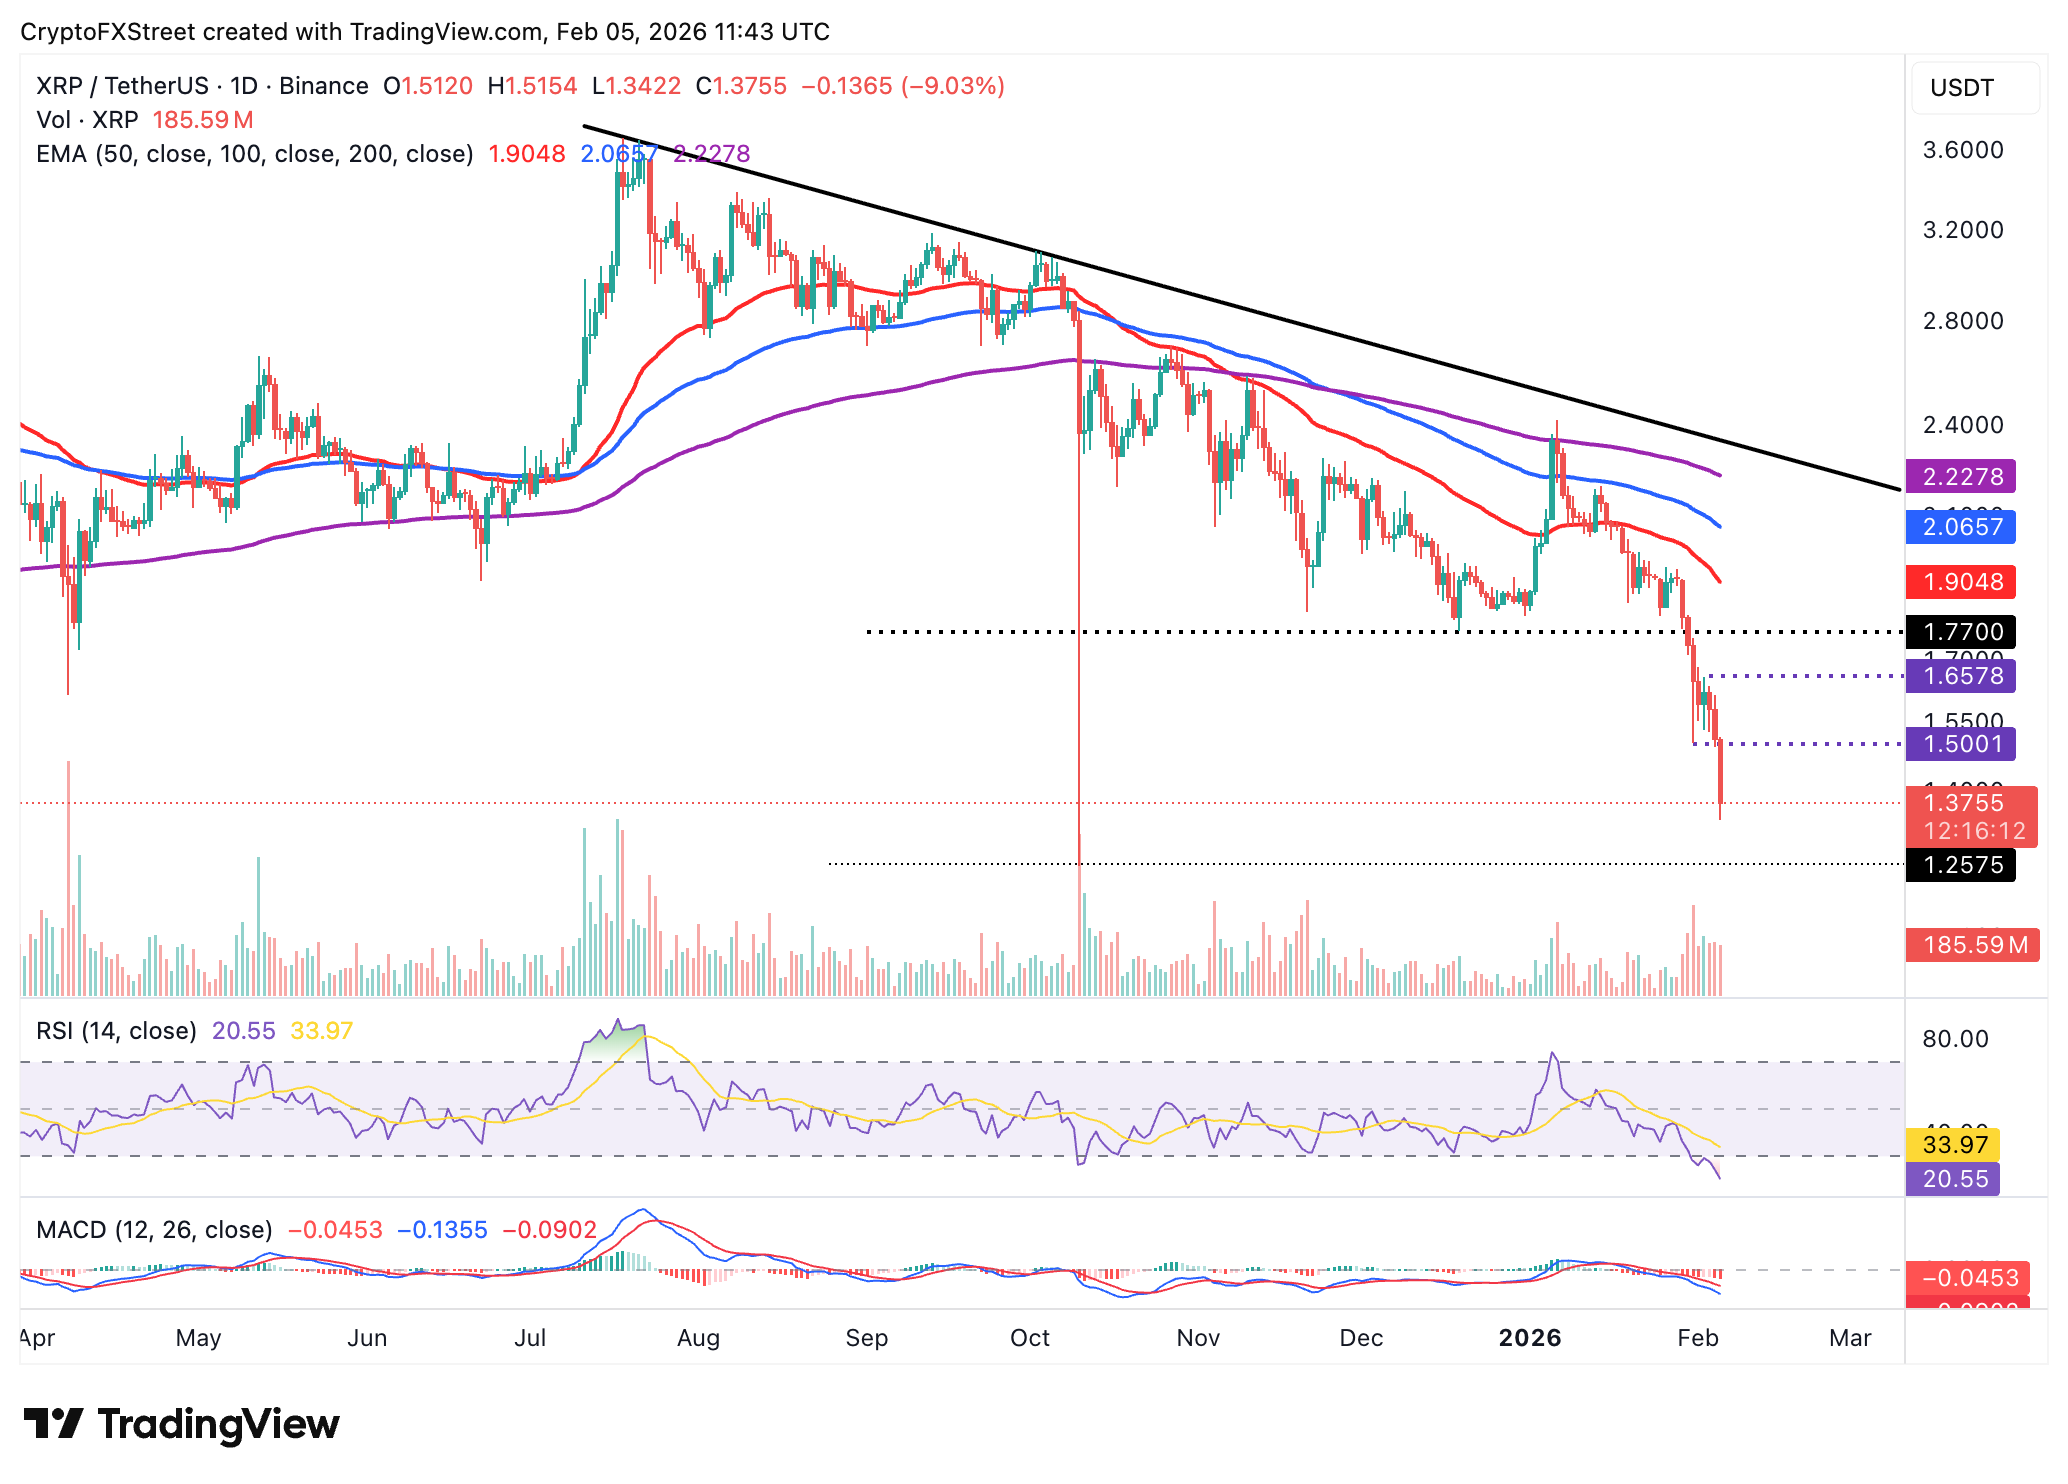
The RSI at 21 in oversold territory on the daily chart reinforces the bearish grip, while the MACD indicator remains below its signal line on the same chart, signaling investors to sell XRP. Red histogram bars continue to expand below the zero line, emphasizing the deteriorating technical picture.
An extended drop below the $1.40 threshold may push XRP further down toward the October 10 low at $1.25. Recovery would remain limited unless bulls gain ground above the support-turned-resistance at $1.50.
Open Interest, funding rate FAQs
Higher Open Interest is associated with higher liquidity and new capital inflow to the market. This is considered the equivalent of increase in efficiency and the ongoing trend continues. When Open Interest decreases, it is considered a sign of liquidation in the market, investors are leaving and the overall demand for an asset is on a decline, fueling a bearish sentiment among investors.
Funding fees bridge the difference between spot prices and prices of futures contracts of an asset by increasing liquidation risks faced by traders. A consistently high and positive funding rate implies there is a bullish sentiment among market participants and there is an expectation of a price hike. A consistently negative funding rate for an asset implies a bearish sentiment, indicating that traders expect the cryptocurrency’s price to fall and a bearish trend reversal is likely to occur.
Author

John Isige
FXStreet
John Isige is a seasoned cryptocurrency journalist and markets analyst committed to delivering high-quality, actionable insights tailored to traders, investors, and crypto enthusiasts. He enjoys deep dives into emerging Web3 tren


