Top 3 Price Prediction Bitcoin, Ethereum, Ripple: Bitcoin bulls could eye $70,000 above consolidation zone
- Bitcoin price consolidates between $62,000 and $64,700 key levels, suggesting a phase of uncertainty among traders.
- Ethereum price breaks and closes above its resistance barrier, signaling a bullish move on the horizon.
- Ripple price is consolidating $0.560 and $0.613 key levels, indicating a period of indecision among traders.

Bitcoin (BTC) and Ripple (XRP) are consolidating between their key levels, reflecting a period of indecision among traders. At the same time, Ethereum (ETH) demonstrates signs of a rally after successfully closing above its resistance barrier.
Bitcoin price consolidates between $62,000 and $64,700 range
Bitcoin price has been consolidating between the $62,000 and $64,700 key levels for over six days. As of Wednesday, it trades at $64,360.
If Bitcoin’s price breaks above this consolidating range around $64,700, it could first rise to retest its daily resistance level at $65,379. A successful daily close above this level could extend the rally by 7% to retest its July 29 high of $70,079.
The Relative Strength Index (RSI) on the daily chart trades above its neutral level of 50 and points upwards at 65. A cross to levels above 60 generally indicates bullish momentum is gaining traction. However, traders should be cautious as it approaches its overbought level at 70.
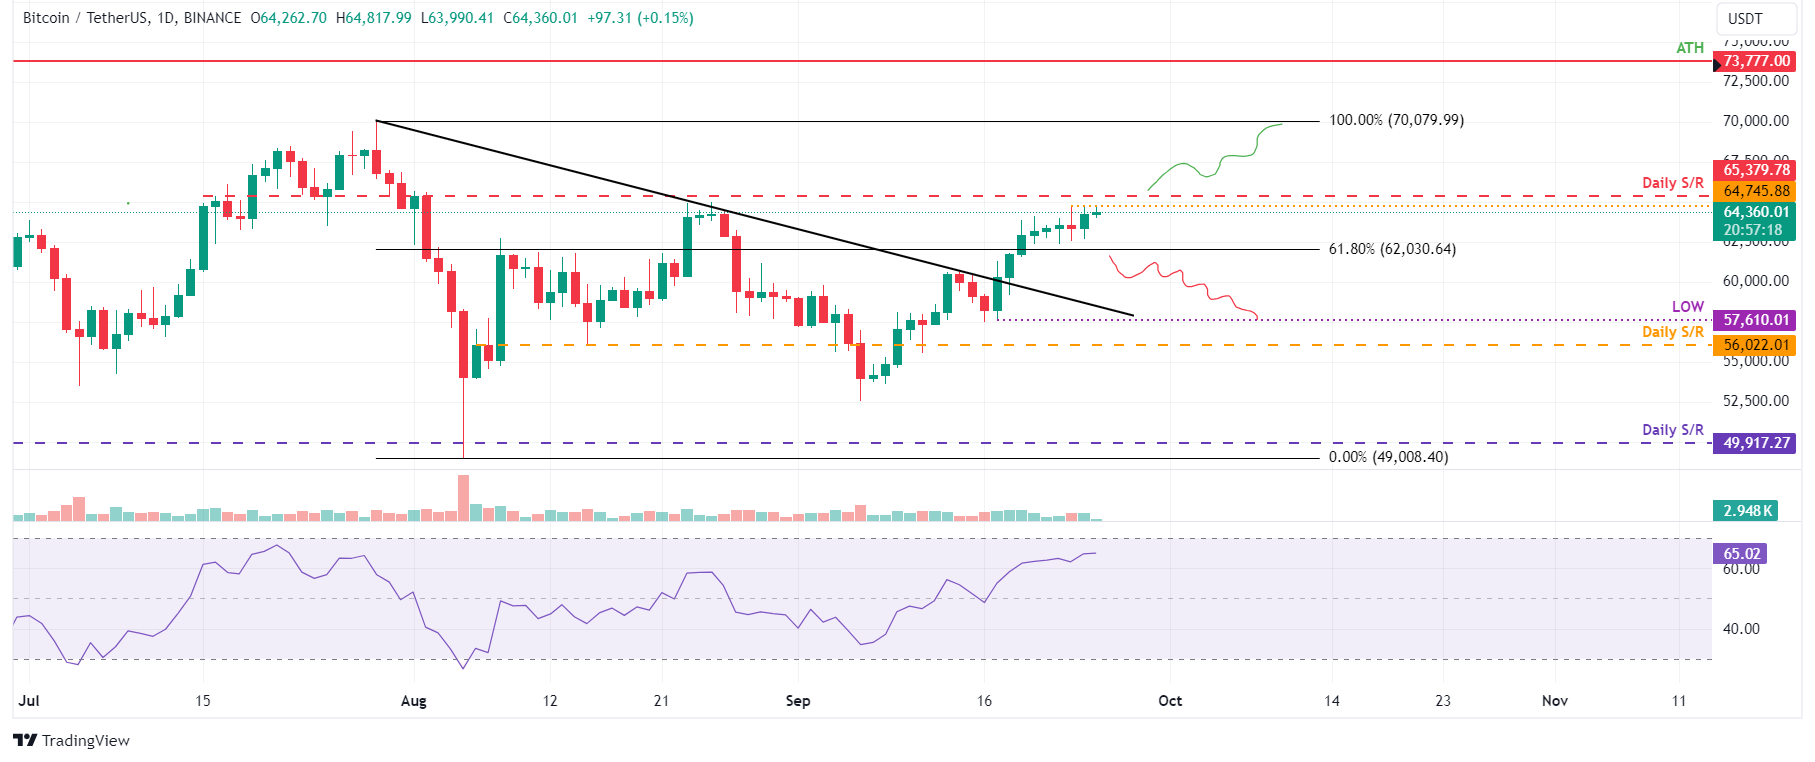
BTC/USDT daily chart
However, if BTC breaks and closes below the consolidation zone around $62,000, it could decline 7% to retest its September 17 low of $57,610.
Ethereum price eyes an upswing after surpassing the resistance barrier
Ethereum price broke above its descending trendline (drawn by joining multiple high levels from July 22) on September 19 and rose 3.9% the next day to close above its daily resistance level of $2,461. It continued to rise 3.5% in the next four days, and as of Wednesday, it is trading at around $2,643.
If the daily level of around $2,461 holds as support, Ethereum could continue to rise 6.6% from its current trading level to retest its August 24 high of $2,820.
The RSI on the daily chart is edging lower near the 60 level, reflecting the decrease in the bullish momentum. For the rally to be sustained, the RSI must rise above 60, which generally indicates that bulls are gaining traction.
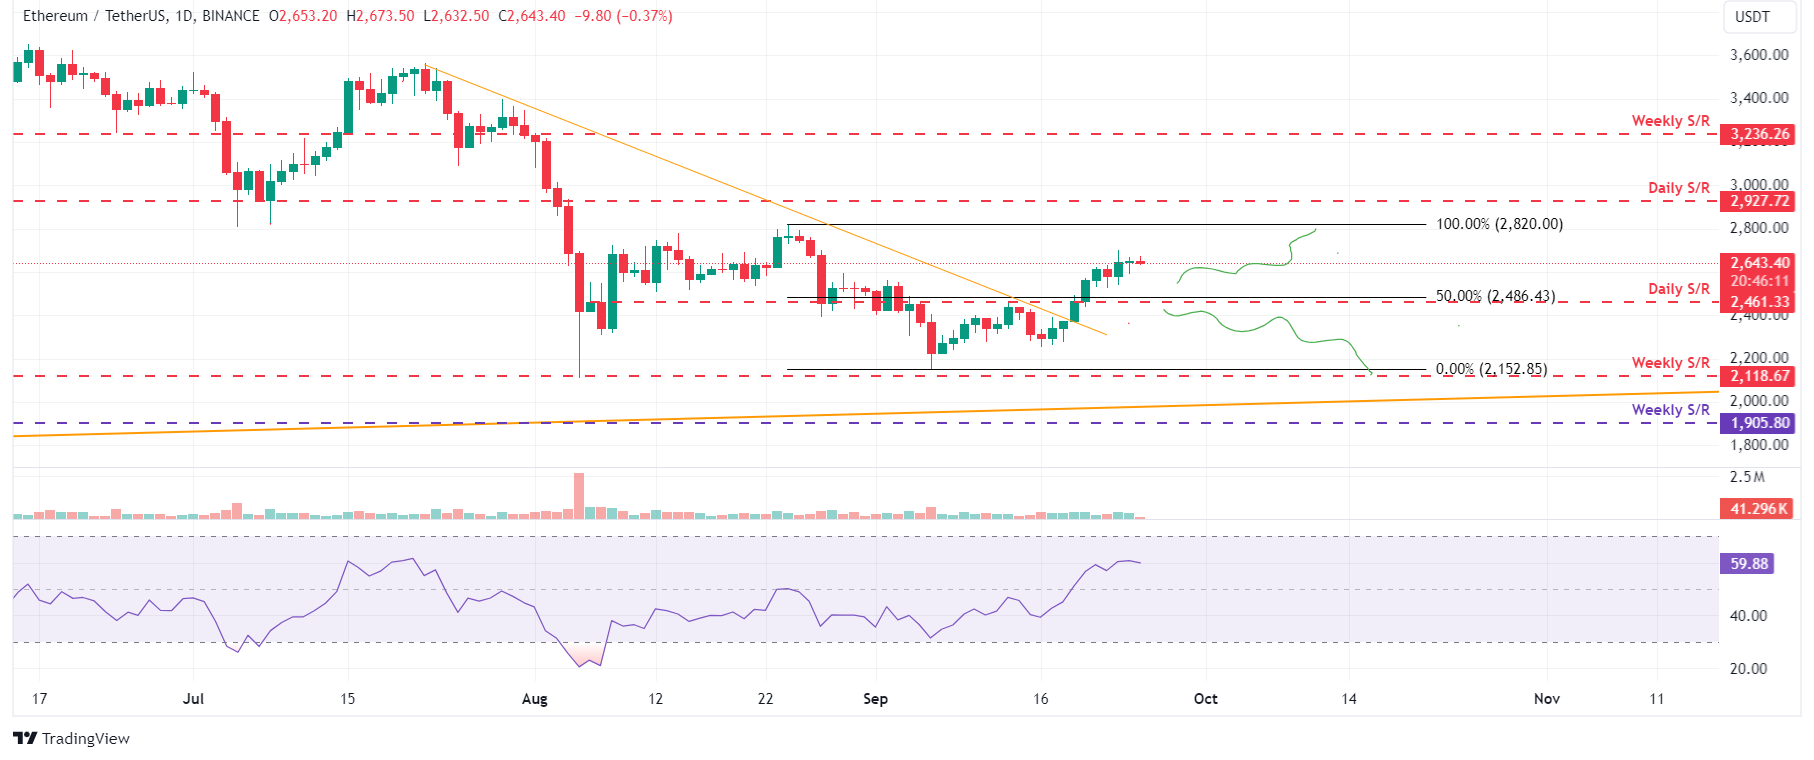
ETH/USDT daily chart
On the other hand, if Ethereum closes below the daily support level of $2,461, it could decline further to retest its September 6 low of $2,152.
Ripple price consolidates between two key levels
Ripple price has been trading above its ascending trendline (drawn by connecting multiple low levels from July 5) and consolidating between the $0.560 and $0.613 key levels for more than 11 days. As of Wednesday, it trades at around $0.592.
If Ripple breaks above this consolidating range around $0.613, it could first rise to retest its daily resistance level at $0.626. A successful daily close above this level could extend the rise by 5% to retest its July 31 high of $0.658.
The RSI on the daily chart trades above its neutral level of 50 and is hovering around 57. For the rally to be sustained, the RSI must rise above 60, which indicates that bulls are getting strong for the uprise.
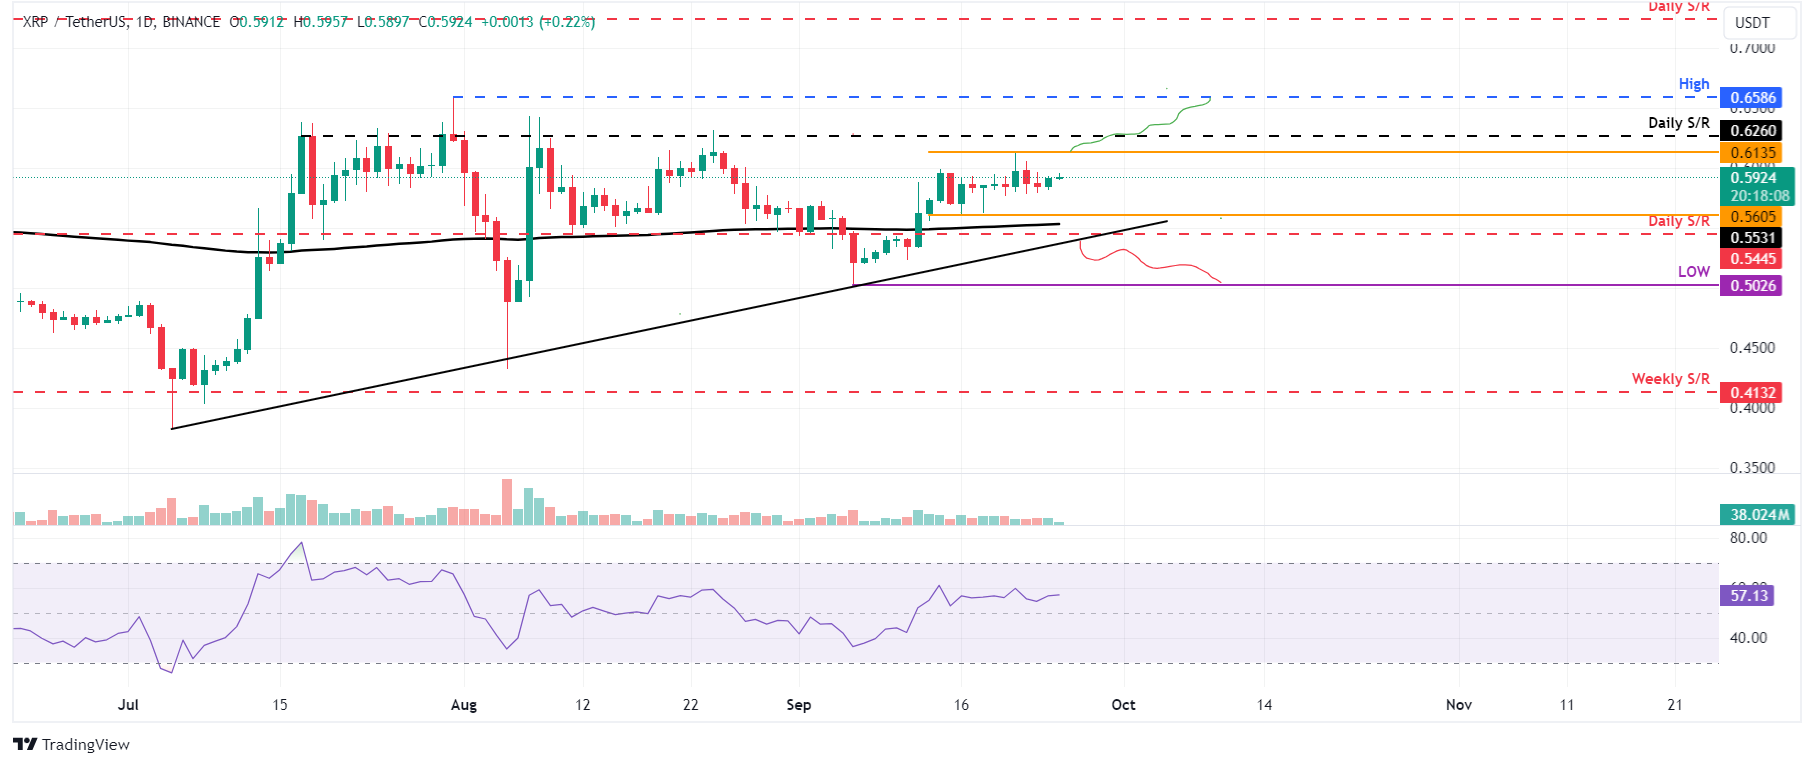
XRP/USDT daily chart
However, if Ripple’s price breaks below the consolidation zone around $0.560 and closes below the $0.544 daily support level, it would also break below the ascending trendline, changing the market structure to bearish. In such a case, XRP would decline 7.5% to retest its September 6 low of $0.502.
Author

Manish Chhetri
FXStreet
Manish Chhetri is a crypto specialist with over four years of experience in the cryptocurrency industry.


