Top 3 Price Prediction Bitcoin, Ethereum, Ripple: Altcoin season just around the corner
- The market’s apparent calm masks Bitcoin's critical situation in the war for dominance.
- The current technical setup is dual, allowing sudden changes in the price of Bitcoin and Ethereum.
- Altcoins' season could bring Bitcoin's dominance below 60% market share.

The apparent calm in the crypto market hides the importance of the current technical moment. There is hardly any imminent risk in fiduciary value quotations. When we get down to the structural scale of the market, it looks somewhat less reassuring.
The war for dominance continues in earnest, and at this point, Bitcoin is waging a major battle for the structural development of the market in the coming months.
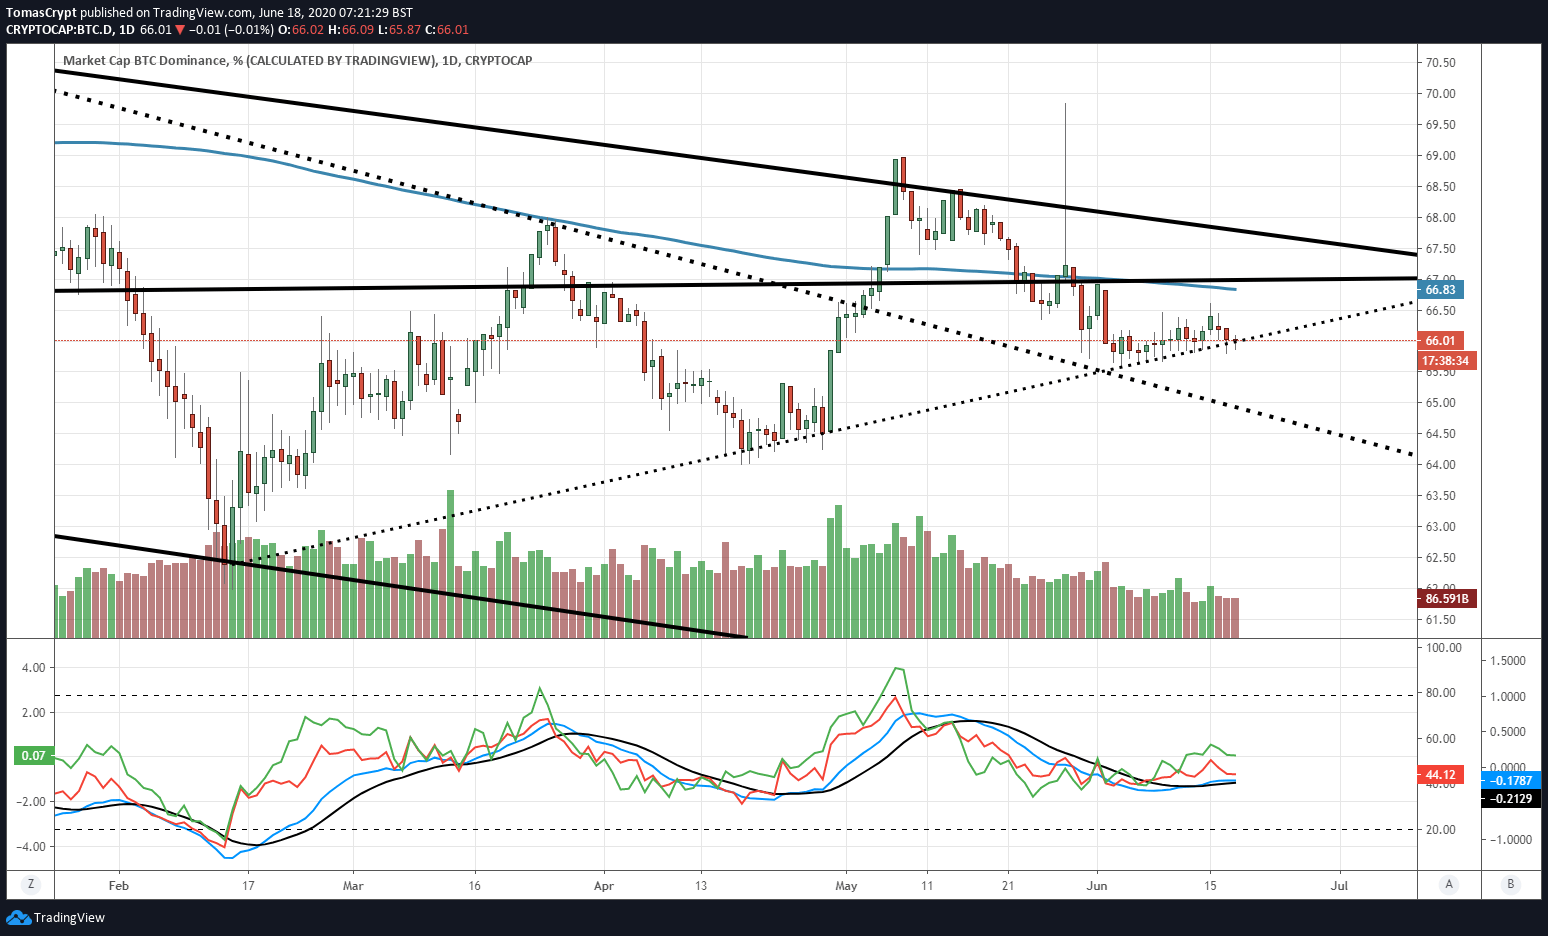
As we can see from the Bitcoin Dominance chart, the King is gambling everything on defending the uptrend line from collapsing to the 64% level first and probably below 60% later.
If the Bitcoin dominance level definitively loses its current support level, Altcoins' season would be declared officially opened. Within that scenario, it's not clear what the role of Ethereum would be.
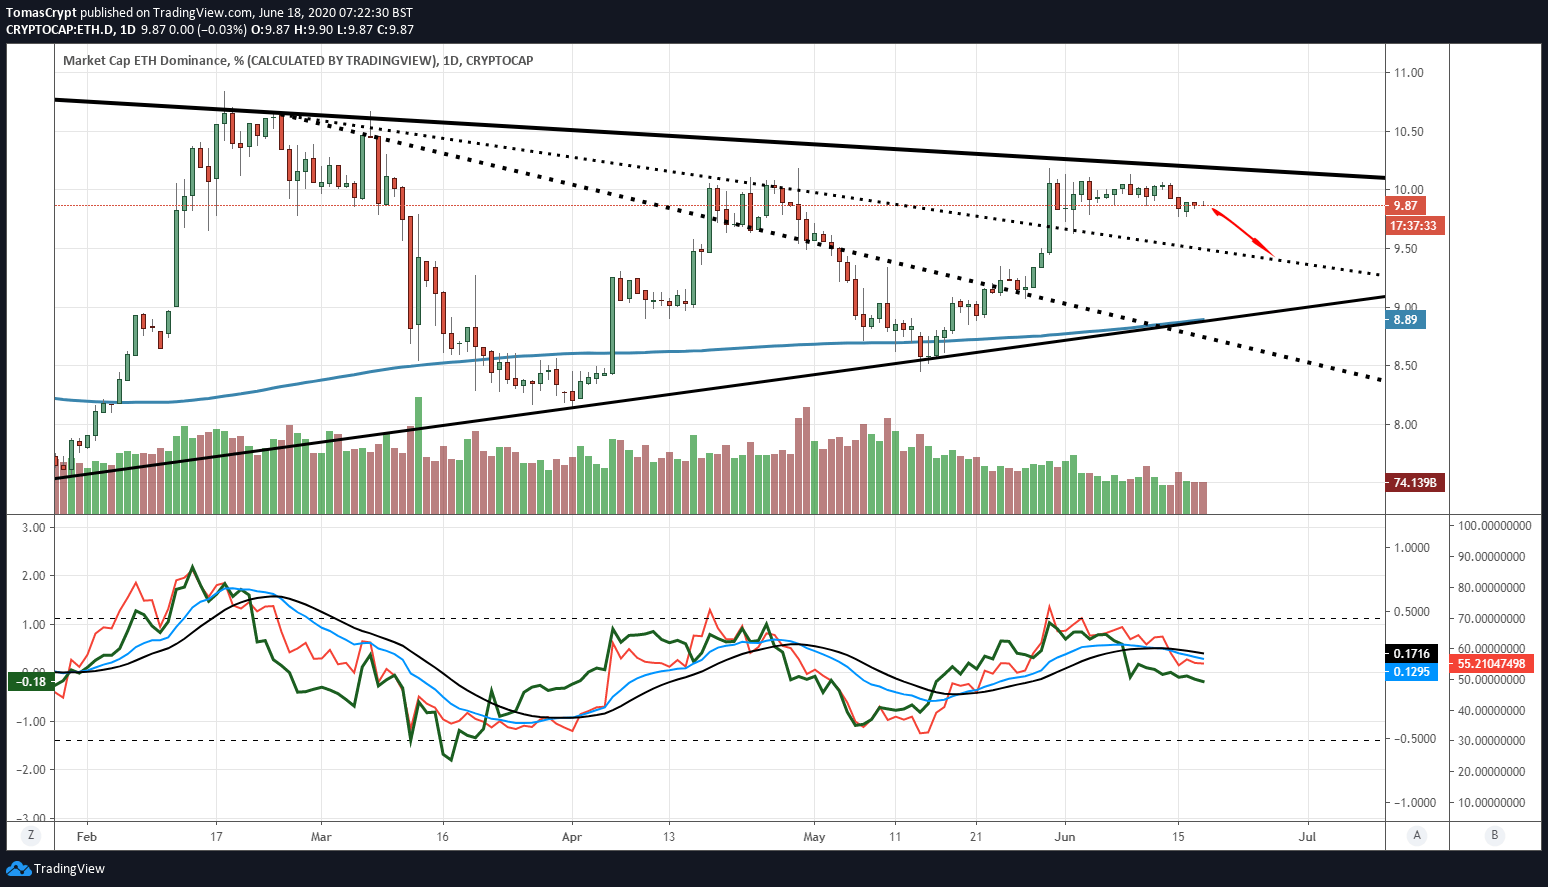
Ether's dominance chart is just a few points away from the primary resistance level at 10.22. Still, technical indicators show a depleted structure and suggest a downward movement as a more likely future development.
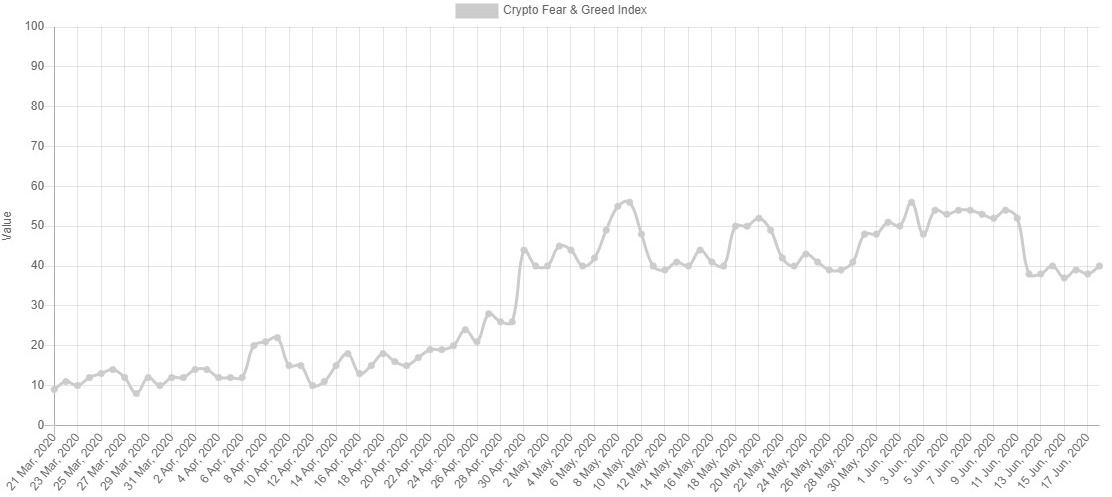
The market sentiment level continues to indicate that there is little confidence among market participants. The indicator created by the site alternative.me reaches today the level 40.
ETH/BTC Daily Chart
The ETH/BTC pair is currently trading at the price level of 0.0247 and have a similar situation that in the case of the dominance chart. It is moving very close to the major resistance of the current scenario at 0.0252.
Above the current price, the first resistance level is at 0.0248, then the second at 0.0252 and the third one at 0.0258.
Below the current price, the first support level is at 0.0235, then the second at 0.0225 and the third one at 0.021.
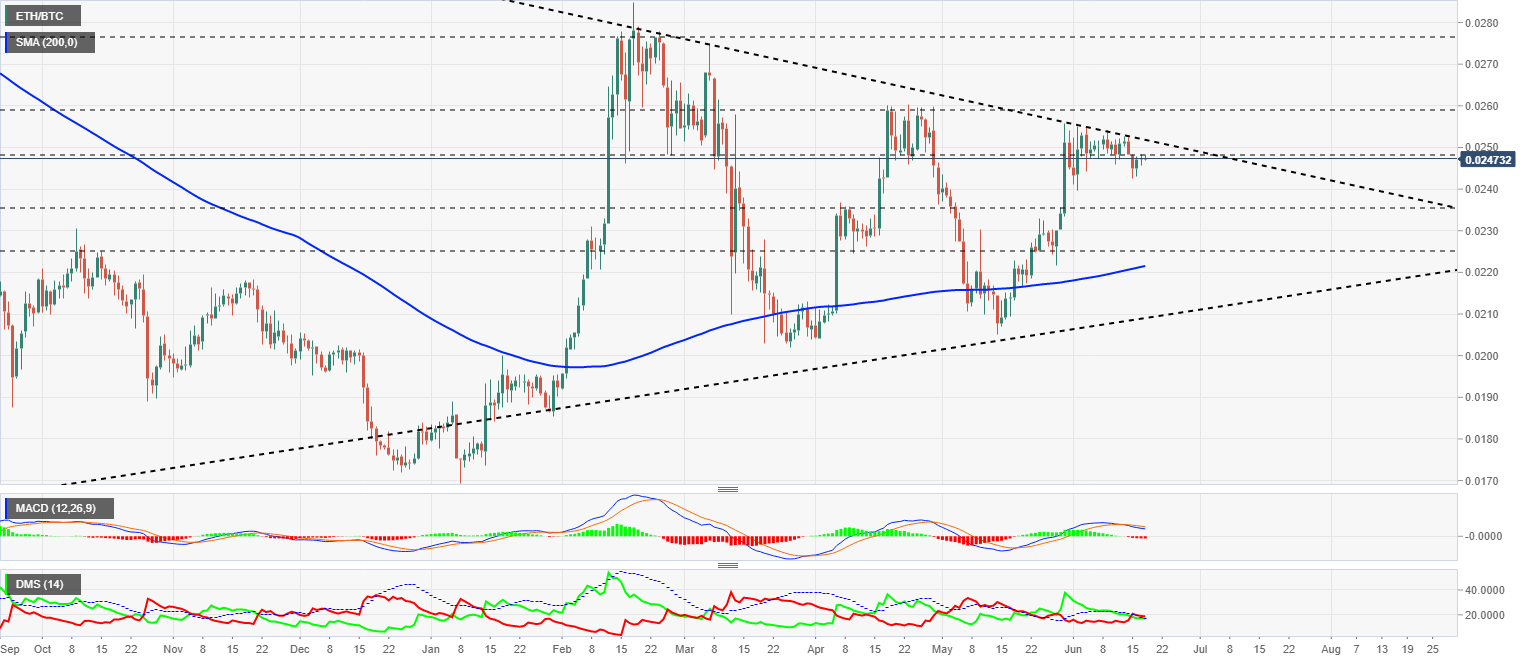
The MACD on the daily chart maintains the bearish cross but barely increases the bearish potential. The moving averages that make up the indicator could quickly flip upwards.
The DMI on the daily chart shows bears and bulls moving in a very narrow range and above the ADX line. This structure facilitates a possible violent break from the current situation.
BTC/USD Daily Chart
The BTC/USD pair is currently trading at the price level of $9430 while moving a little further into the expanding triangle scenario (A).
Above the current price, the first resistance level is at $9500, then the second at $10450 and the third one at $11400.
Below the current price, the first support level is at $9100, then the second at $8750 and the third one at $9250.
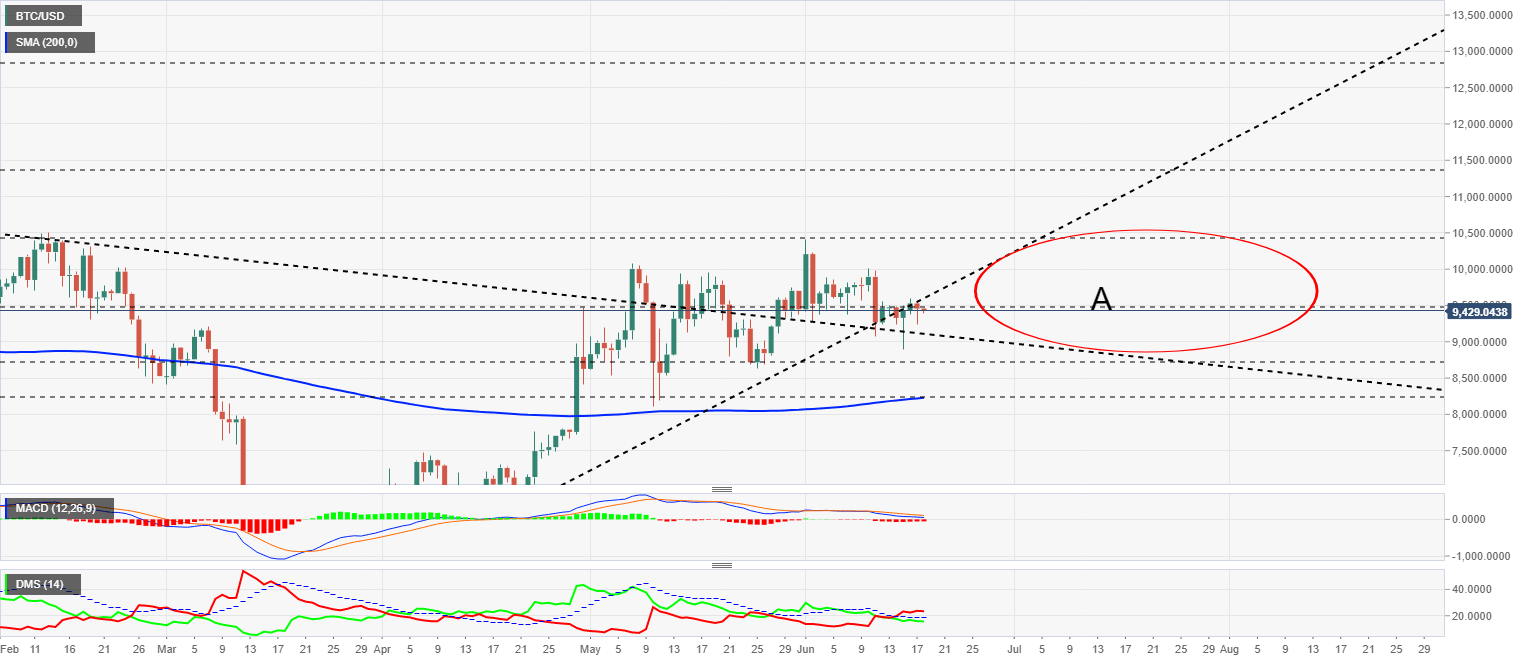
The MACD on the daily chart continues to move gently lower and finds support at the zero levels of the indicator. The current support level may help to support a possible upward rebound.
The DMI on the daily chart shows the bulls taking advantage of the bullish trend. The bullish side remains at similar levels as the previous days and shows no intention of moving lower.
ETH/USD Daily Chart
The ETH/USD pair is currently trading at the price level of $233.3 and remains within striking distance of the higher resistance level of the current scenario.
Above the current price, the first resistance level is at $235, then the second at $245 and the third one at $265.
Below the current price, the first support level is at $220, then the second at $200 and the third one at $180.
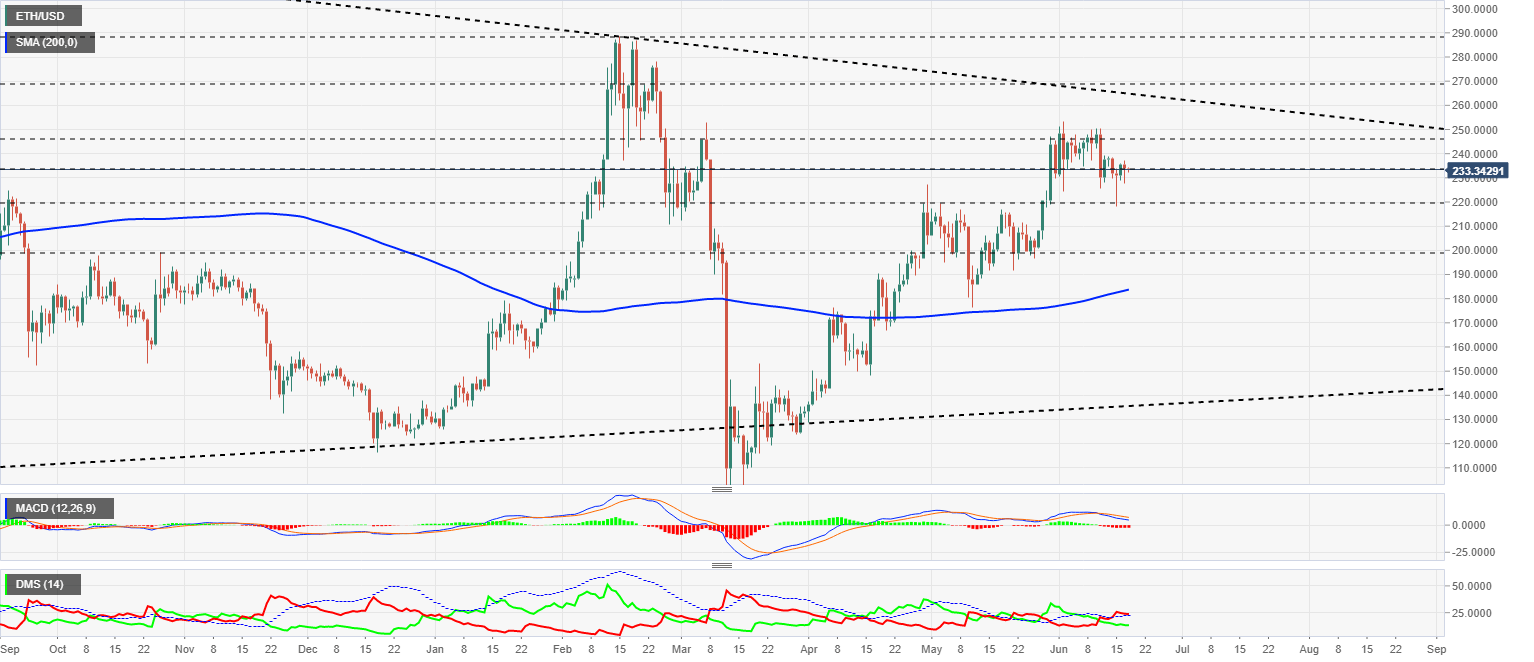
The MACD on the daily chart continues to cross the overbought region, but with little increase in the bearish potential. The current position would allow an upward movement that would undo the bearish structure.
The DMI on the daily chart shows bears looking for support on the ADX line and where it could bounce upwards for a new downward development of the price.
XRP/USD Daily Chart
The XRP/USD pair is currently trading at $0.1913 and is not reacting positively to the better than expected outlook for the bulls in the indicators. Critical support for the current scenario is at $0.187, and if Ripple were to drill down, we could see a sell-off of epic proportions.
Above the current price, the first resistance level is at $0.20, then the second at $0.212 and the third one at $0.235.
Below the current price, the first support level is at $0.19, then the second at $0.18 and the third one at $0.163.
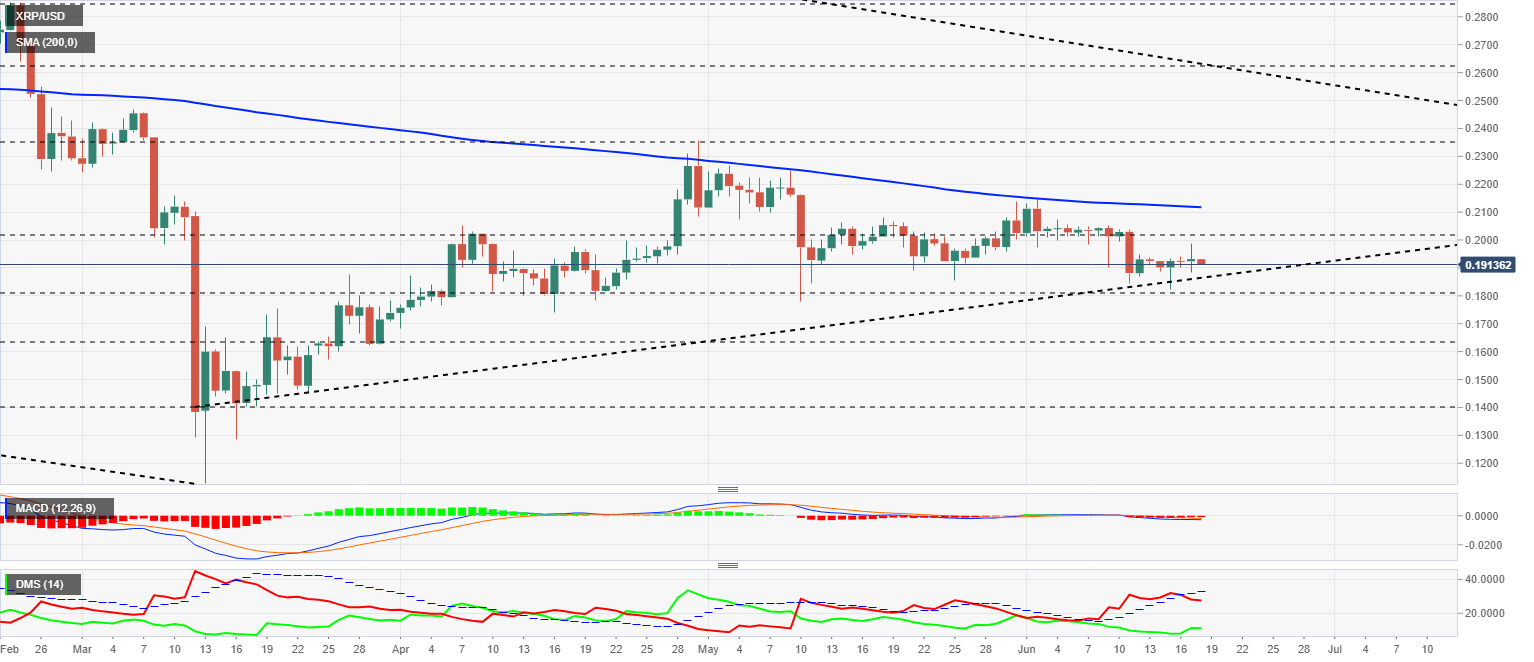
The MACD on the daily chart is moving horizontally to the neutral line of the indicator, but just below it. The current structure is prone to move downwards, as moving averages lack the necessary inclination to be able to attack and attempt to cross into the bullish zone safely.
The DMI on the daily chart shows the bears losing trend strength while the bulls increase it. The current structure is favorable for bulls, although bears may still have a short-term upward movement where they would confirm the downward break of the ADX.
Author

Tomas Salles
FXStreet
Tomàs Sallés was born in Barcelona in 1972, he is a certified technical analyst after having completing specialized courses in Spain and Switzerland. He expanded his technical training following the guidance of great experts on the financial markets.


