Top 3 Price Prediction Bitcoin, Ethereum, Ripple: Altcoin season is on the cards
- The key resistance levels broken yesterday would indicate an Altcoin season in play.
- A technical failure in the charts at this point would damage short and medium-term forecasts.
- Ripple tries to join the party but falls far short of levels that could change the short-term outlook.

Yesterday's trading left us with some relevant technical events that can set the course for the crypto market in the coming months.
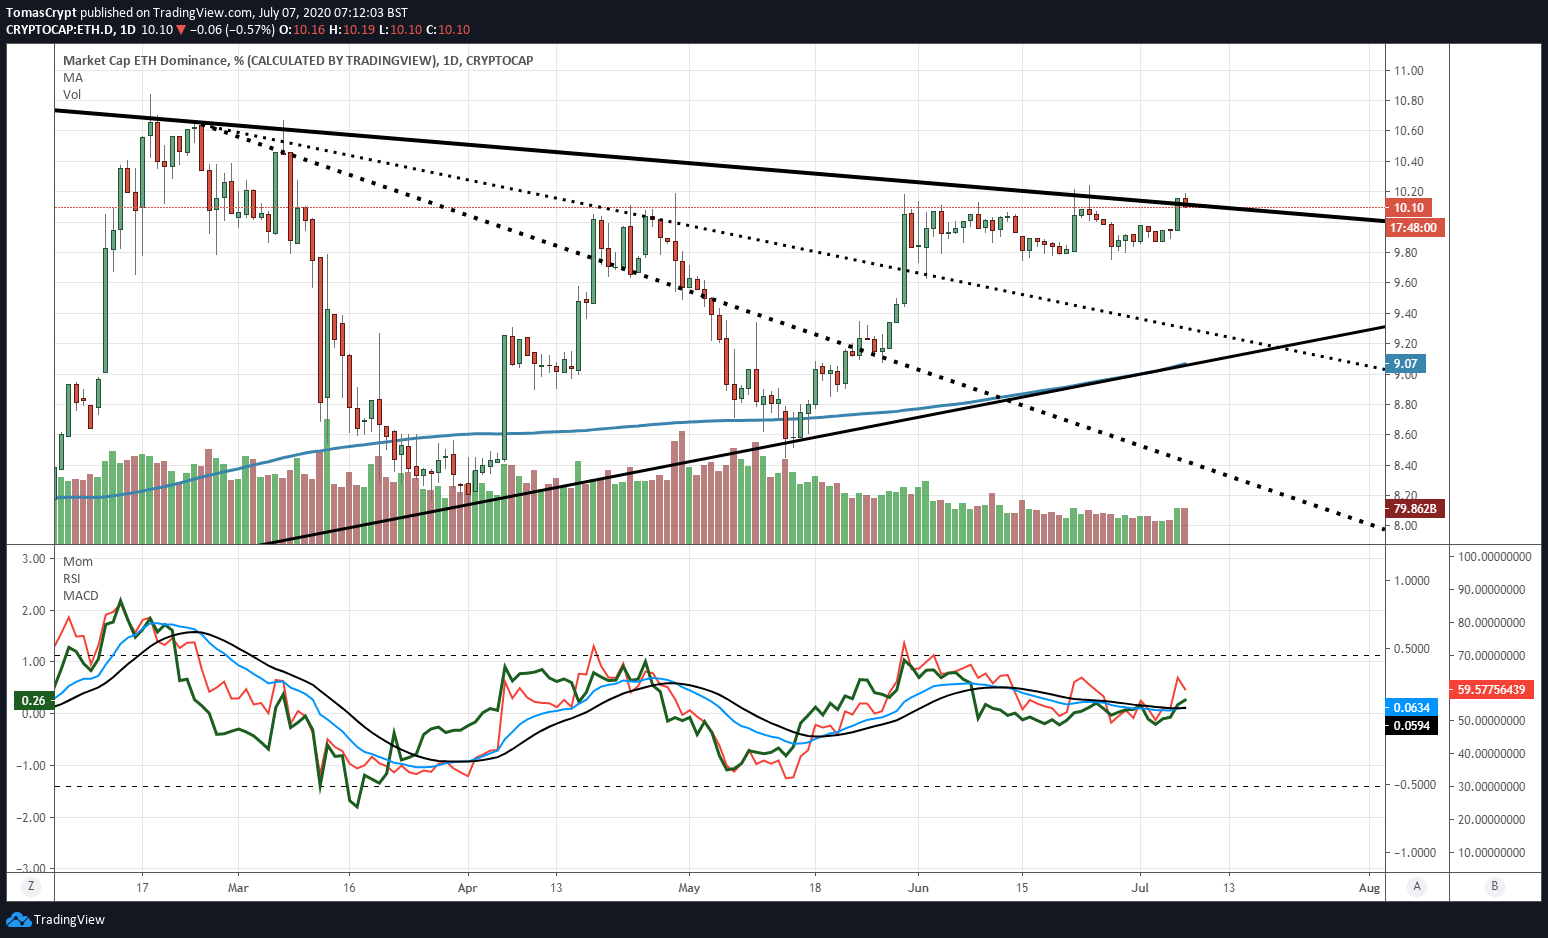
During the European session, the Ethereum dominance chart broke a major resistance and entered a new, potentially bullish scenario.
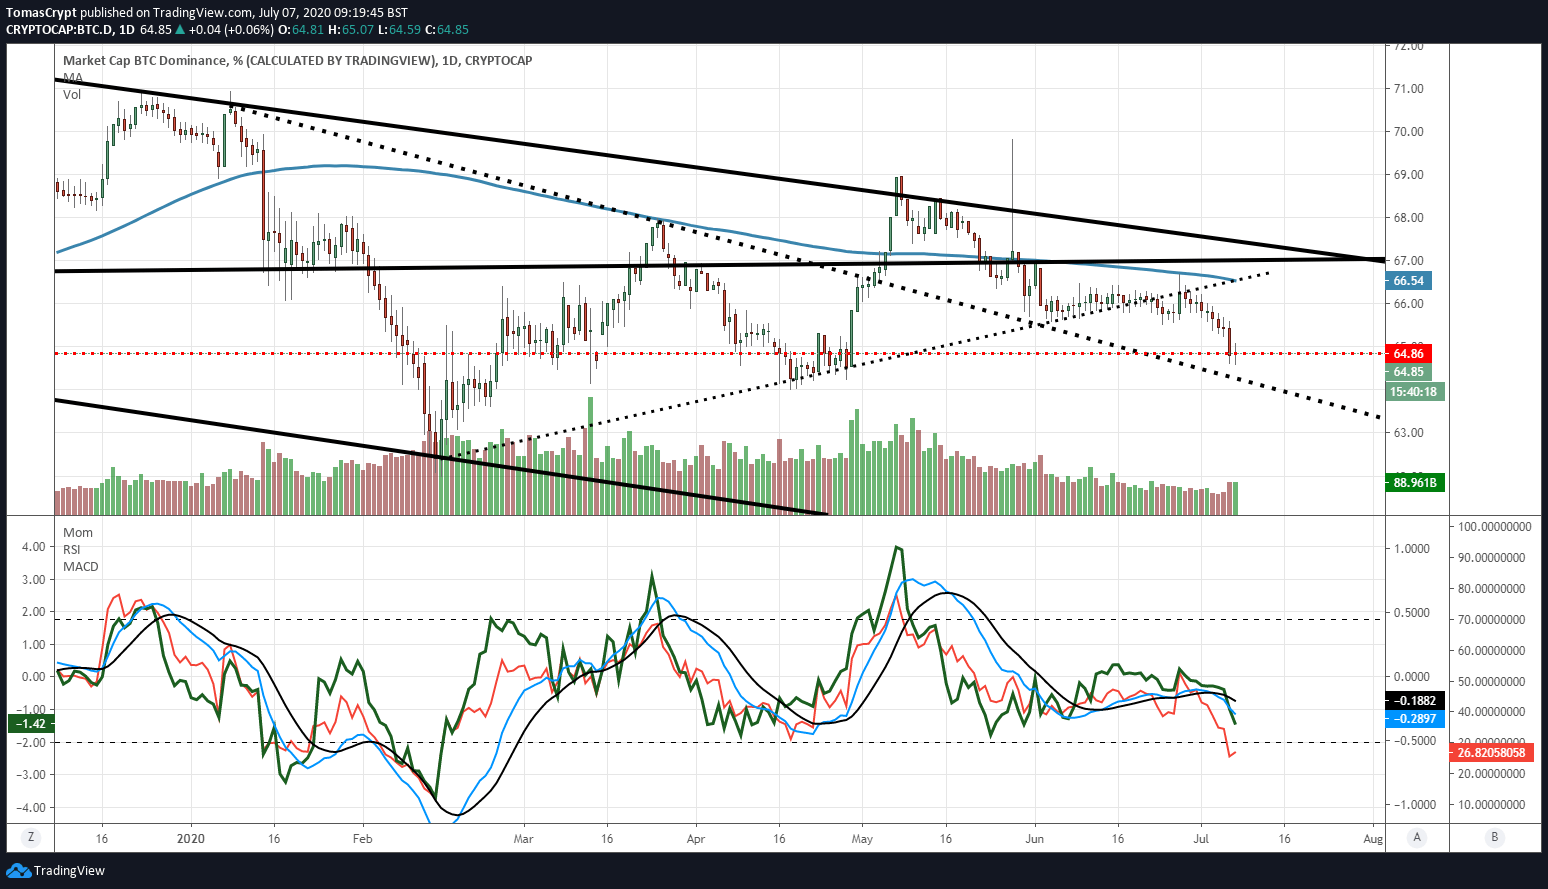
The achievement of Ethereum dragged the Altcoin segment upwards. At the same time, Bitcoin suffered to maintain its market share level and finally conceded the 65% market share level and reached a support zone of around 64.5%.
After the bullish storm for Altcoins, today it is time to prove if yesterday was a mirage or if we saw the expected sign of the beginning of a bullish market in the Altcoin segment.
The Ethereum's dominance chart shows weakness in the opening of the European market, and it moves threateningly below the resistance level conquered yesterday. A daily close below the 10.12% dominance level would be very dangerous for the short term.
In the technical analysis of the ETH/BTC pair, we see that Ethereum shows signs that the breakout could be successful.
Ripple was another major player on the day with substantial gains, gains that have not changed the critical technical situation of the XRP, as we will see in the particular analysis of the XRP/USD pair.
Despite Bitcoin's attempt to regain market share, technical indicators do not show a pattern of change in direction, which bodes well for further losses of dominance by Bitcoin. The next support level is at 64%, and from there it will move to the 62.5% level.

Yesterday's bullish reaction has lifted the spirits of crypto traders, and the sentiment indicator prepared by the alternative.me site goes up almost 10% to the 43 levels, still in the fear zone.
ETH/BTC Daily Chart
The ETH/BTC pair is currently trading at the price level of 0.02561 after reaching the critical resistance level of 0.026 yesterday due to price congestion.
The arrival of this resistance level affected the entire market. If the ETH/BTC pair manages to move above the 0.026 level, it will get far enough away from the 0.025 price attractor, and the rate of rising will increase.
Above the current price, the first resistance level is at 0.026, then the second at 0.0277 and the third one at 0.0296.
Below the current price, the first support level is at 0.0248, then the second at 0.0235 and the third one at 0.0226.
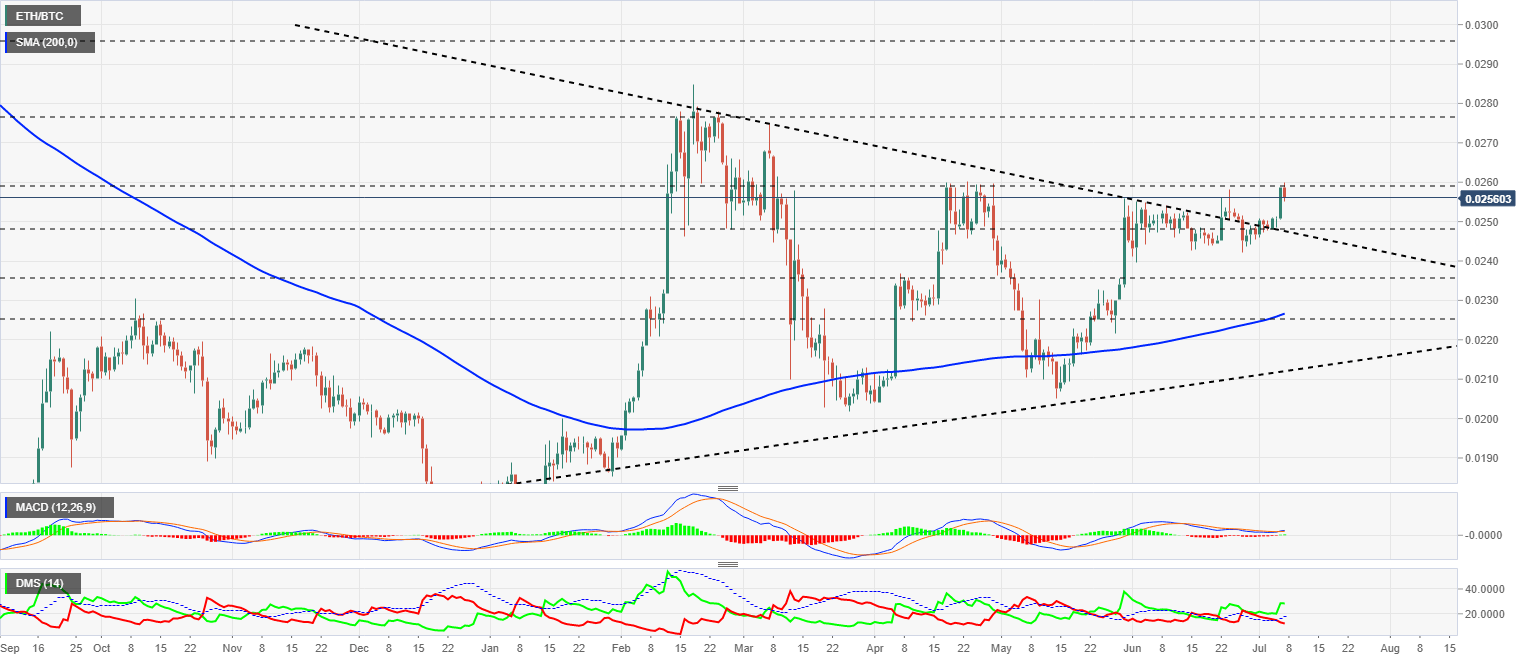
The MACD on the daily chart is crossing up, but lacks the tilt and open between the lines to validate the move.
The DMI on the daily chart shows the bulls controlling the pair after the bullish pattern was triggered yesterday after the bears lost support from the ADX line.
BTC/USD Daily Chart
The BTC/USD pair is currently trading at the price level of $9270 and is moving away from the bottom of the current scenario of the expansive triangle figure. The figure has its upper limit at $10500, a feasible target for the BTC/USD pair in the coming days.
Above the current price, the first resistance level is at $9500, then the second at $9650 and the third one at $10400.
Below the current price, the first support level is at $8750, then the second at $10450 and the third one at $11400.
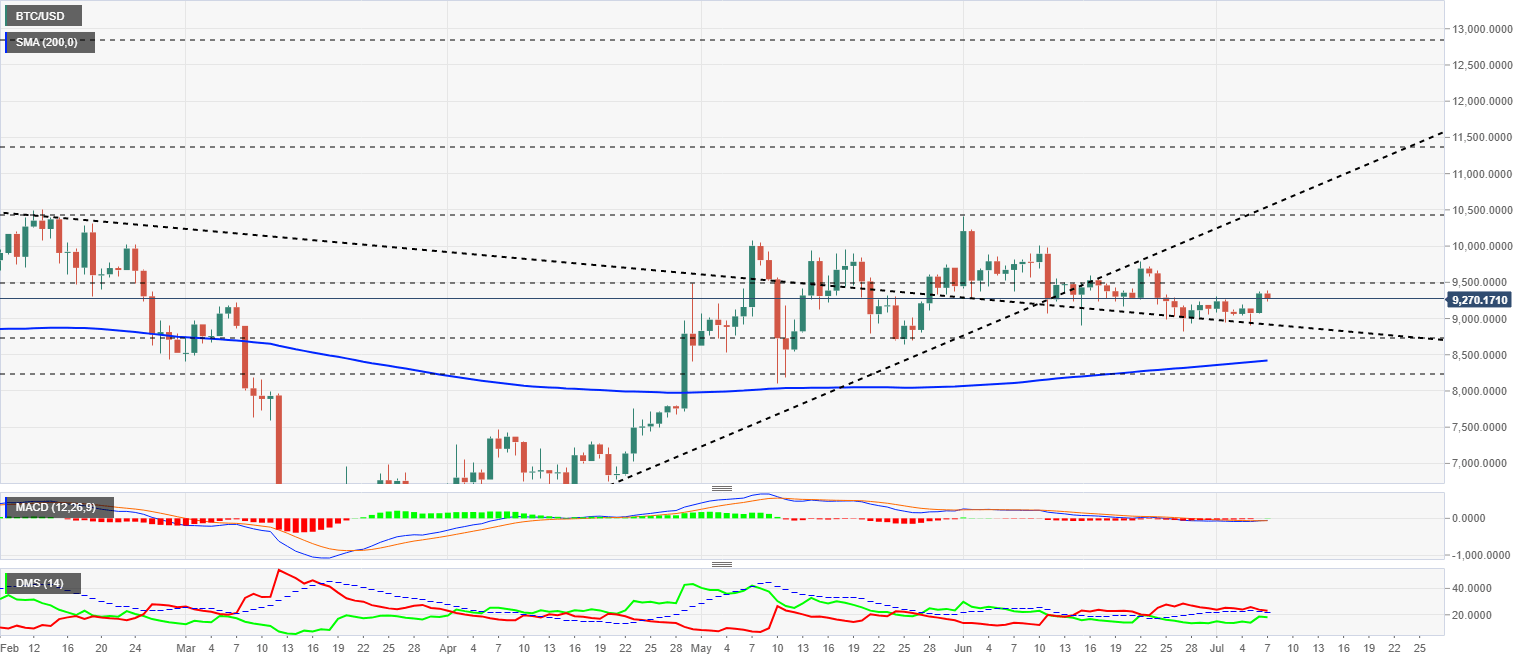
The MACD on the daily chart is crossing higher but is just below the zero levels of the indicator, which will limit the upward potential of the BTC/USD pair.
The DMI on the daily chart shows bears trying not to cross the ADX line downwards, while bulls are increasing their trend force in anticipation of the sell-side losing strength and the cancellation of the current bearish pattern.
ETH/USD Daily Chart
The ETH/USD pair is currently trading at the price level of $237.5 and is moving within a bullish flag structure with projection towards the $270 level, third technical resistance, with a 9.5% gain.
Above the current price, the first resistance level is at $244, then the second at $260 and the third one at $270.
Below the current price, the first support level is at $235, then the second at $222 and the third one at $215.
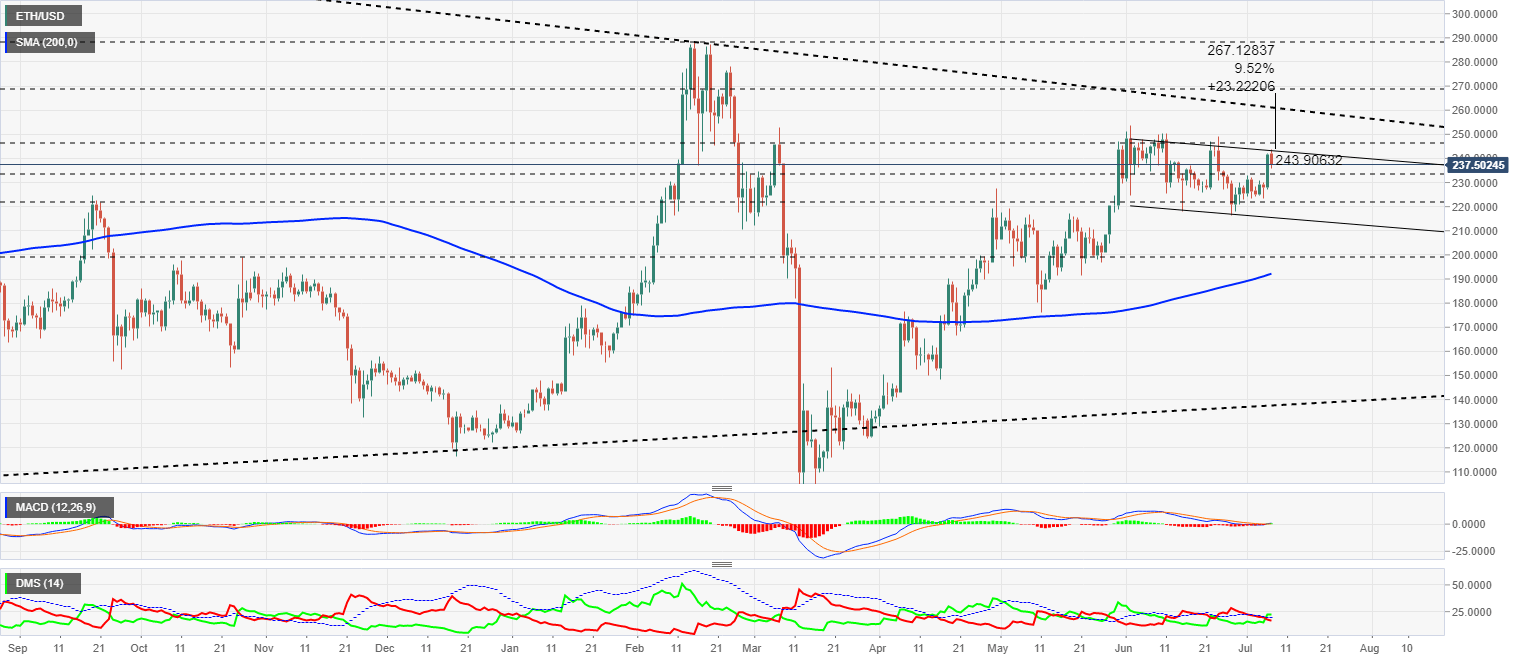
The MACD on the daily chart crosses just above the zero levels of the indicator, which significantly increases the chances of a successful reversal.
The DMI on the daily chart shows bulls taking the lead in the pair, while bears are losing support from the ADX line. The current structure triggers a medium-term bullish pattern.
XRP/USD Daily Chart
The XRP/USD pair is currently trading at $0.1856 after reaching yesterday's high of $0.19. Support is at $0.1835, from where it could try to break through key resistance at the $0.195 level.
Above the current price, the first resistance level is at $0.195, then the second at $0.201 and the third one at $0.209.
Below the current price, the first support level is at $0.1835, then the second at $0.163 and the third one at $0.14.
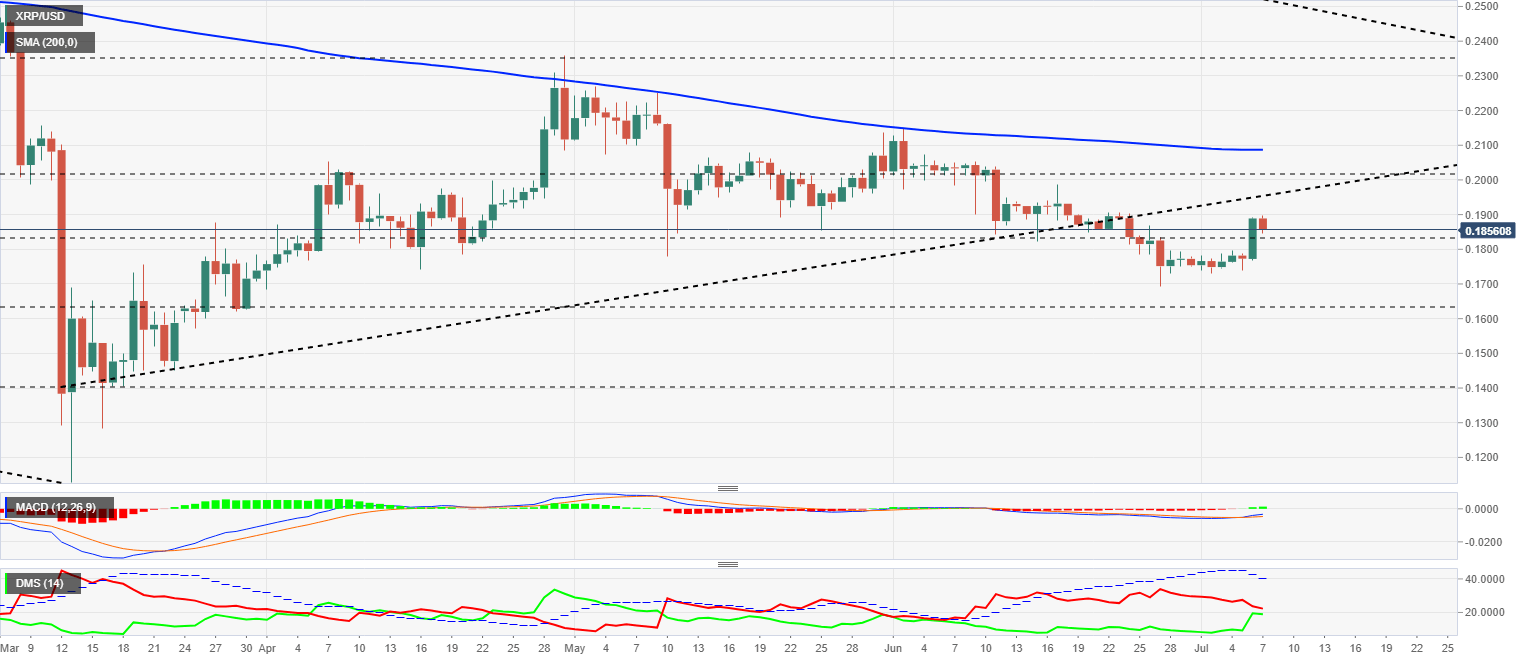
The MACD on the daily chart is crossing upwards, giving a small gap between the lines, which is very positive in the short term. The proximity of the indicator's zero levels as resistance will be a challenge for the bulls.
The DMI on the daily chart shows bears still leading the pair, although with a slight advantage over bulls that have increased their strength a lot.
Author

Tomas Salles
FXStreet
Tomàs Sallés was born in Barcelona in 1972, he is a certified technical analyst after having completing specialized courses in Spain and Switzerland. He expanded his technical training following the guidance of great experts on the financial markets.


