Top 3 Price Prediction Bitcoin, Ether, Ripple: Twitter weighs down on the crypto market
- Studies on the most frequently used topics show strong downward sentiment in the crypto segment.
- There are divergences between the price of the Top 3 and what is said in the social networks.
- The transition to the bullish area of the indicator continues.

The assets of the crypto Top 3 are keeping their cool after the falls at the end of last week.
The market sentiment remains very weak, mainly burdened by the more media-driven part of the crypto ecosystem.
For this analysis, I will use a new tool published by augmento.ai. The market sentiment indicator is at 0.316 – on a scale of 0 to 1, a mid-range within the market sentiment pessimism level.
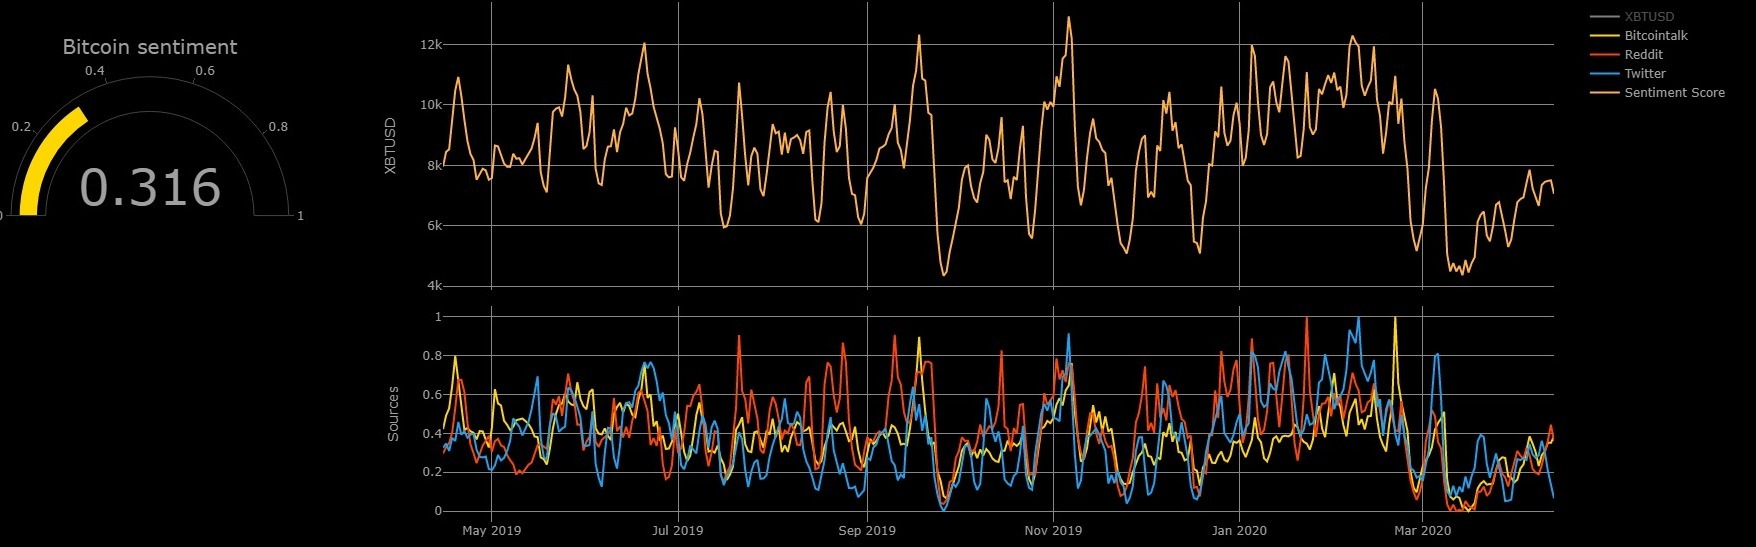
In the chart above, you can see that the feeling extracted from Twitter weighs down the other instruments that make up the index, Reddit and Bitcointalk.
These low sentiment levels contrast with prices that are in comfort zones, far from the levels seen throughout 2018 and 2019. The divergence is evident, and now all that remains is to know who is wrong.
ETH/BTC Daily Chart
The ETH/BTC pair is currently trading at the price level of 0.023, a positive range above the major moving averages and the psychological level of 0.0228. All three major averages are tilted higher, showing a bullish market background.
Above the current price, the first current resistance level is at 0.235, then the second at 0.0255 and the third one at 0.0268.
Below the current price, the first support level is at 0.0228, then the second at 0.022 and the third one at 0.0212.

The MACD on the daily chart shows the wear and tear caused by the transition to the bullish zone of this technical indicator. The most likely development is lateral with a tendency to test close support.
The DMI on the daily chart shows a situation of absolute uncertainty. Both sides of the market have options to get ahead of the market, although the presence of the ADX line just above it will not make it easy for either bears or bulls.
BTC/USD Daily Chart
The BTC/USD pair is currently trading at the price level of $6811 and continues to be below the long-term bearish channel ceiling. The price target for a return to the bullish scenario is at the $8220 price level, but to reach it, you have first to overcome a strong confluence of technical resistance at the $7200 level.
As we can see in FXStreet's proprietary tool, the Technical Confluence Indicator, in the daily range it's clear how in the resistance level of $7200 we find the 38.2% and 61.8% barriers of the Fibonacci retracement system in the weekly timeframe.
Above the current price, the first resistance level is at $7150, then the second at $7400 and the third one at $7750.
Below the current price, the first support level is at $6550, then the second at $6380 and the third one at $6200.

The MACD on the daily chart is losing momentum as it transitions into the bullish zone. The most likely development is upward sideways while the structure is setting itself back upward.
The DMI on the daily chart shows how the bulls and bears are fighting to lead the BTC/USD pair.
ETH/USD Daily Chart
The ETH/USD pair is currently trading at the $157 price level and remains in a narrow range for the fourth consecutive day. The main moving averages show a flat profile although the SMA100 maintains its upward slope.
The Technical Confluences Indicator shows how there is a confluence of significant technical resistance at the $160 price level.
Above the current price, the first resistance level is at $161, then the second at $163 and the third one at $170.

The MACD on the daily chart shows how the transition to the indicator's bullish zone has worn off the bullish momentum. The most likely development is upward sideways while setting up for further upward movement.
The DMI on the daily chart shows, again, a tie between the two sides of the market. In the case of the ETH/USD pair, the presence of the ADX line adds to the downward pressure and could lead to price volatility.
XRP/USD Daily Chart
The XRP/USD pair is currently trading at the price level of $0.185 and is moving away from the EMA50 and the price congestion resistance at $0.19.
The main moving averages maintain the downward slope. The 50-day Exponential Moving Average, which yesterday seemed to want to move higher, today reacts in the opposite direction.
The Technical Confluence Indicator shows a significant support level at $0.175, while the main technical resistance level is at the price level of $0.1950.
Above the current price, the first resistance level is at $0.191, then the second at $0.20 and the third one at $0.217.
Below the current price, the first support level is at $0.174, then the second at $0.15 and the third one at $0.14.

The DMI on the daily chart shows that the two sides of the market are in full swing.
Get 24/7 Crypto updates in our social media channels: Give us a follow at @FXSCrypto and our FXStreet Crypto Trading Telegram channel
Author

Tomas Salles
FXStreet
Tomàs Sallés was born in Barcelona in 1972, he is a certified technical analyst after having completing specialized courses in Spain and Switzerland.


