Top 3 Price Prediction Bitcoin, Ether, Ripple: Fresh bullish attempt pointing to the moon
- Bitcoin moves strongly upwards and confirms the pattern drawn on Monday.
- Ether is stagnant for now, although the dominance charts support the rise of the ETH/USD pair.
- XRP may need more time to keep up with the leaders.

In yesterday's article, I announced the formation of the same technical pattern in the crypto market Top 3 charts.
Today, the markets have reactivated the bullish movements and have drawn the same bullish pattern that we drew on Monday.
The Bitcoin dominance chart shows a retest of the trendline pierced in February; the process of dominance's lost can start again.
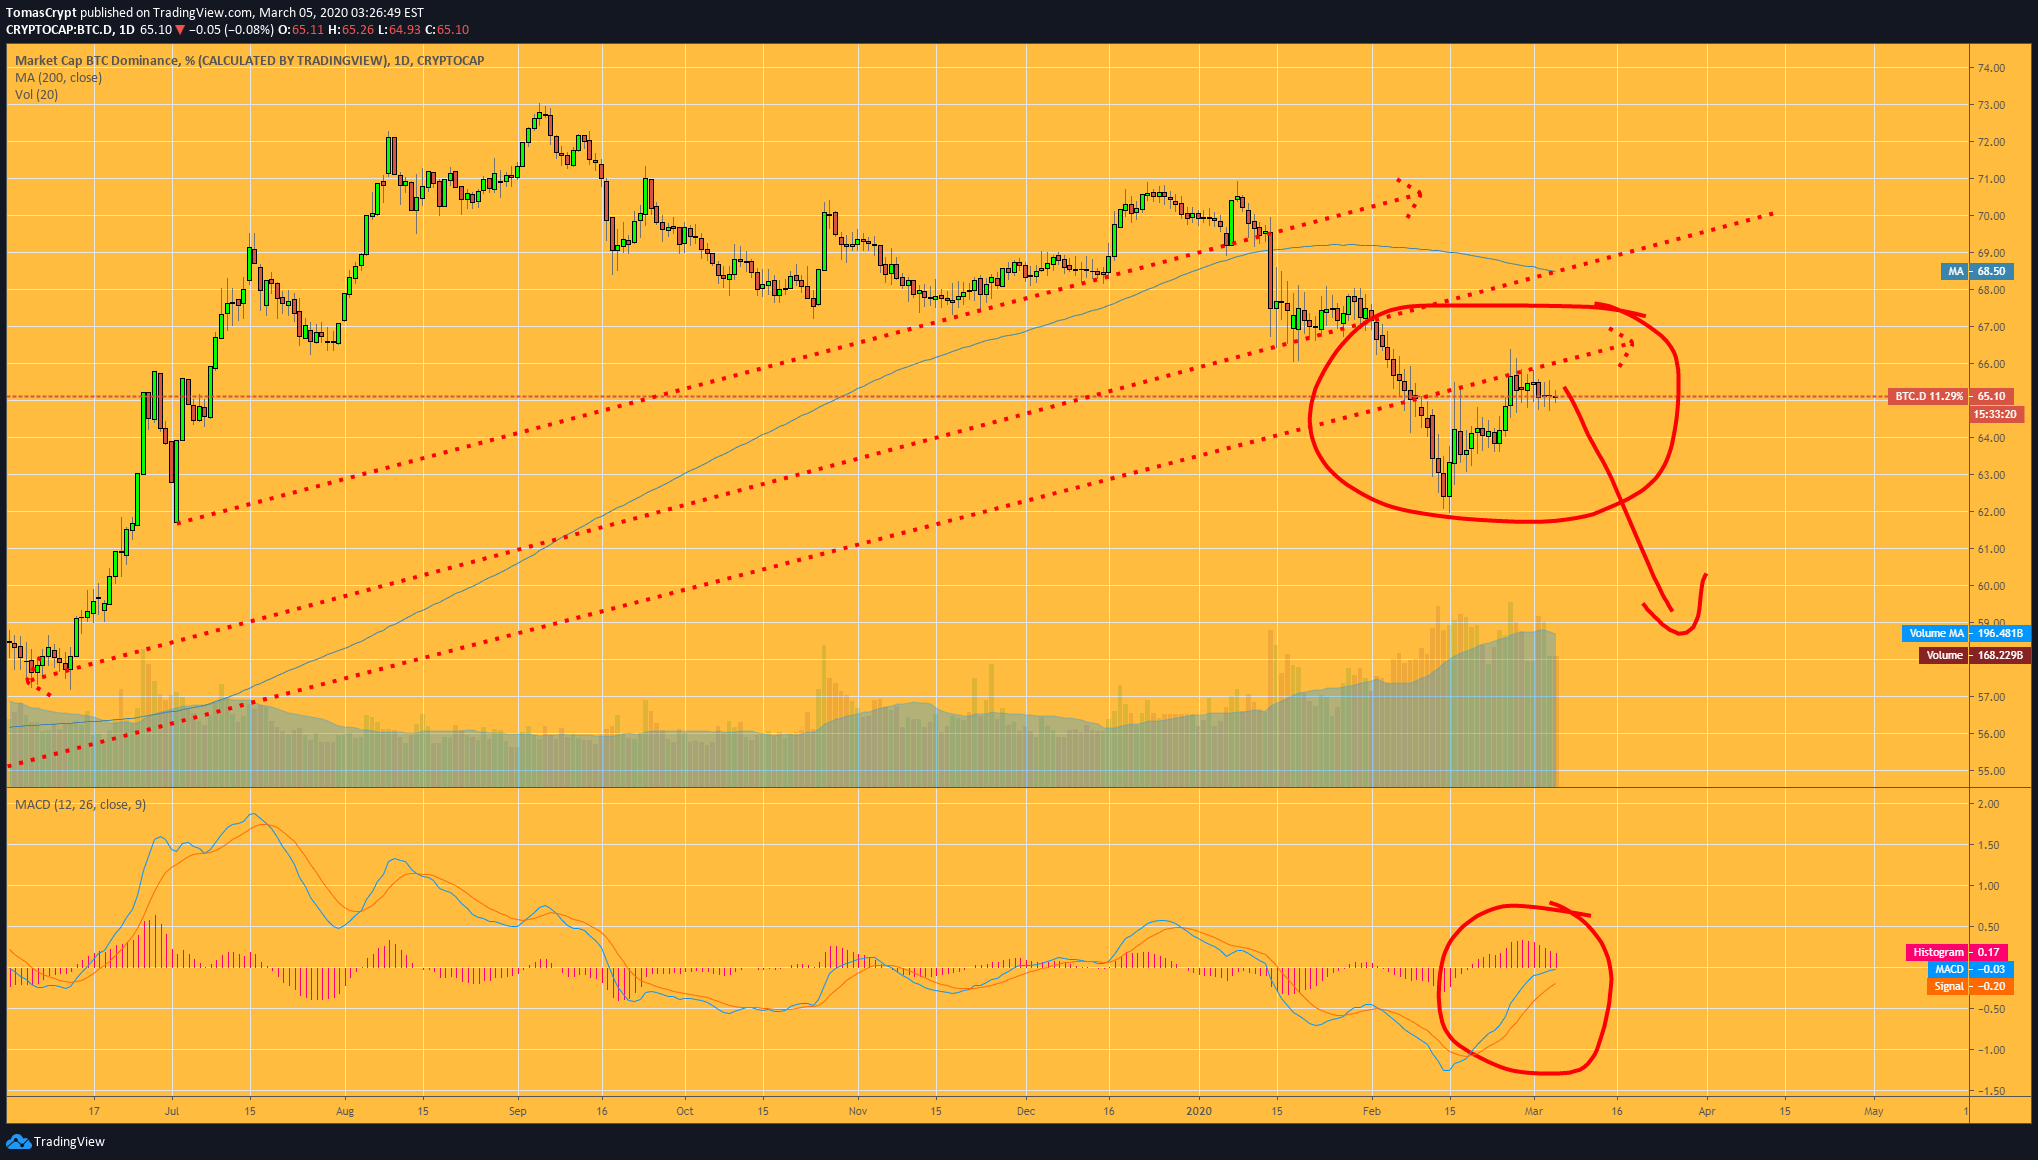
Another detail to keep in mind is the position of the MACD in the chart. Once it reaches the neutral level of the indicator, it loses strength and signals the end of the recovery.
ETH/BTC Daily Chart
ETH/BTC is currently trading at 0.024 and is continuing the price compression process. This type of behaviour is typical of situations leading to bursts of volatility.
Above the current price, the first resistance level is at 0.0268, then the second at 0.0275 and the third one at 0.029.
Below the current price, the first support level is at 0.025, then the second at 0.0238 and the third one at 0.023.

The DMI on the daily chart continues to be in absolute balance between the two sides of the market. In the short term, the first side of the order book, be it bulls or bears, will lead the way.
BTC/USD Daily Chart
BTC/USD is currently trading at the price level of $9071 and is attempting to break through the $9000 level, which would return the market to its upward momentum.
Above the current price, the first resistance level is at $9125, then the second at $9600 and the third one at $10375.
Below the current price, the first support level is at $8800, then the second at $8710 and the third one at $8525.

The DMI on the daily chart shows the bulls gaining on the bullish side, contrary to the bearish side of the bearish trend. The meeting between the two sides of the market will take place in the next few hours.
ETH/USD Daily Chart
ETH/USD is currently trading at $229.7 and retains the bullish pattern drawn last Monday.
Above the current price, the first resistance level is at $230, then the second at $235 and the third one at $250.
Below the current price, the first support level is at $224, then the second at $217 and the third one at $215.

The DMI on the daily chart shows that the bullish trend is still in full swing. The visibility is zero.
XRP/USD Daily Chart
XRP/USD is currently trading at the price level of $0.239 and is drawing today the bullish trend figure that the Bitcoin and Ether drew on Monday.
Above the current price, the first resistance level is at $0.253, then the second at $0.27 and the third one at $0.283.
Below the current price, the first support level is at $0.235, then the second at $0.233 and the third one at $0.22.

The MACD on the daily chart completes the change in direction and is now pointing upwards at its fastest moving average. The MACD on the daily chart completes the shift in direction and is now pointing upwards on its fastest moving average.
The DMI on the daily chart shows bulls and bears close, a situation that has been dragging on for several days now – low visibility in the short term.
Get 24/7 Crypto updates in our social media channels: Give us a follow at @FXSCrypto and our FXStreet Crypto Trading Telegram channel
Author

Tomas Salles
FXStreet
Tomàs Sallés was born in Barcelona in 1972, he is a certified technical analyst after having completing specialized courses in Spain and Switzerland.


