Top 3 Price Prediction Bitcoin, Ether, Ripple: Crypto market shifting to the hyperspace
- The typical pattern expects the participation of second-line Altcoins, such as Litecoin or Ethereum Classic.
- The current phase can cause occasional periods with a strong increase in volatility.
- The bulls have the advantage over the bears, but they don't yet have market control.

As expected, the market slows down by reaching, according to indicators, transition zones between bear and bull territories.
The cryptocurrency segment has, like all sectors, its peculiarities.
At the moment, more or less, the standard guidelines are being fulfilled, as it is in the turns Bitcoin and Ethereum are taking to move the market upwards.
At this point in recent history, it is the Altcoins of the second line that should take the lead. I am referring to Ethereum Classic, EOS or Litecoin. At the moment, although there have been improvements in the prices of these crypto-assets, they are still not exploding upwards.
LTC/USD Daily Chart
In the analysis of the LTC/USD pair, we see that it is still trading at an earlier stage than the market leaders.
The BTC/USD, ETH/USD and XRP/USD pairs have managed to break out of the 50-day exponential average this week, the LTC/USD pair has not, and may not have external support from the Top 3.
The price congestion resistance level at the $50 (A) price level adds to the difficulty in advancing the LTC/USD. The moving average position leaves this critical resistance level at a strategic point between the EMA50 and the SMA100 and SMA200.
-637220225261949379.png)
The MACD on the daily chart is just below the 0 level, which separates bear territory from the bear territory. So here's another point that adds complexity to the bullish move.
The DMI on the daily chart confirms that the bulls have an advantage in the LTC/USD pair, but not the control because they remain below the ADX line. Also, on the side of the trend forces, there are obstacles for price increases.
ETH/BTC Daily Chart
The ETH/BTC pair is currently trading at the price level of 0.02343 as it attempts to build up momentum above its recent high of 0.02368.
Above the current price, the first resistance level is at 0.0255, then the second at 0.0268 and the third one at 0.0275.
Below the current price, the first support level is at 0.0228, then the second at 0.0221 and the third one at 0.0224

The DMI on the daily chart shows how bulls outperform bears and have the option to take full control of the pair if they manage to breach the ADX line.
BTC/USD Daily Chart
The BTC/USD pair is currently trading at the price level of $7322 while it appears to be struggling to overcome the price congestion resistance at $7400.
Above the current price, the first resistance level is at $7600, then the second at $7850 and the third one at $8150.
Below the current price, the first support level is at $7250, then the second at $6850 and the third one at $6500.

The DMI on the daily chart shows how the bulls have not taken advantage of the upward movement and maintain a very smooth profile.
ETH/USD Daily Chart
The ETH/USD pair is trading at the $171.4 price level in a significant attempt to break out of the SMA200.
Above the current price, the first resistance level is at $173, then the second at $180 and the third one at $190.
Below the current price, the first support level is at $170, then the second at $162 and the third one at $155.
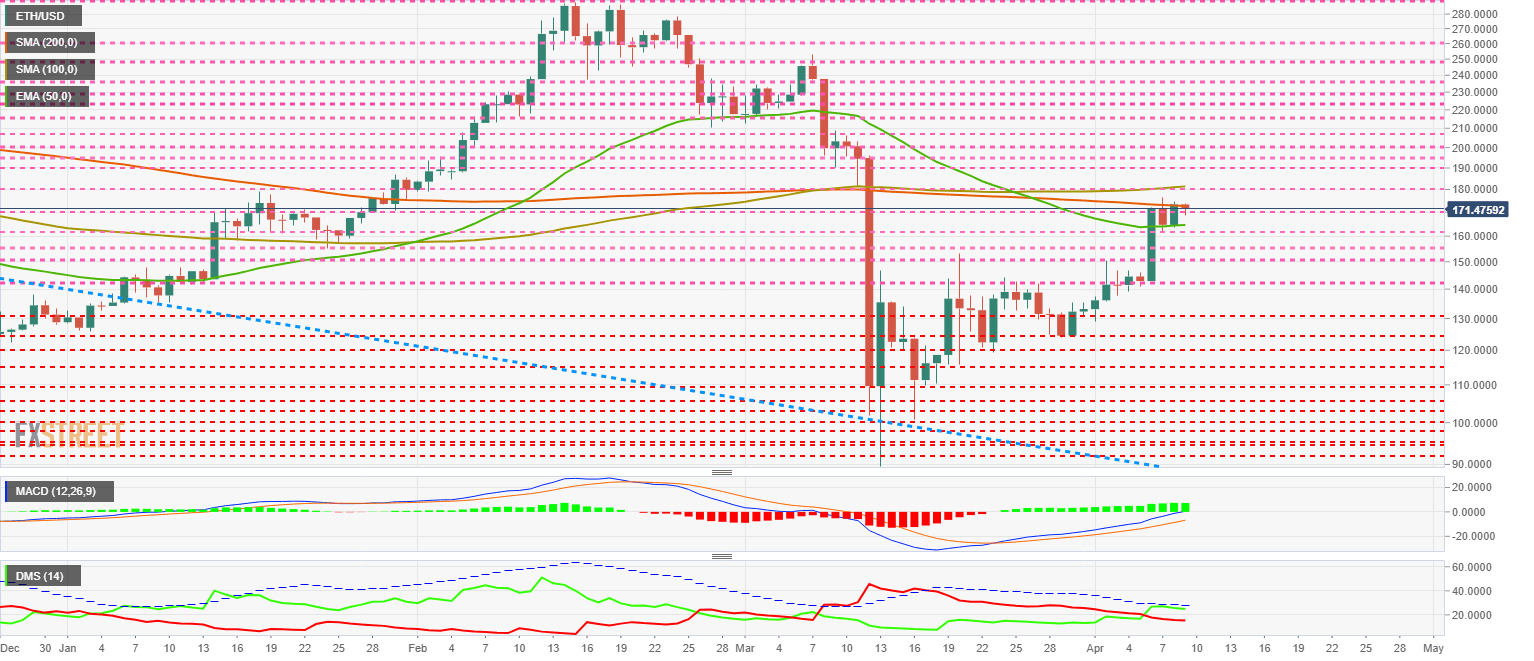
The DMI on the daily chart shows that bulls have an advantage over the bears, but need to break the ADX line to take control of the ETH/USD pair.
XRP/USD Daily Chart
The XRP/USD pair is currently trading at the price level of $0.1993 and is suffering from price congestion support at $0.20.
Above the current price, the first resistance level is at $0.218, then the second at $0.223 and the third one at $0.24.
Below the current price, the first level of support is at $0.195, then the second at $0.19 and the third one at $0.178.

The DMI on the daily chart shows that the bulls have managed to break through the ADX line and gain control of the pair, although they have not yet managed to move upward and lead the movement.
Get 24/7 Crypto updates in our social media channels: Give us a follow at @FXSCrypto and our FXStreet Crypto Trading Telegram channel
Author

Tomas Salles
FXStreet
Tomàs Sallés was born in Barcelona in 1972, he is a certified technical analyst after having completing specialized courses in Spain and Switzerland.


