Top 3 Price Analysis Bitcoin, Ethereum, Ripple: Price compression brings the false sense of calmness to the limit
- BTC/USD gravitates below the averages and plays with the limits.
- ETH/USD presents a more positive aspect and has a shot to conquer the leadership.
- XRP/USD is in the last phase of consolidation, at the limit of dangerous levels.

Shocking words that can be read on the net today, "Explosion", "Implosion", "Collapse". Words too extreme for a market in a pause that hardly indicates that such a plunge could happen in the following hours.
The trading volume is at a minimum, and that triggers speculations about which direction the money will take when it decides to move again, whether it will be inward or on the escape path.
It is perhaps time to point out that the Crypto market lacks some tools that are used in other markets and that precisely seek to avoid these alarming decreases in volume. For example, the Crypto market does not have a competition between ECNs for being the one that offers the best liquidity, nor does it have as a consequence, Market Makers providing liquidity and positions to the ECN that best rewards it.
In the case of the Crypto market, each exchange will have its own mechanisms to maintain the liquidity of its platform, but it has little to do with the size, efficiency, and experience that BAT, ARCA or INSTINET may have.
Without the help of these financial structures, many equity markets would see sharp drops in liquidity and differences between supply and demand that are difficult to trade.
We have to accept the market as it is, at least until financial regulators turn it into something different, neither better nor worse.
Do you want to know more about my technical setup?
BTC/USD 240-Min.
The BTC/USD is currently trading at the $6,485 price level after the expected falls already expected yesterday. The price gravitates around the powerful moving averages waiting for an event that provides enough energy to escape. The BTC/USD has pierced the bullish trend line originating in the lows of the first week of September but manages to recover and for now remains above.
Below the current price, the first support to watch is the trend commented in the previous paragraph and that currently passes through the price level of $6,478. Losing this level could take the BTC/USD to a lower support zone of $6,370 as an intermediate step towards the base of the range at $6,200 (support for price congestion).
Above the current price, the first immediate commitment at the price level of $6,490 (SMA200). Exceeding it would provide a margin and possibly prevent this long-term average from targeting lower levels that would weaken the overall structure. The second resistance level at $6,550 (SMA100) and the third at $6,557 (EMA50) converge with a resistance level at $6,560 (price congestion resistance) and make this price zone the level to beat.
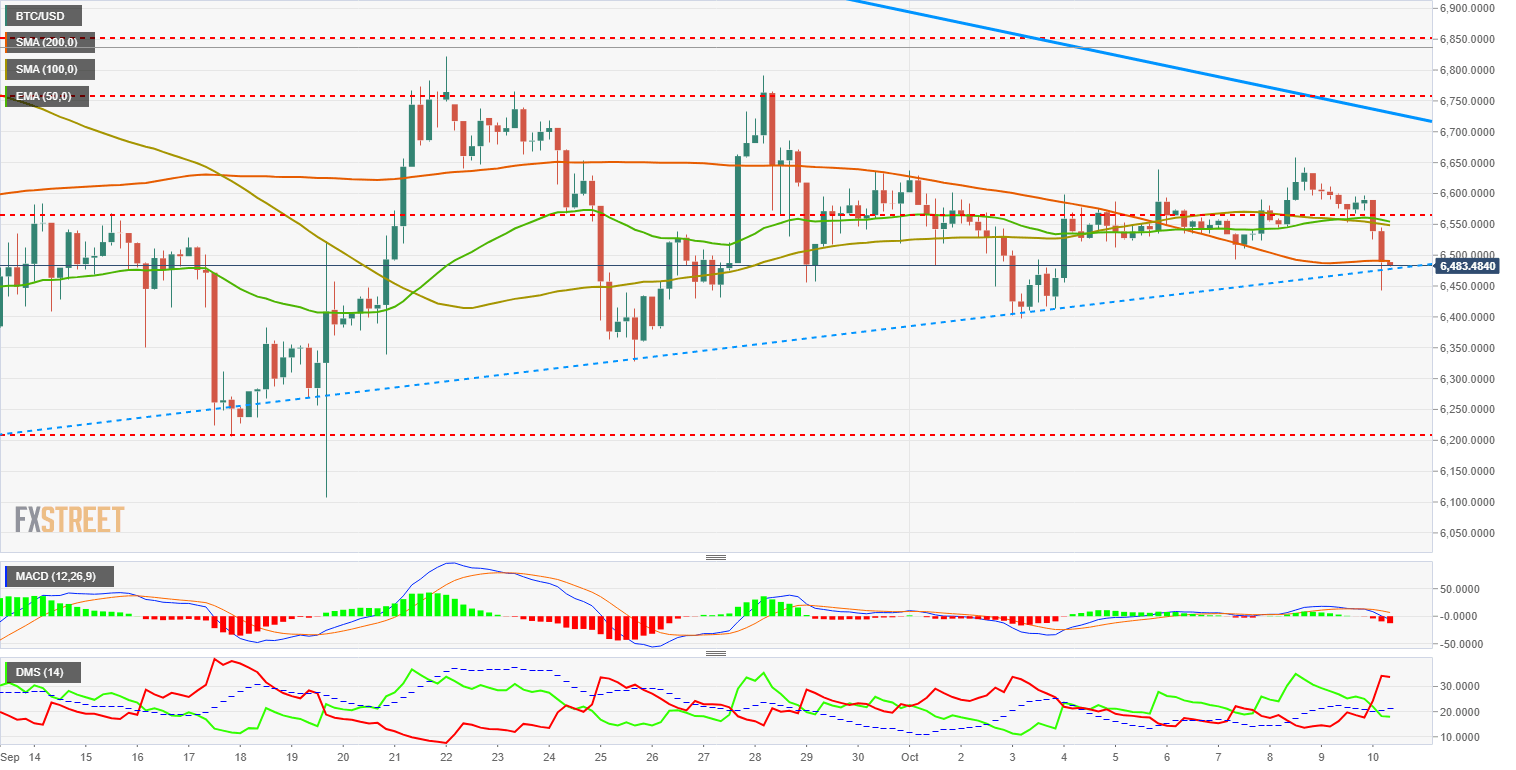
The MACD at 240-Min clearly represents the downward turn. The lines show good openness and inclination. The trajectory is ambiguous since it is possible both an upturn above the zero line and a deepening of the falls.
The DMI at 240-Min shows us how the bears have reacted quite forcefully and become in a dominant position. On the other hand, the bulls allow themselves to be carried away and are removed below the line of 20 and the ADX. This indicates that the weakness may have a certain route ahead.
ETH/USD 240-Min.
The ETH/USD is currently quoted at the $224 price level. It has lost the SMA100 and the EMA50 in the fall but retains quite a bit of margin up to the price level the SMA200 goes through. The structure is technically more positive than the Bitcoin although it also puts at risk a trendline that has driven the price since early September.
Below the current price, the first level of support on the trendline quoted in the previous paragraph at the price level of $222. Below this support, there could be an extension up to the level of the SMA200 at $217, where it should be stopped to avoid greater evils. Otherwise, third level support at the base of the channel at $200.
Above the current price, the ETH/USD has it really easy if fresh money appears. First resistance level in the price level between $224 (SMA100) and $225 (EMA50). Above this level, the technical figure would break up and soar to the next resistance found in the distant $270 (price congestion resistance). At this point, it is very likely that the Ethereum would assume its necessary leadership role in bull markets.
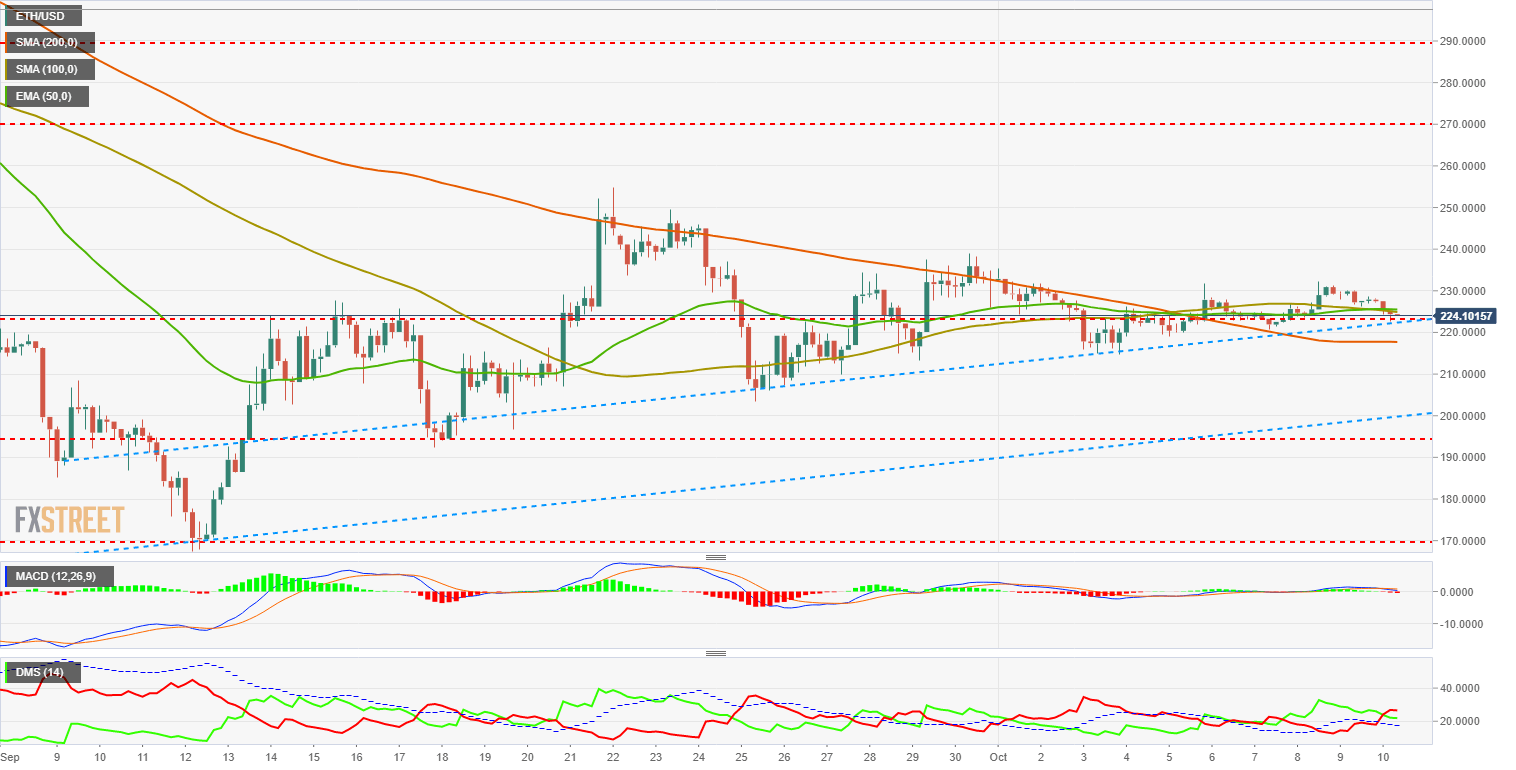
The MACD at 240-Min is shown cut down, with little inclination and a good distance between lines. It stays above the zero line, so it can be relatively easy to find support.
The DMI at 240-Min shows us the bears with control of the situation but in dispute with bulls that do not retreat and remain above level 20. The ADX decreases and does not follow the fall of the last hours.
XRP/USD 240-Min.
The XRP/USD continues to develop a retracement pattern that has brought it back to the bullish trend line that governs the price and also to the base of the bearish channel. It is currently traded at the $0.466 price level. The technical aspect of the XRP/USD supports price weakness in the next sessions.
Below the current price, the XRP/USD has a first support at the price level of $0.46. The above-mentioned trend and also the base of the channel pass through this level. Below this important support, the next one is at $0.442 (price congestion support). As the third level of support, the confluence of the SMA200 and a price congestion level of $0.43.
Above the current price, first resistance at the price level of $0.498 (EMA50), followed immediately by the second resistance at $0.505 (price congestion resistance). As the third resistance level, the SMA100 currently passes through the $0.522 price level.
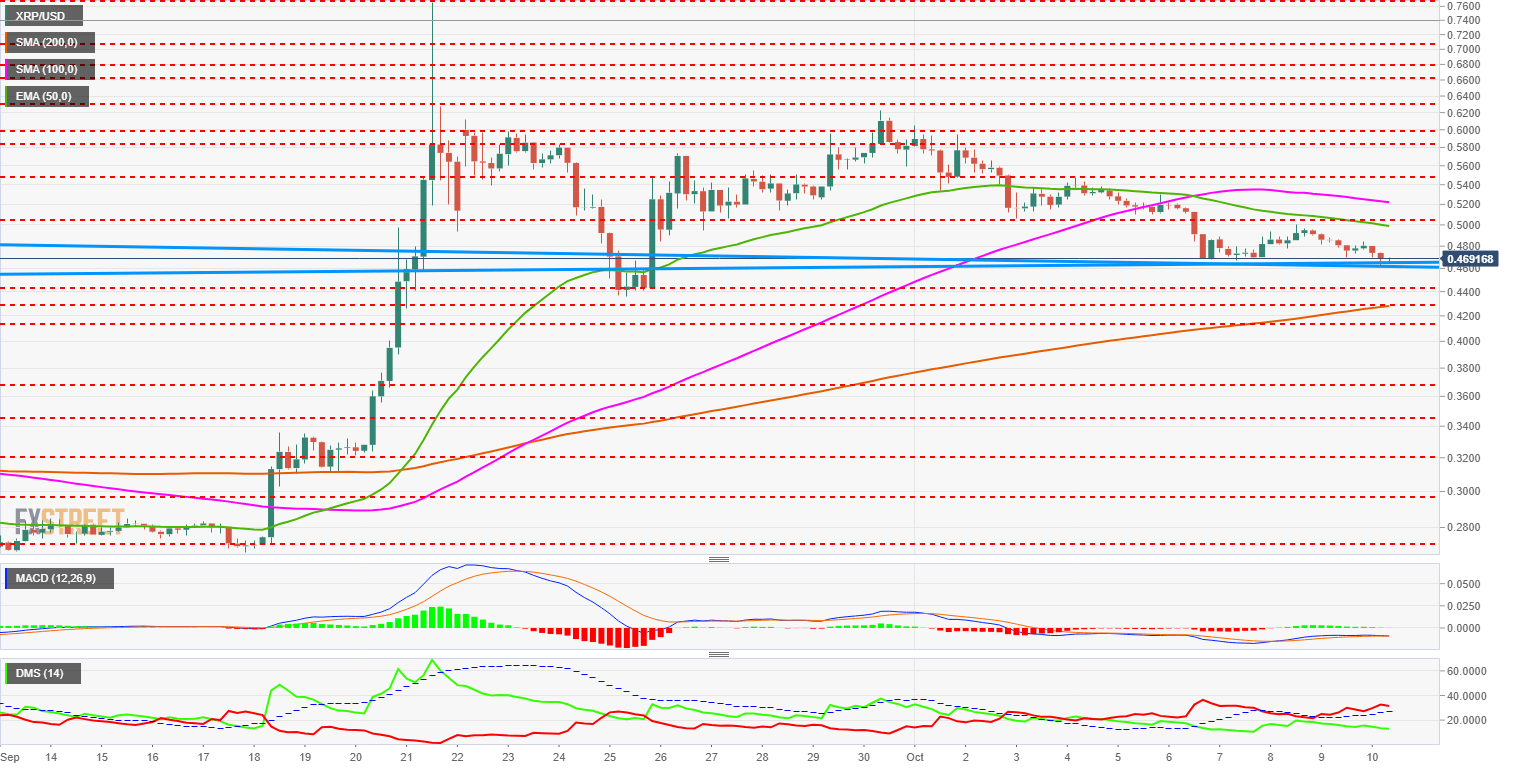
The MACD at 240-Min is shown very horizontal and moving below the zero line of the indicator. The drawing is divergent with the price but not so the situation of the averages.
The DMI at 240-Min shows the bears gradually increasing their dominance, following a rhythm similar to that of the bulls but in the opposite direction. The ADX accelerates with the last falls and brings inertia to the asset.
Get 24/7 Crypto updates in our social media channels: Give us a follow at @FXSCrypto and our FXStreet Crypto Trading Telegram channel
Author

Tomas Salles
FXStreet
Tomàs Sallés was born in Barcelona in 1972, he is a certified technical analyst after having completing specialized courses in Spain and Switzerland. He expanded his technical training following the guidance of great experts on the financial markets.


