Top 3 Price Analysis Bitcoin, Ethereum, Ripple: Match-Ball for the Ether to take over from Bitcoin
- BTC/USD remains strong in its zone but shows no interest in leaving it.
- ETH/USD can be on the doorstep of a great performance that leads the market upwards.
- Falls are being seen as opportunities in the XRP/USD.

A new day in the Crypto market where the various comments on the key situation that is taking place at the moment stand out. After many sessions of decreasing volatility and growing boredom, yesterday there were movements that could crystallize into bullish ruptures in the coming hours.
As my bullish scenario needs the Ethereum to start doing better than the Bitcoin, the first thing I do today is to see what the ETH/BTC chart tells me.
As we can see, at the moment there is an early upward break. It's still not strong enough to validate the signal and would be grateful for a bit of forcefulness to certify the moment. The pair would not go into bullish mode until it exceeds the price level of 0.037 ETH/BTC and has as its primary objective 0.047 ETH/BTC.
-636746801423082663.png)
From this graph, I extract a possible scenario of increases in the whole Crypto market until the primary objective is reached. From that point on, if it occurs, we will have to analyze the whole situation again.
Do you want to know more about my technical setup?
BTC/USD 240-Min.
The BTC/USD is currently trading at the price level of $6,591, which is above the moving averages. The hope for the bulls is that this time the price stops at the strong first support and we can see a change of pace in the BTC/USD.
Above the current price, the first resistance is at the price level of $6,791 (price congestion resistance and relative maximum zone). Next resistance level at $6,850 (price congestion resistance) where the BTC/USD would be at the gates of the long-term bearish trend line at the price level of $6,950.
Below the current price, the main news is the presence of moving averages already commented. A very strong first support in the price level of $6,558 (EMA50, SMA100, and support for price congestion). In principle, the price should stop here, but we could see an extension up to the SMA200 level at $6,487. Losing this second support level would make possible a much larger drop to the price level of $6,200 (price congestion support).
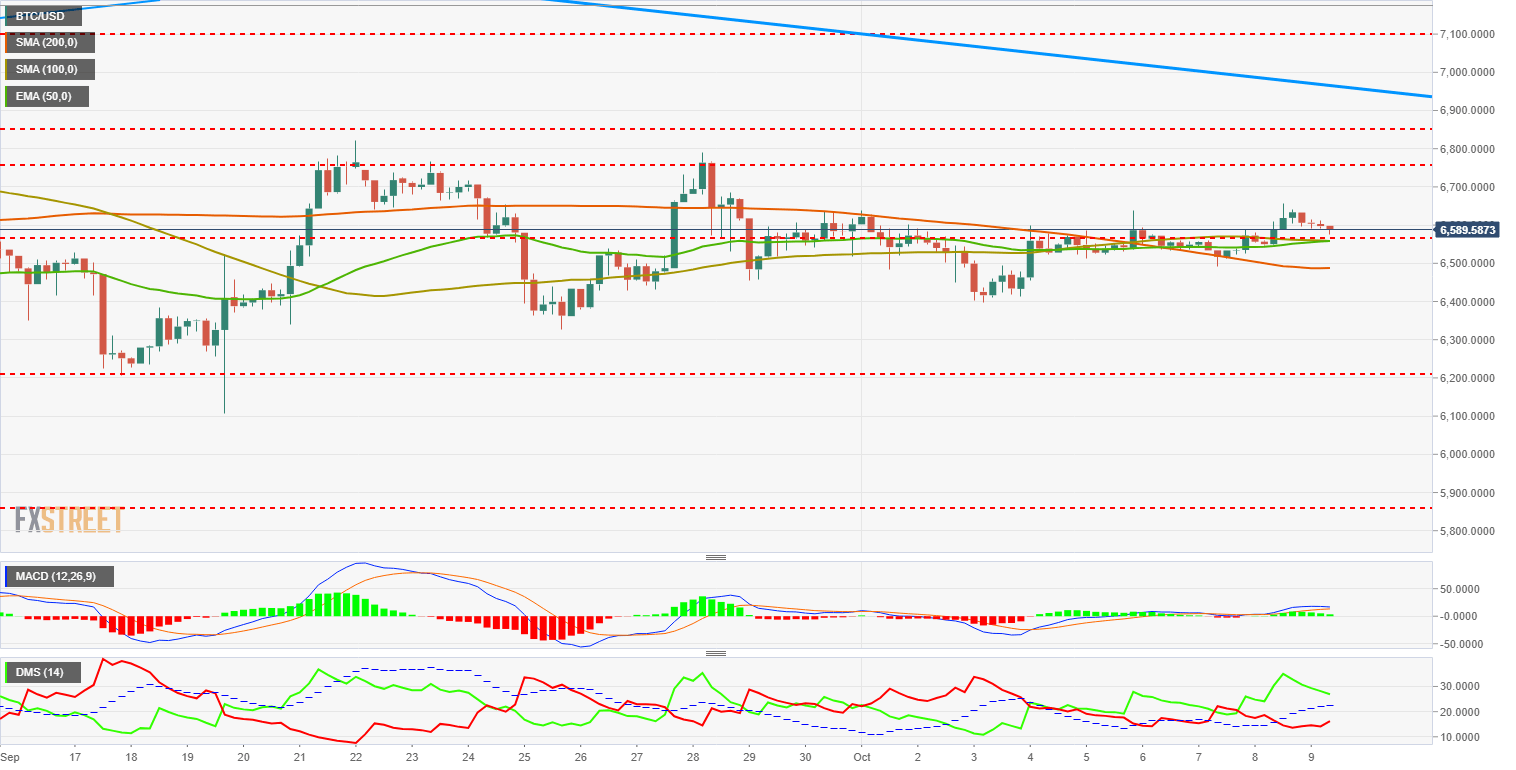
The MACD at 240-Min describes quite well what happened yesterday when thanks to the bullish movement the lines were able to open and gain height from the zero line. For today the profile has been flattened again although it does maintain some opening between lines. The profile is compatible with a lateral movement as well as with a new upward stretch.
The DMI at 240-Min shows us the bulls with control of the situation but who have lost momentum in recent hours. The momentum lost to the rise has been picked up by the bears, who react timidly to the rise.
ETH/USD 240-Min.
The ETH/USD is currently trading at the $228.5 price level. It is also above moving averages. These moving averages are more concentrated than the BTC/USD, so support can be even stronger.
Above the current price, the ETH/USD has a large free space and should have it easy enough to reach the next resistance at $270. For me, the definitive signal of a major bullish stretch would be for the ETH/USD to consolidate this level. Then, next resistance at $290 (price congestion resistance) and finally at $305 (price congestion resistance).
Below the current price, the ETH/USD has a large support zone between $226 and $217. In that price range are the EMA50, the SMA100, the SMA200, and a price congestion support. It is very difficult for the Ethereum to lose this support. If it does, in addition to giving a very strong sign of weakness, it would start its way to the second level of support at $195 (price congestion support). Third support at $170 relative minimum level and last frontier before free fall.
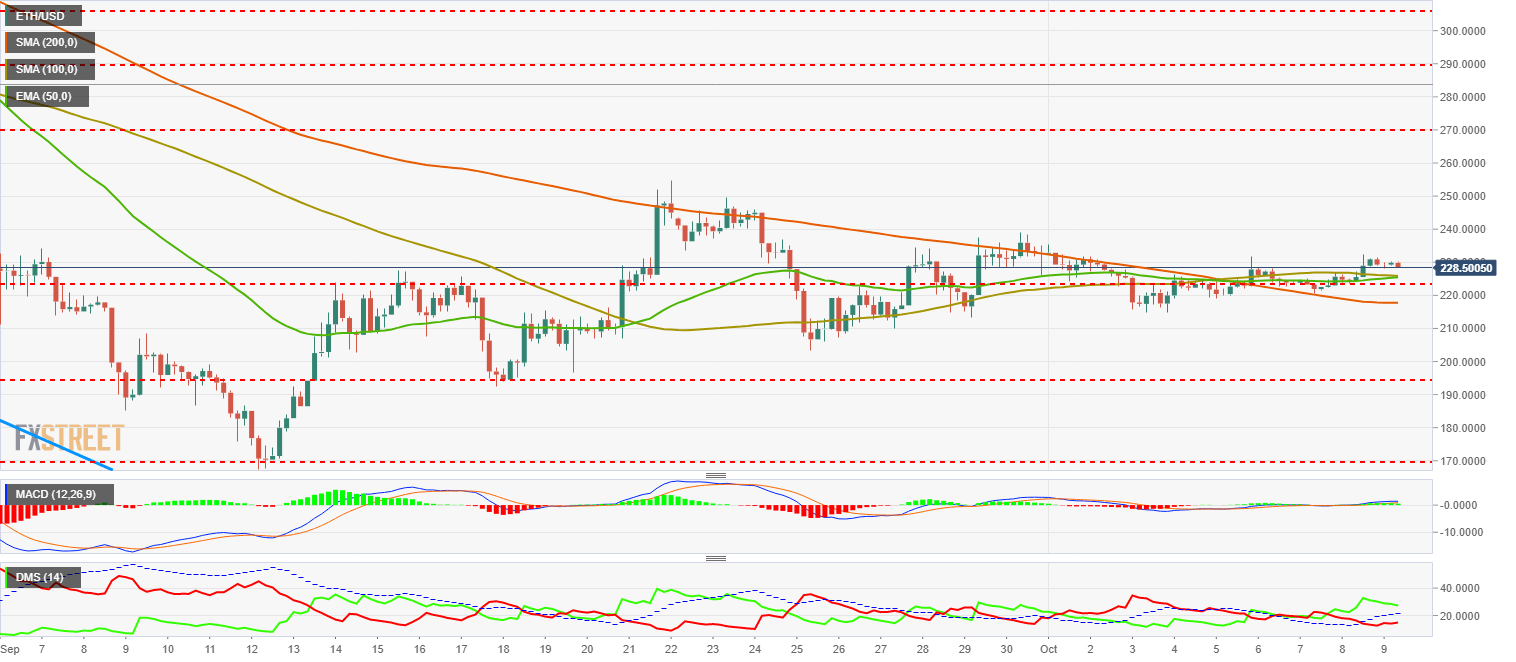
The MACD at 240-Min gained a bit of altitude on yesterday's day. The lines also got some parabolic profile, but not enough to keep it today. It is very clear that the ETH/USD is the most needed volatility of the Top 3 of the sector.
The DMI at 240-min shows some bulls with the control of the situation and that yesterday they increased their strength consistently. Today they relax in the same magnitude as the bears increase their activity. The ADX reacted and is above level 20 (a level that indicates the existence of an active trend). We will see if this continues in the next sessions.
XRP/USD 240-Min.
The XRP/USD is currently trading at the $0.482 price level. Yesterday, it didn't react to the rise like Bitcoin or Ether, but Ripple is in another scenario. It is still in the consolidation phase, although it is already finishing it.
Above the current price, the objectives and obstacles are quite clear. The movement's target is $0.80, which means that the bearish channel would break upwards. This is so because to exceed the previous maximum you will need this break. The main resistance levels are $0.55, $0.60 and $0.77.
Below the current price, there are multiple supports with two critical levels. First support and first critical level at $0.46. Losing this level would cancel the bullish scenario and plunge the XRP/USD with all probabilities into another phase of weakness. The second critical level at $0.4250 where the SMA200 passes and there is support for price congestion.
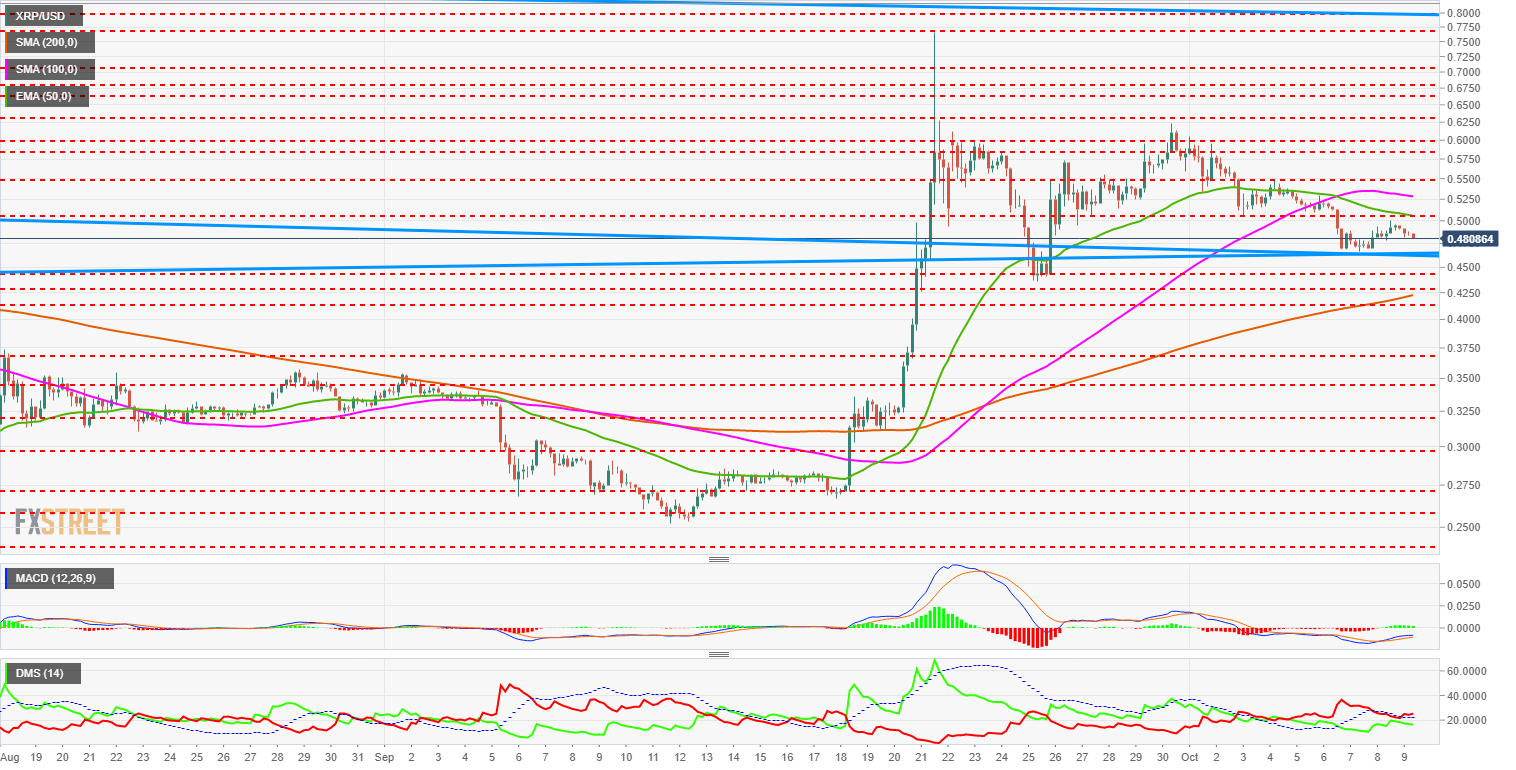
The MACD at 240-Min shows an upward cross profile but below the zero line. It is a good profile for future bullish movements but it will still need several days to configure perfectly.
The DMI at 240-Min shows us how the bears continue to have control of the situation although already with a very small advantage. The bulls have taken advantage of the descents to increase their activity and now appear very well placed to face a few ascents in the coming days.
Get 24/7 Crypto updates in our social media channels: Give us a follow at @FXSCrypto and our FXStreet Crypto Trading Telegram channel
Author

Tomas Salles
FXStreet
Tomàs Sallés was born in Barcelona in 1972, he is a certified technical analyst after having completing specialized courses in Spain and Switzerland. He expanded his technical training following the guidance of great experts on the financial markets.


