Top 3 gainers Brett, Story and Virtuals Protocol sparkle as Bitcoin eyes $90,000
- Brett attempts to break the consolidation range and outperforms the top 200 cryptocurrencies, with over 10% gains in the last 24 hours.
- Story’s price recovery from a volatile swing to $2.95 amid heightened trading volume ignites concerns about insider trading.
- Virtuals Protocol surges, reclaiming the $0.60 level supported by rising liquidity and strong ecosystem momentum.
- Bitcoin runs above key trendline resistance as the crypto market stabilizes after the previous week’s tariff-triggered volatility.

Cryptocurrencies have sustained a buoyant outlook since last week as US President Donald Trump’s tariff war was paused for 90 days, except for China, propping global markets for lifeline relief rallies. Select altcoins like Brett, Story (IP) and Virtuals Protocol (VIRTUAL) climbed in the last 24 hours, with some breaking above key consolidation ranges.
The king of digital assets, Bitcoin (BTC), shows signs of a potential bullish move. It is targeting $90,000 and trading at $85,795 at the time of writing on Tuesday. As shown in the chart below, Bitcoin has broken a key trendline resistance, signaling the potential for more gains in the coming days.
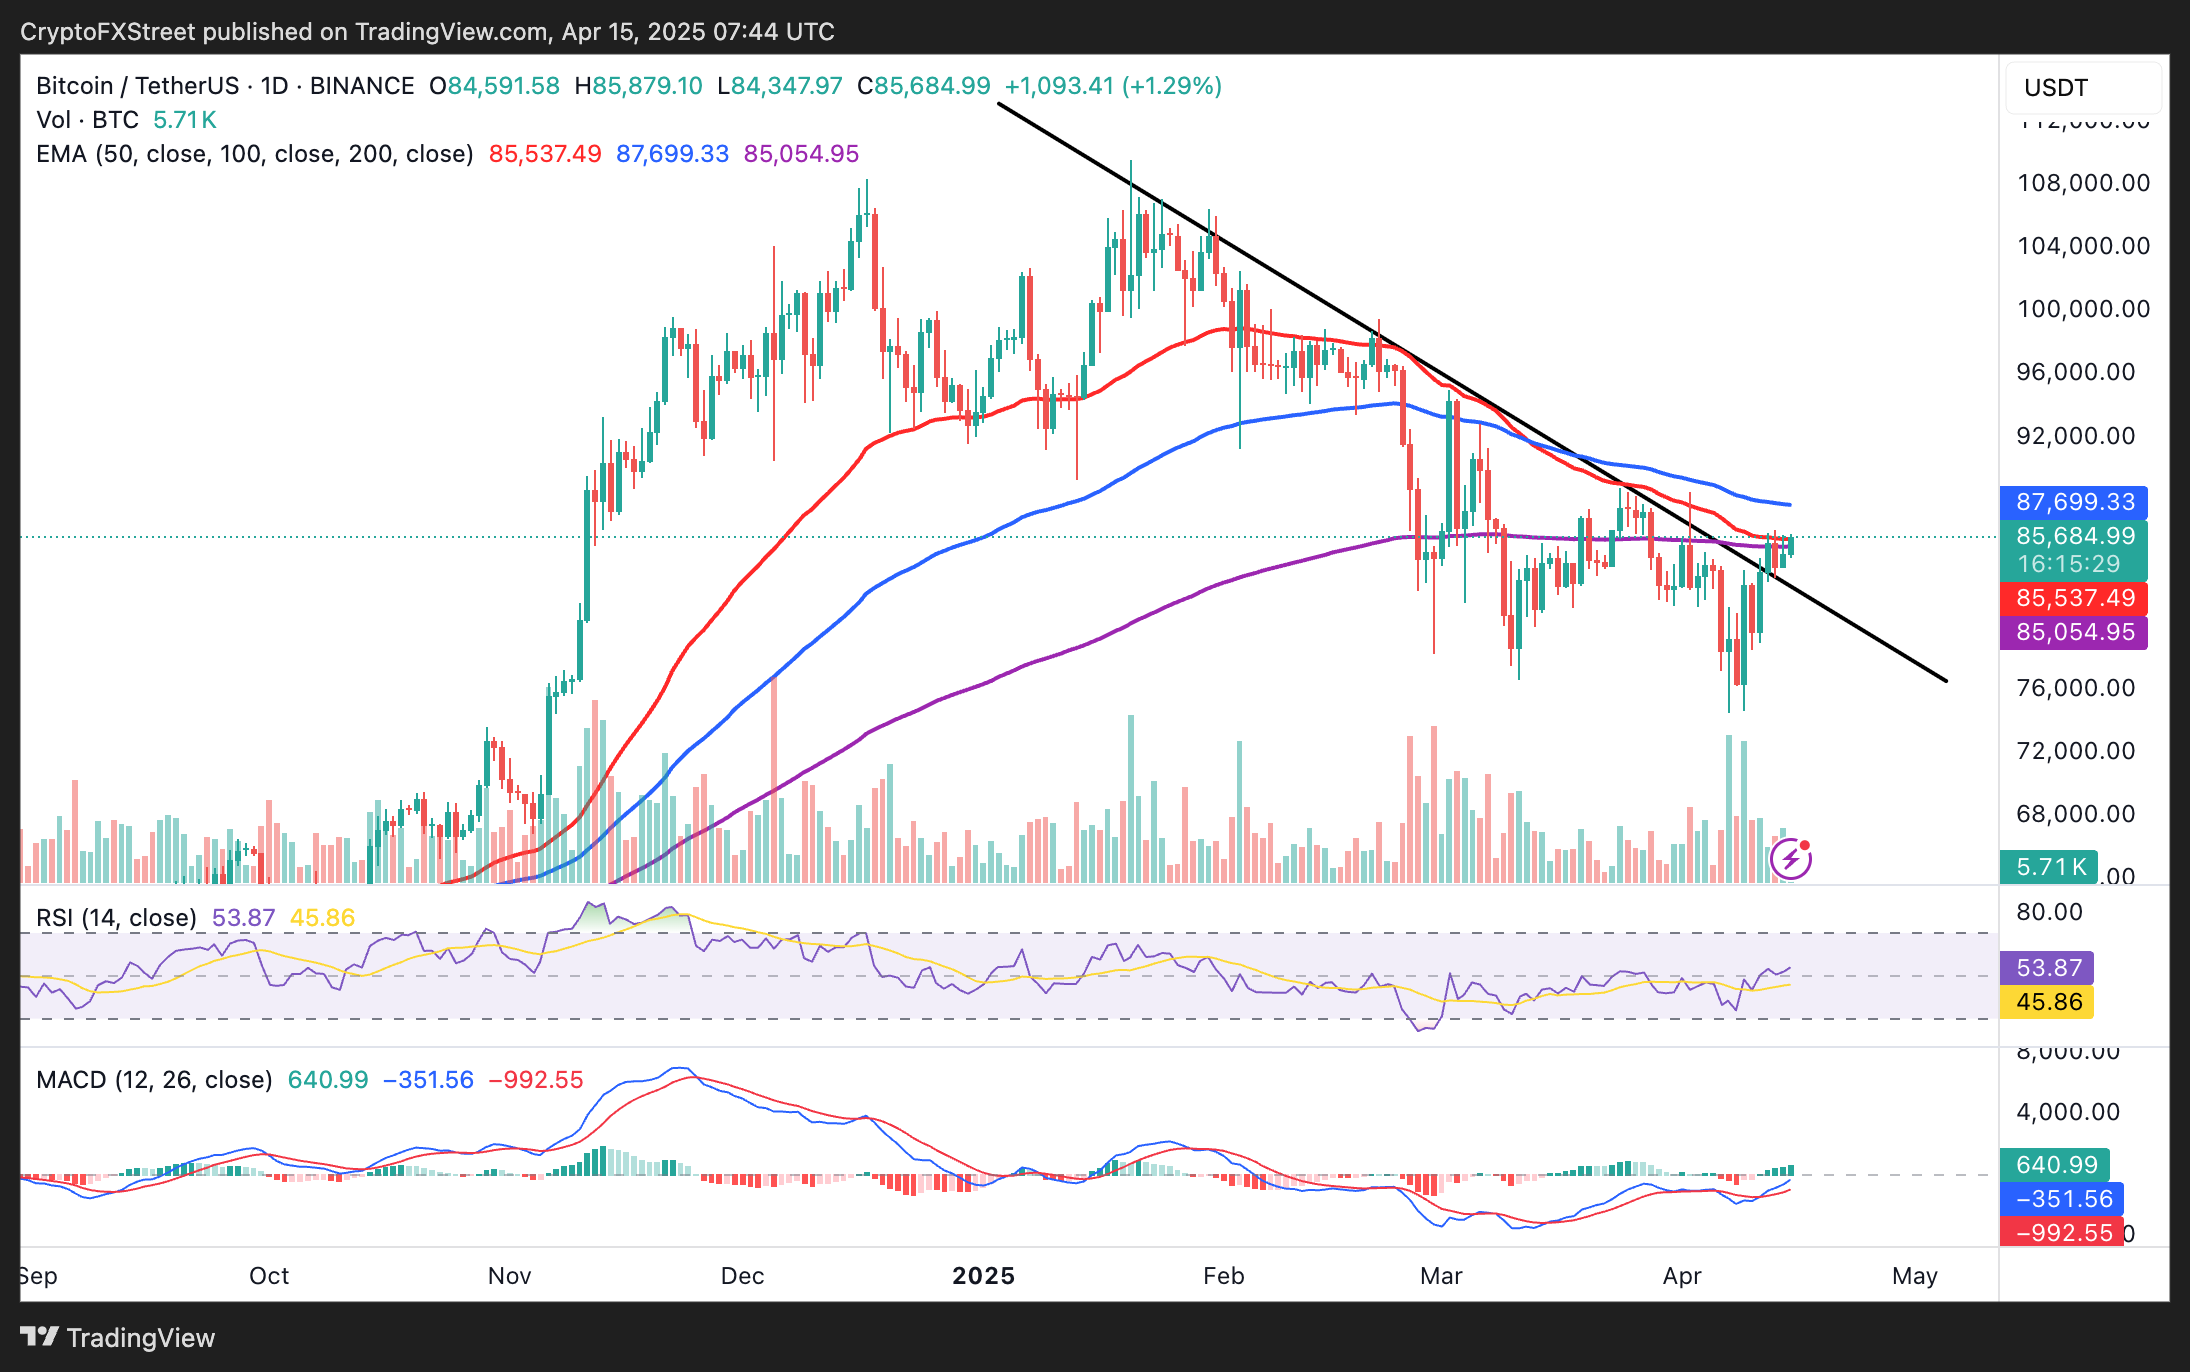
BTC/USDT daily chart
Brett is on the move, set to break 50-day EMA resistance
Brett's price continues to trend higher at $0.0377 as investors appear to turn toward meme coins, hoping to catch larger market swings, as observed with Fartcoin.
Following the reversal from support between $0.0224 and $0.0312, the least resistance path flipped upwards. Although neutral, the Relative Strength Index (RSI) indicator rose above the centreline. This encouraged bets on higher price targets, such as the immediate resistance at the 50-day Exponential Moving Average (EMA) at $0.0375, the 100-day EMA at $0.549 and the 200-day EMA at $0.0751.
The Moving Average Convergence Divergence (MACD) flaunts a buy signal in the daily chart, suggesting that buyers have the upper hand. If traders uphold their bets on higher price targets, delaying taking profit, Brett could soon hasten recovery to $0.1000, a support level earlier this year turned resistance.
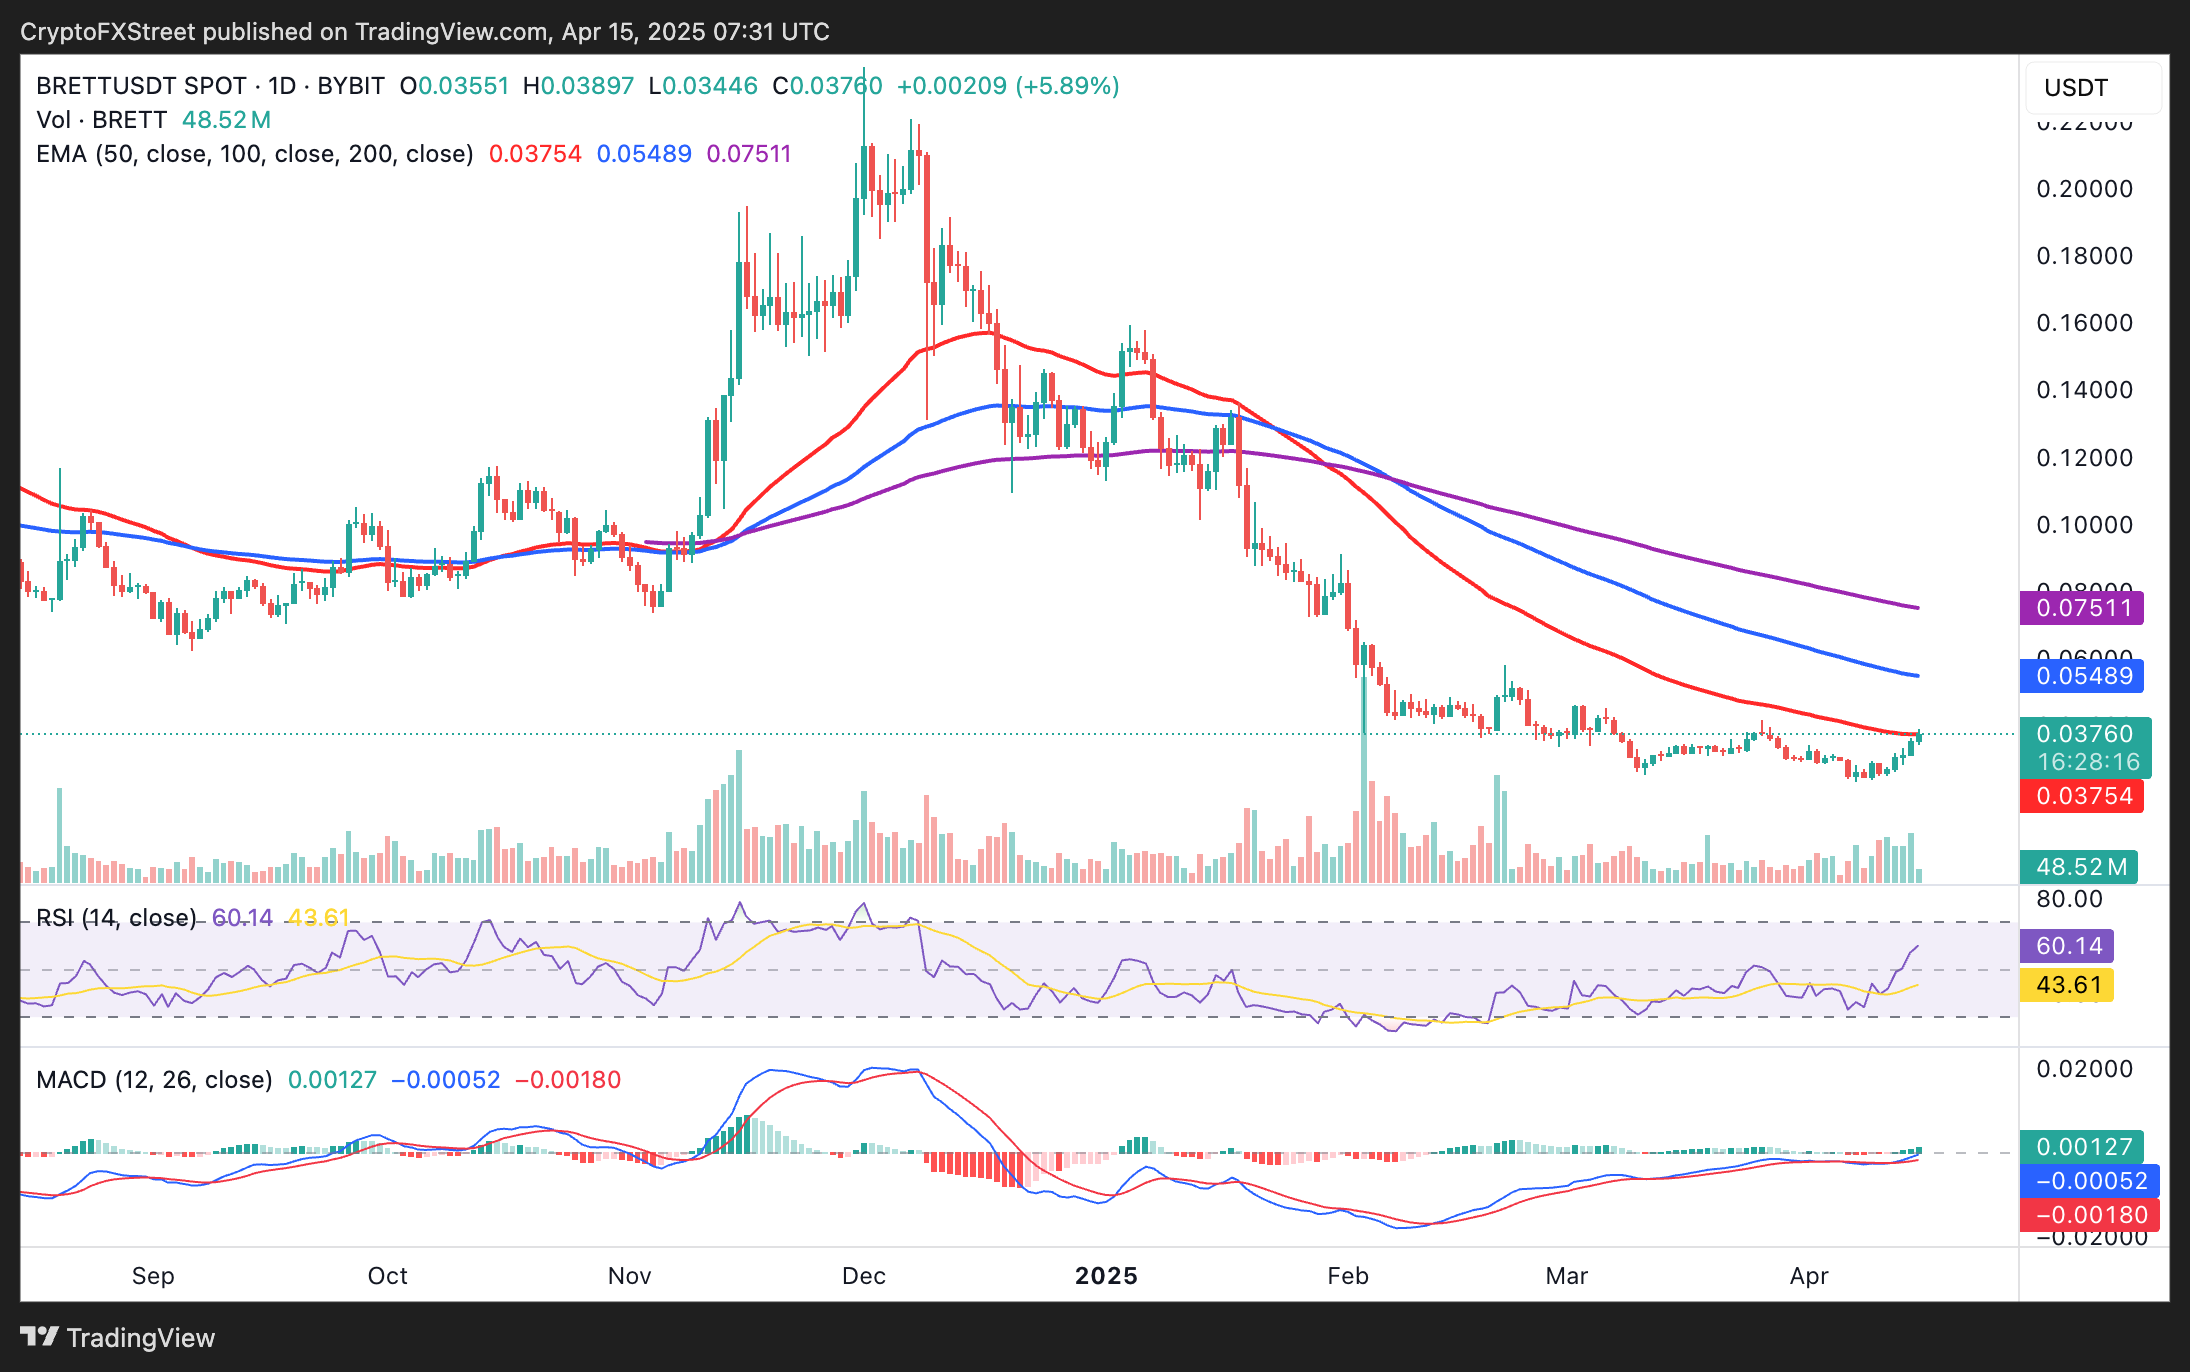
BRETT/USD daily chart
Story rebounds from unusual volatile swings
Story’s price quickly rebounded from what seemed like unusual trading activity, which ignited volatility and a sharp drop to $2.95 from approximately $4.00 on Wednesday. The trading volume skyrocketed on some exchanges, including OKX, despite the larger cryptocurrency market remaining relatively calm.
Rumors quickly circulated on social media that price manipulation was at play. The team allegedly inflated the price before selling via over-the-counter (OTC) sales. As exchange inflows surged, open-market selling ramped up, crashing the token’s price.
Story Protocol $IP ?
— Vasu Crypto (∎, ∆) (@0x_Lens) April 14, 2025
First inflate the price
Then sell tokens on OTC at discount to spot price
-Team/Investor dumping to OTC buyers
-OTC buyers dumping on open market
-Open Market buyers will sell at loss
Might not happen suddenly, but surely. pic.twitter.com/kHqiZRZkyL
The Mantra team behind the OM token faced similar allegations following Sunday's 90% crash, which saw the market capitalization fall by more than $5 billion.
Unlike OM, Story’s price quickly rebounded, erasing the losses incurred on Monday and trading at $4.15 at the time of writing. Based on the RSI and the MACD indicators, its technical structure appeared intact, signaling a potential move to the support-turned-resistance at $5.00.
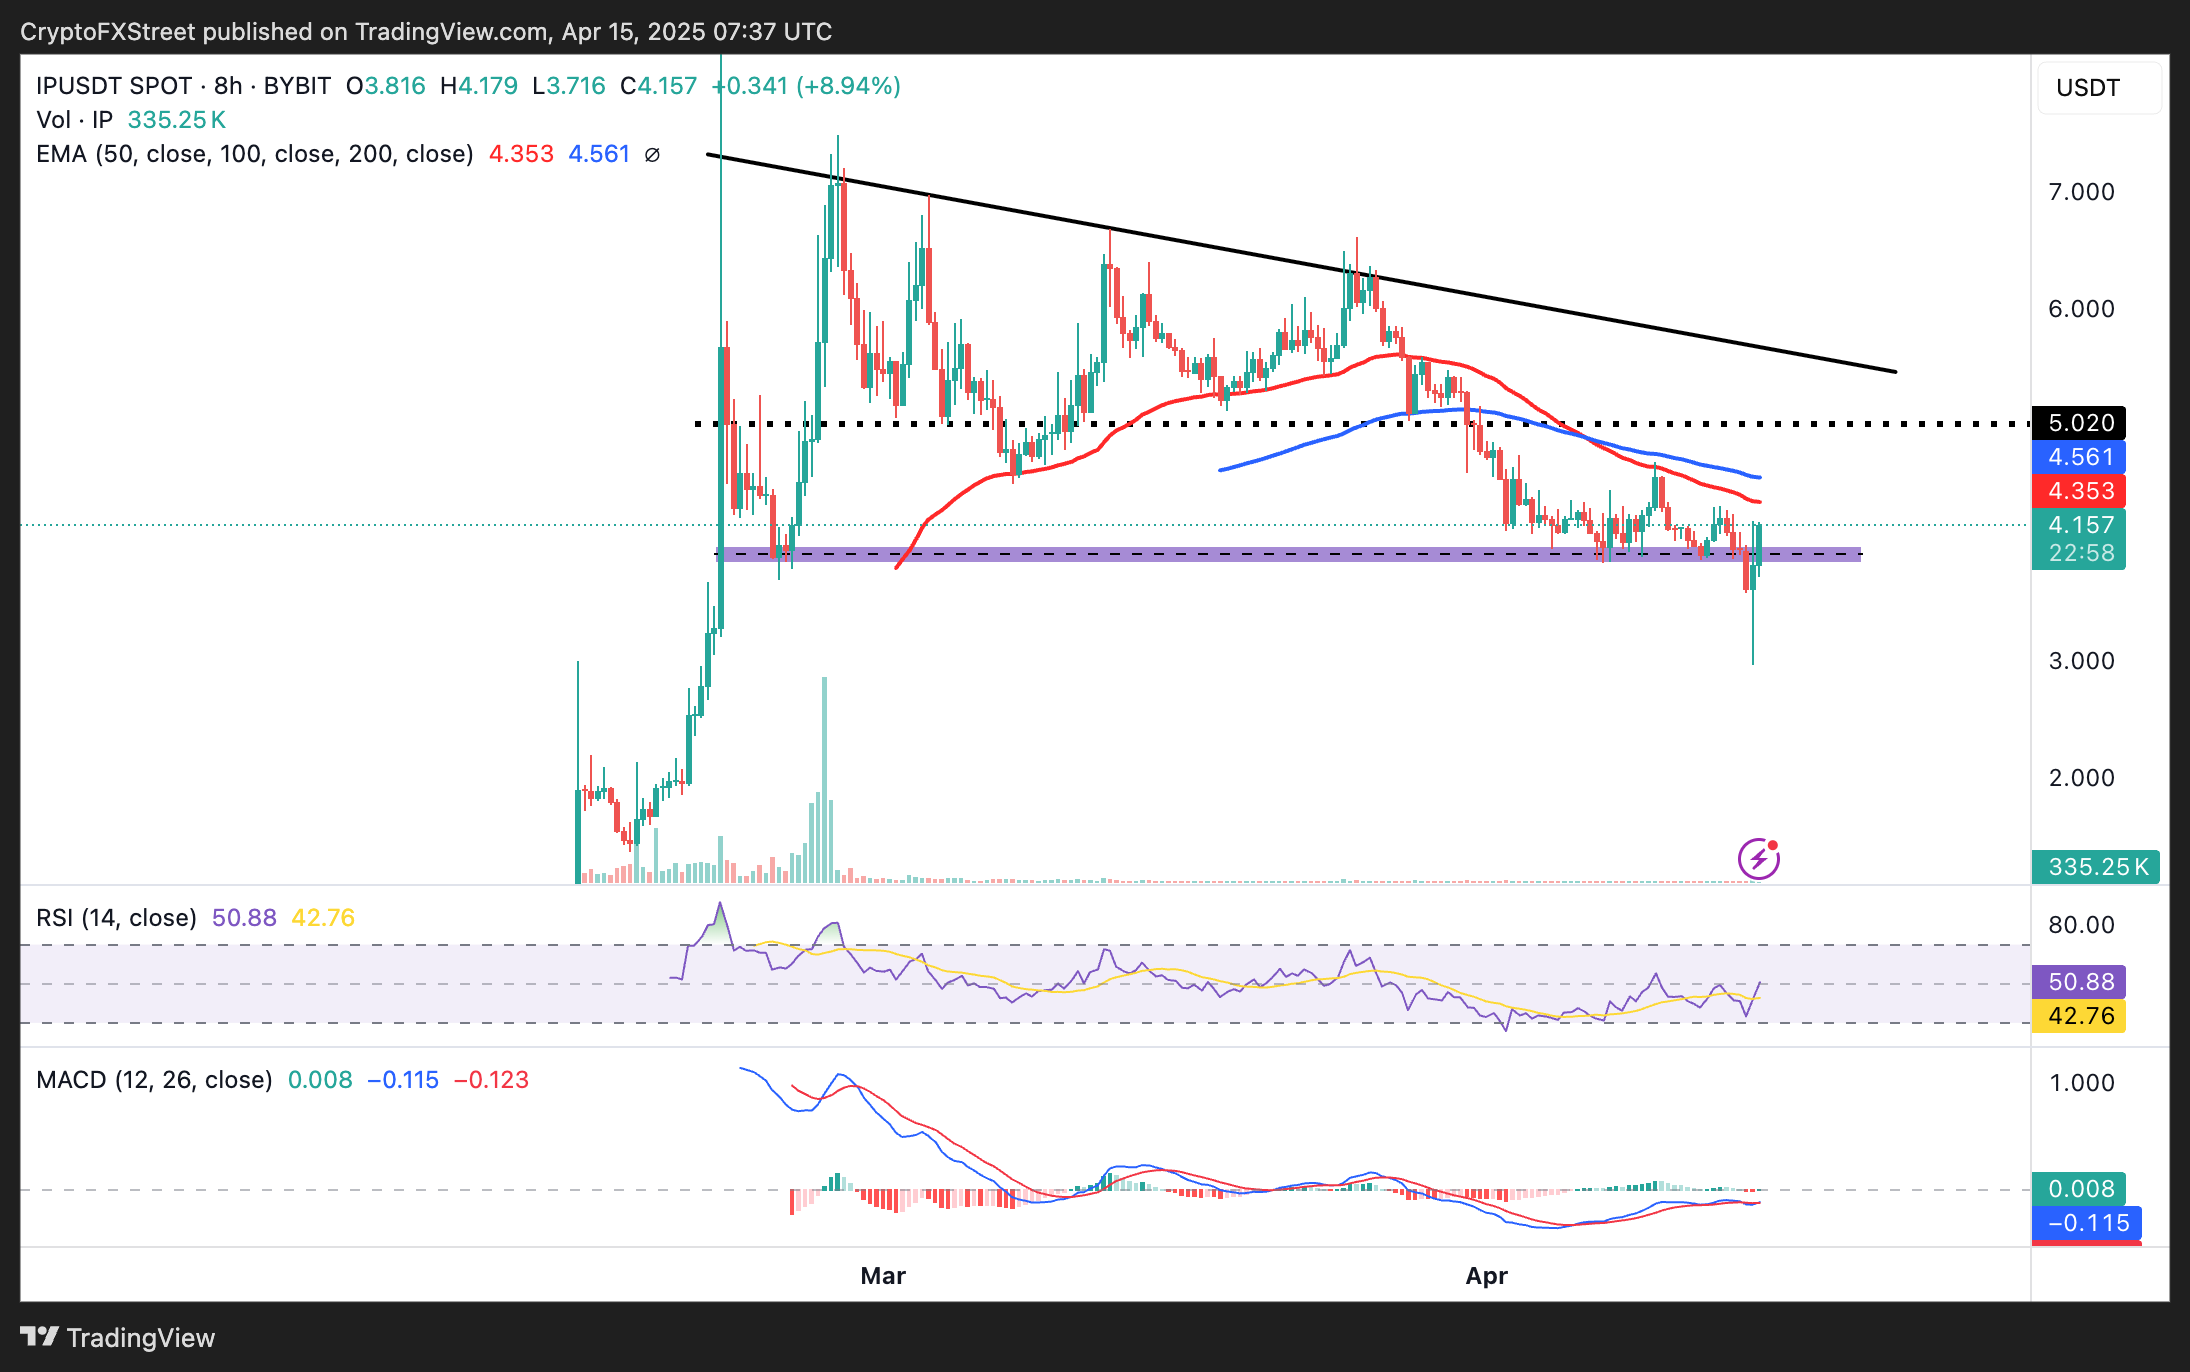
IP/USDT 8-hour chart
Virtuals Protocol climbs on strong fundamentals
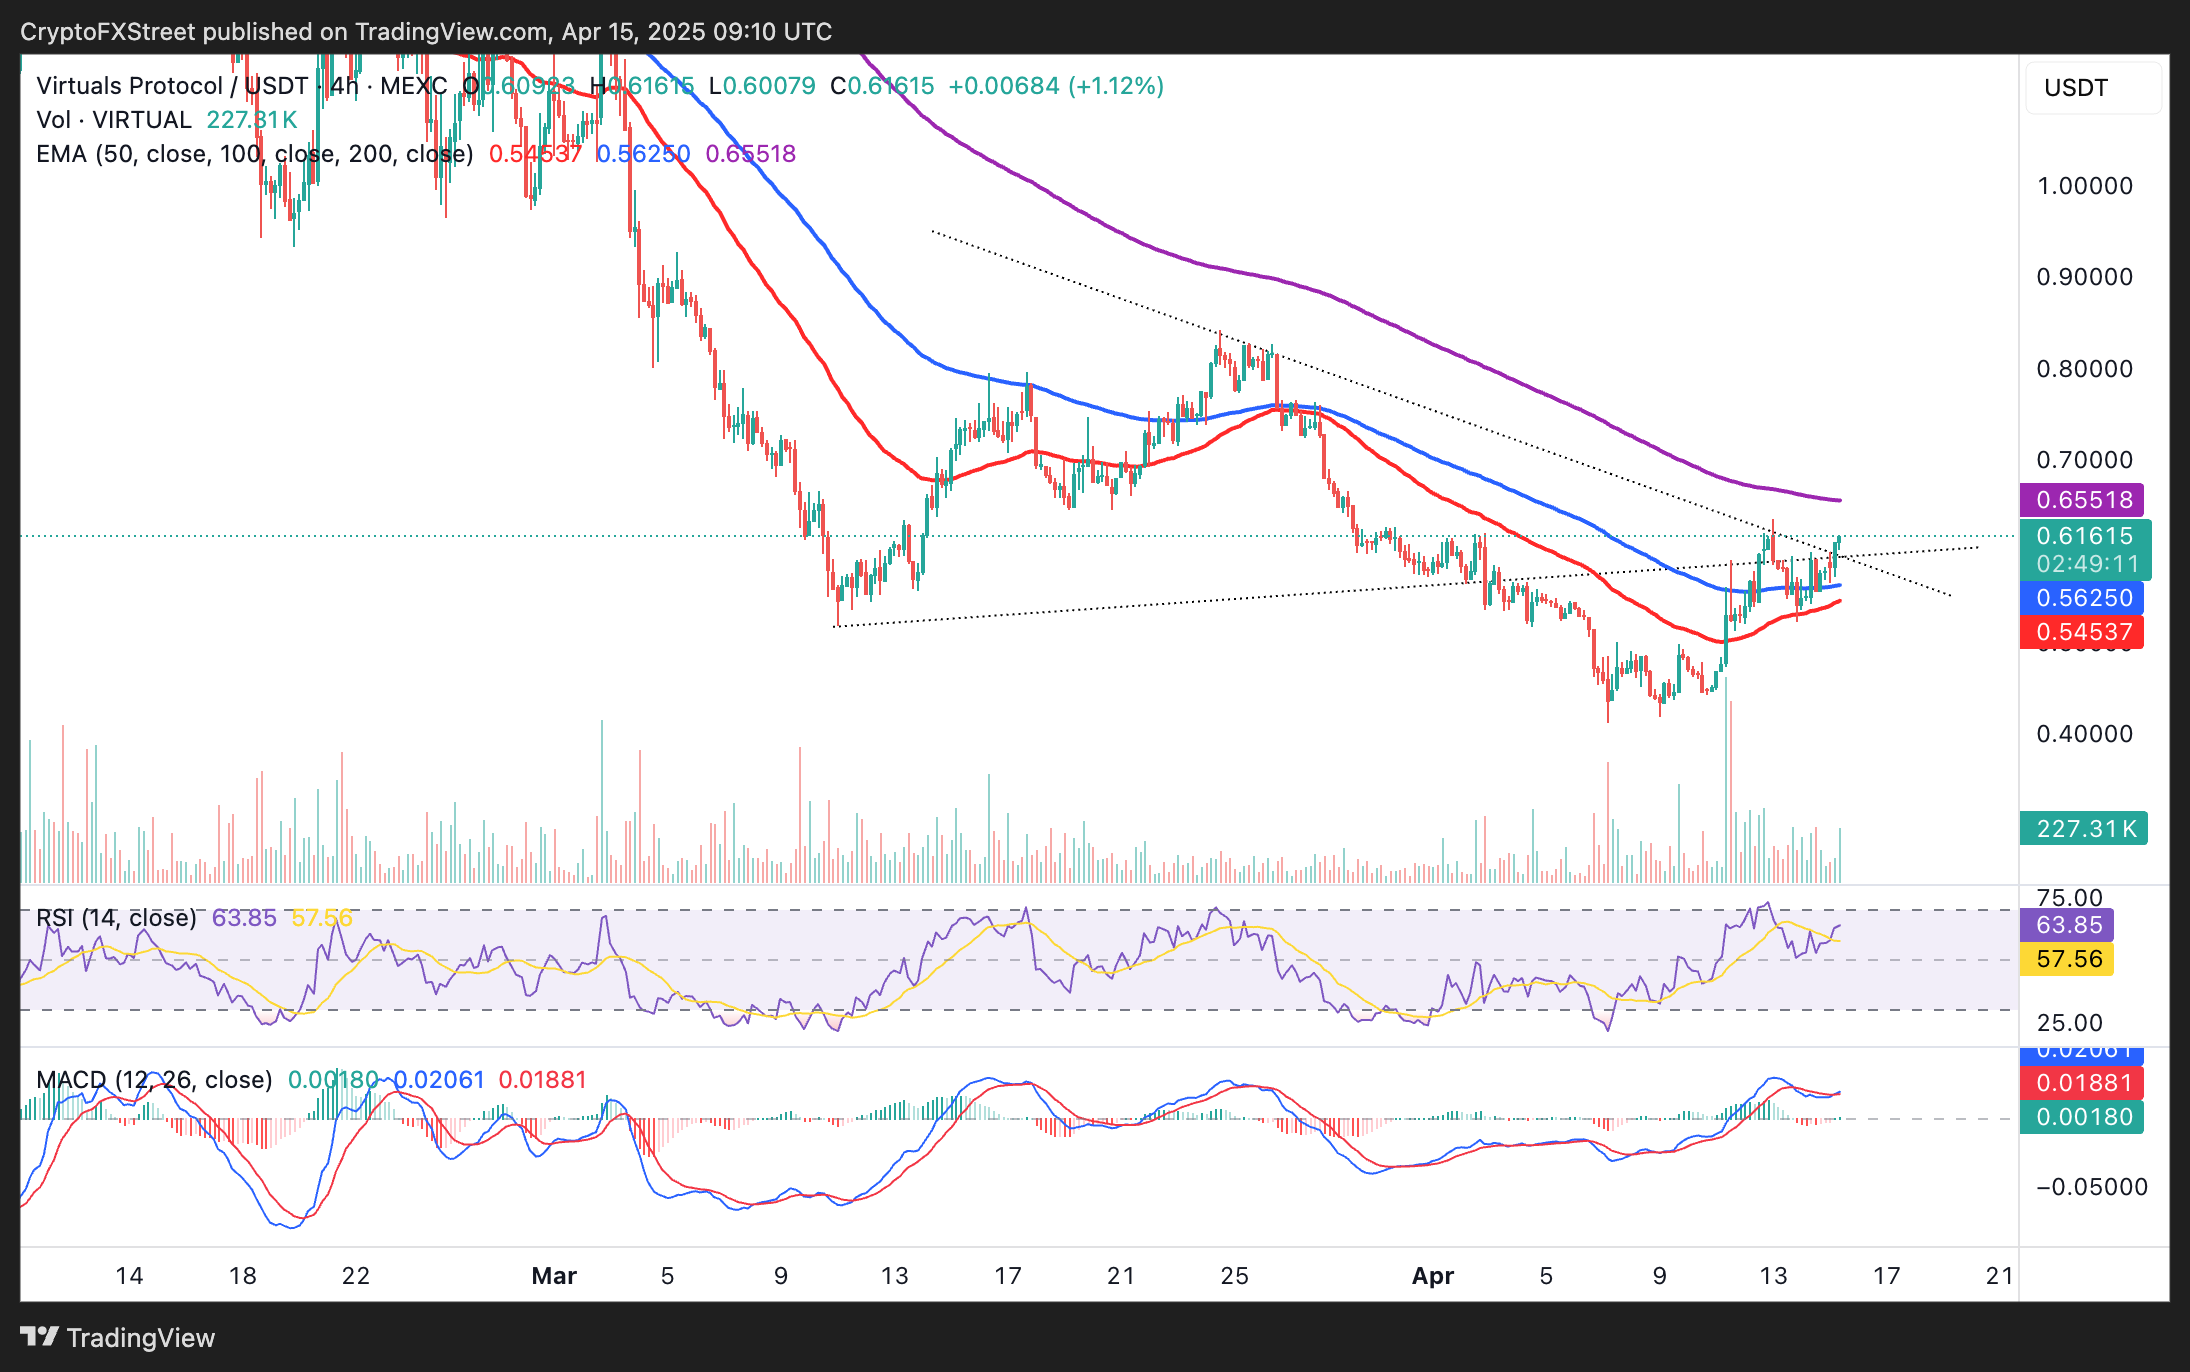
VIRTUAL, an AI agent-based token, stood out as a top performer among the market’s 200 largest digital assets, buoyed by its expanding ecosystem. The team credited the 5.3% rise to $0.6083 to growing liquidity in the market.
VIRTUAL/USDT 4-hour chart
The token boasts a solid technical structure in the 4-hour timeframe, supported by a buy signal from the MACD indicator as the RSI trends above the midline toward the overbought region.
VIRTUAL sits above the 50-day and 100-day EMAs, predisposing the token to more gains in the coming days. Traders should watch out for a potential correction at the 200-day EMA at $0.6551, as some investors may choose to realize gains following last week’s dip to $0.4125.
Author

John Isige
FXStreet
John Isige is a seasoned cryptocurrency journalist and markets analyst committed to delivering high-quality, actionable insights tailored to traders, investors, and crypto enthusiasts. He enjoys deep dives into emerging Web3 tren



