Top 3 Bitcoin, Ethereum and Ripple Price Predictions: Messing around, waiting for the bullish trigger - Confluence Detector
-
Bitcoin is in a comfortable price zone and has a clear goal: $7,550.
-
Ethereum hesitates on the road, although it is clear the level to beat is $500.
-
Ripple has more than one goal, but the most important one is always the first and is at $0.492.

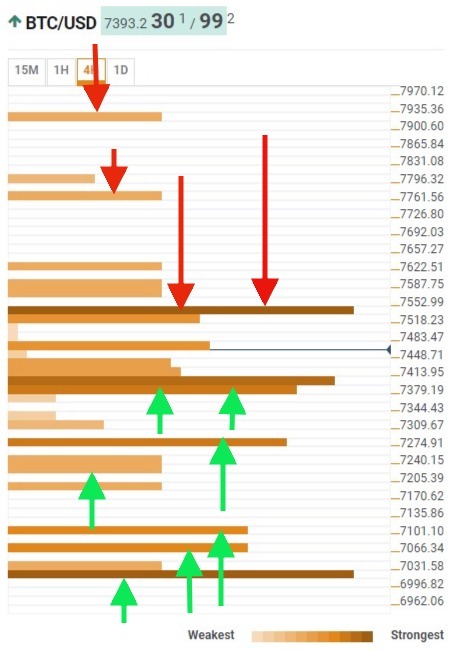
BTC/USD 240 Min
Bitcoin is quite clearly ahead of its time when it looks at higher prices, while any attempt to sell it will find a path full of impediments. This scenario is the result of the sharp rise seen this week. It was a breakthrough move that has taken Bitcoin to a new stage in the short term.
Above the current price at $7,457, there is only one confluence with the strength to stop the advance of the BTC/USD. It already did yesterday, but it looks like Bitcoin's going to try again. This confluence is located at $7,550 and is formed directly and indirectly by the following indicators: the daily SMA100, yesterday's high, the daily R1 Pivot Point level, the monthly R1 Pivot Point, the daily 23.6% Fibonacci retracement and others of lesser importance. If Ripple manages to exceed this price level, it will only be ahead of the daily R2 of Pivot Point at $7760 and the daily R3 Pivot Point at $7,760.
Below the current price level, many support lines would hinder any downward attempt. At the $7,400 price level, the confluence formed by the SMA10 in four hours, the weekly R3 of Pivot Point, the 15 Min SMA100 and the daily 61.8% of Fibonacci. Below this price level, it has some freedom of movement towards $7,250, where the weekly 161.8% Fibonacci retracement and yesterday's lows and the daily S1 Pivot Point level form a second significant confluence. Finally, between $7,100 and $6,995, an important confluence zone where the weekly R2 Pivot Point price level add it´s strength to the daily S2 Pivot Point level, the daily 161% and monthly 61.8% Fibonacci retracement calculations.
Click to see the Full Confluence Indicator
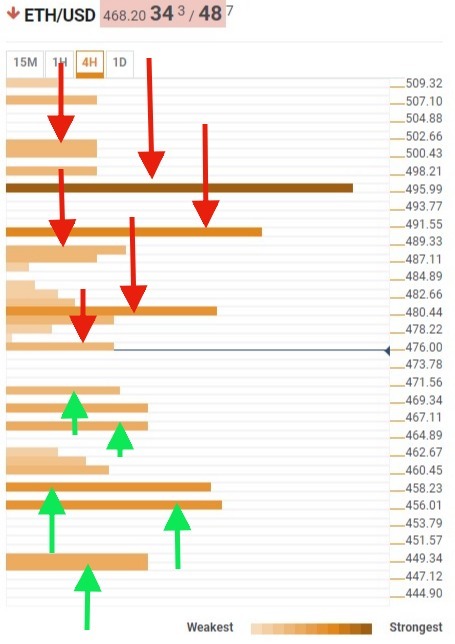
ETH/USD 240 Min
Ethereum is still in a complicated, sticky situation. It lacks the break with current levels that will allow it to see higher prices.
Above the current price of $475, Ethereum has a medium strength confluence at $480. It is made up of more than 17 different technical indicators, the most important of which are the weekly R1 Pivot Point level and the daily 23.6% Fibonacci level. Above this level and already at $490, the confluence of the monthly 38.2% Fibonacci, the four-hour SMA10 and the daily 38.2% Fibonacci retracement level will not make it easy for the ETH/USD either. Finally, defending the $500 level, a series of mixes starting at the $498 price level add up to, among others, last week's high, daily 61.8% Fibonacci retracement and the daily SMA of 50 periods.
Below the current price, the first confluence zone that is now support located at the $467 price level, with yesterday's lows, the SMA200 at four hours and the weekly 61.8% Fibonacci retracement. Further down at the $460 price level, the confluence of the daily S1 level of Pivot Point and the four-hour SMA100 overlaps with the confluence of the $456 price level and adds the monthly 23.6% Fibonacci and the hourly SMA200 levels.
Click to see the Full Confluence Indicator
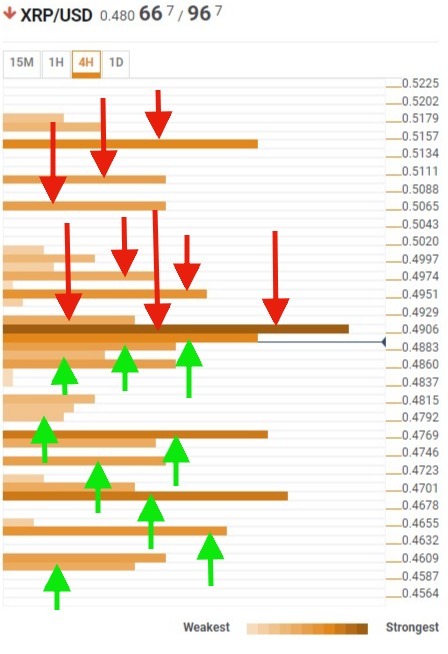
XRP/USD 240 Min
We can say, like war reporters, that Ripple is in the heat of combat. Considerable power confluence levels surround XRP/USD. Let's see what Ripple's options are.
Above the current price at $0.488 Ripple would immediately meet the confluence located at $0.49 price level and formed by the last week's high and the daily 23.6% Fibonacci retracement level. The confluence of the monthly 23.6% Fibonacci and the minimum of the previous hour await a few cents higher. The SMA of five, ten and one hundred periods in 15 minutes also play a role. If XRP/USD goes beyond this dense zone, you will find another confluence at the $0.495 price level which is made up of the daily 38.2% Fibonacci retracement, the maximum of one hour and the SMA of 200 periods in 15 minutes among other indicators. The final bullish target for Ripple is at $0.5157 price level, where the daily 61.8% of Fibonacci converge with the weekly R2 Pivot Point price level.
Below the current price, the dense confluence zone will also not make it easy for the bears. At the $0.486 price level, the confluence formed by the SMA5 in 4 hours, the SMA50 in 15 minutes, the SMA200 in four hours and the minimum of four hours as well. If bearish traders manage to take the price lower at the $0.476 price level, they will find the confluence of yesterday's low and the weekly R1 Pivot Point level. Finally, at $0.463, the pair will meet a confluence of the daily S1 Pivot Point, the four-hour SMA100, and the weekly 61.8% Fibonacci levels.
Click to see the Full Confluence Indicator
Author

Tomas Salles
FXStreet
Tomàs Sallés was born in Barcelona in 1972, he is a certified technical analyst after having completing specialized courses in Spain and Switzerland. He expanded his technical training following the guidance of great experts on the financial markets.


