This subtle cue suggests Shiba Inu price will see a tumble
- Shiba Inu price congestion zone shows an uptick in volume.
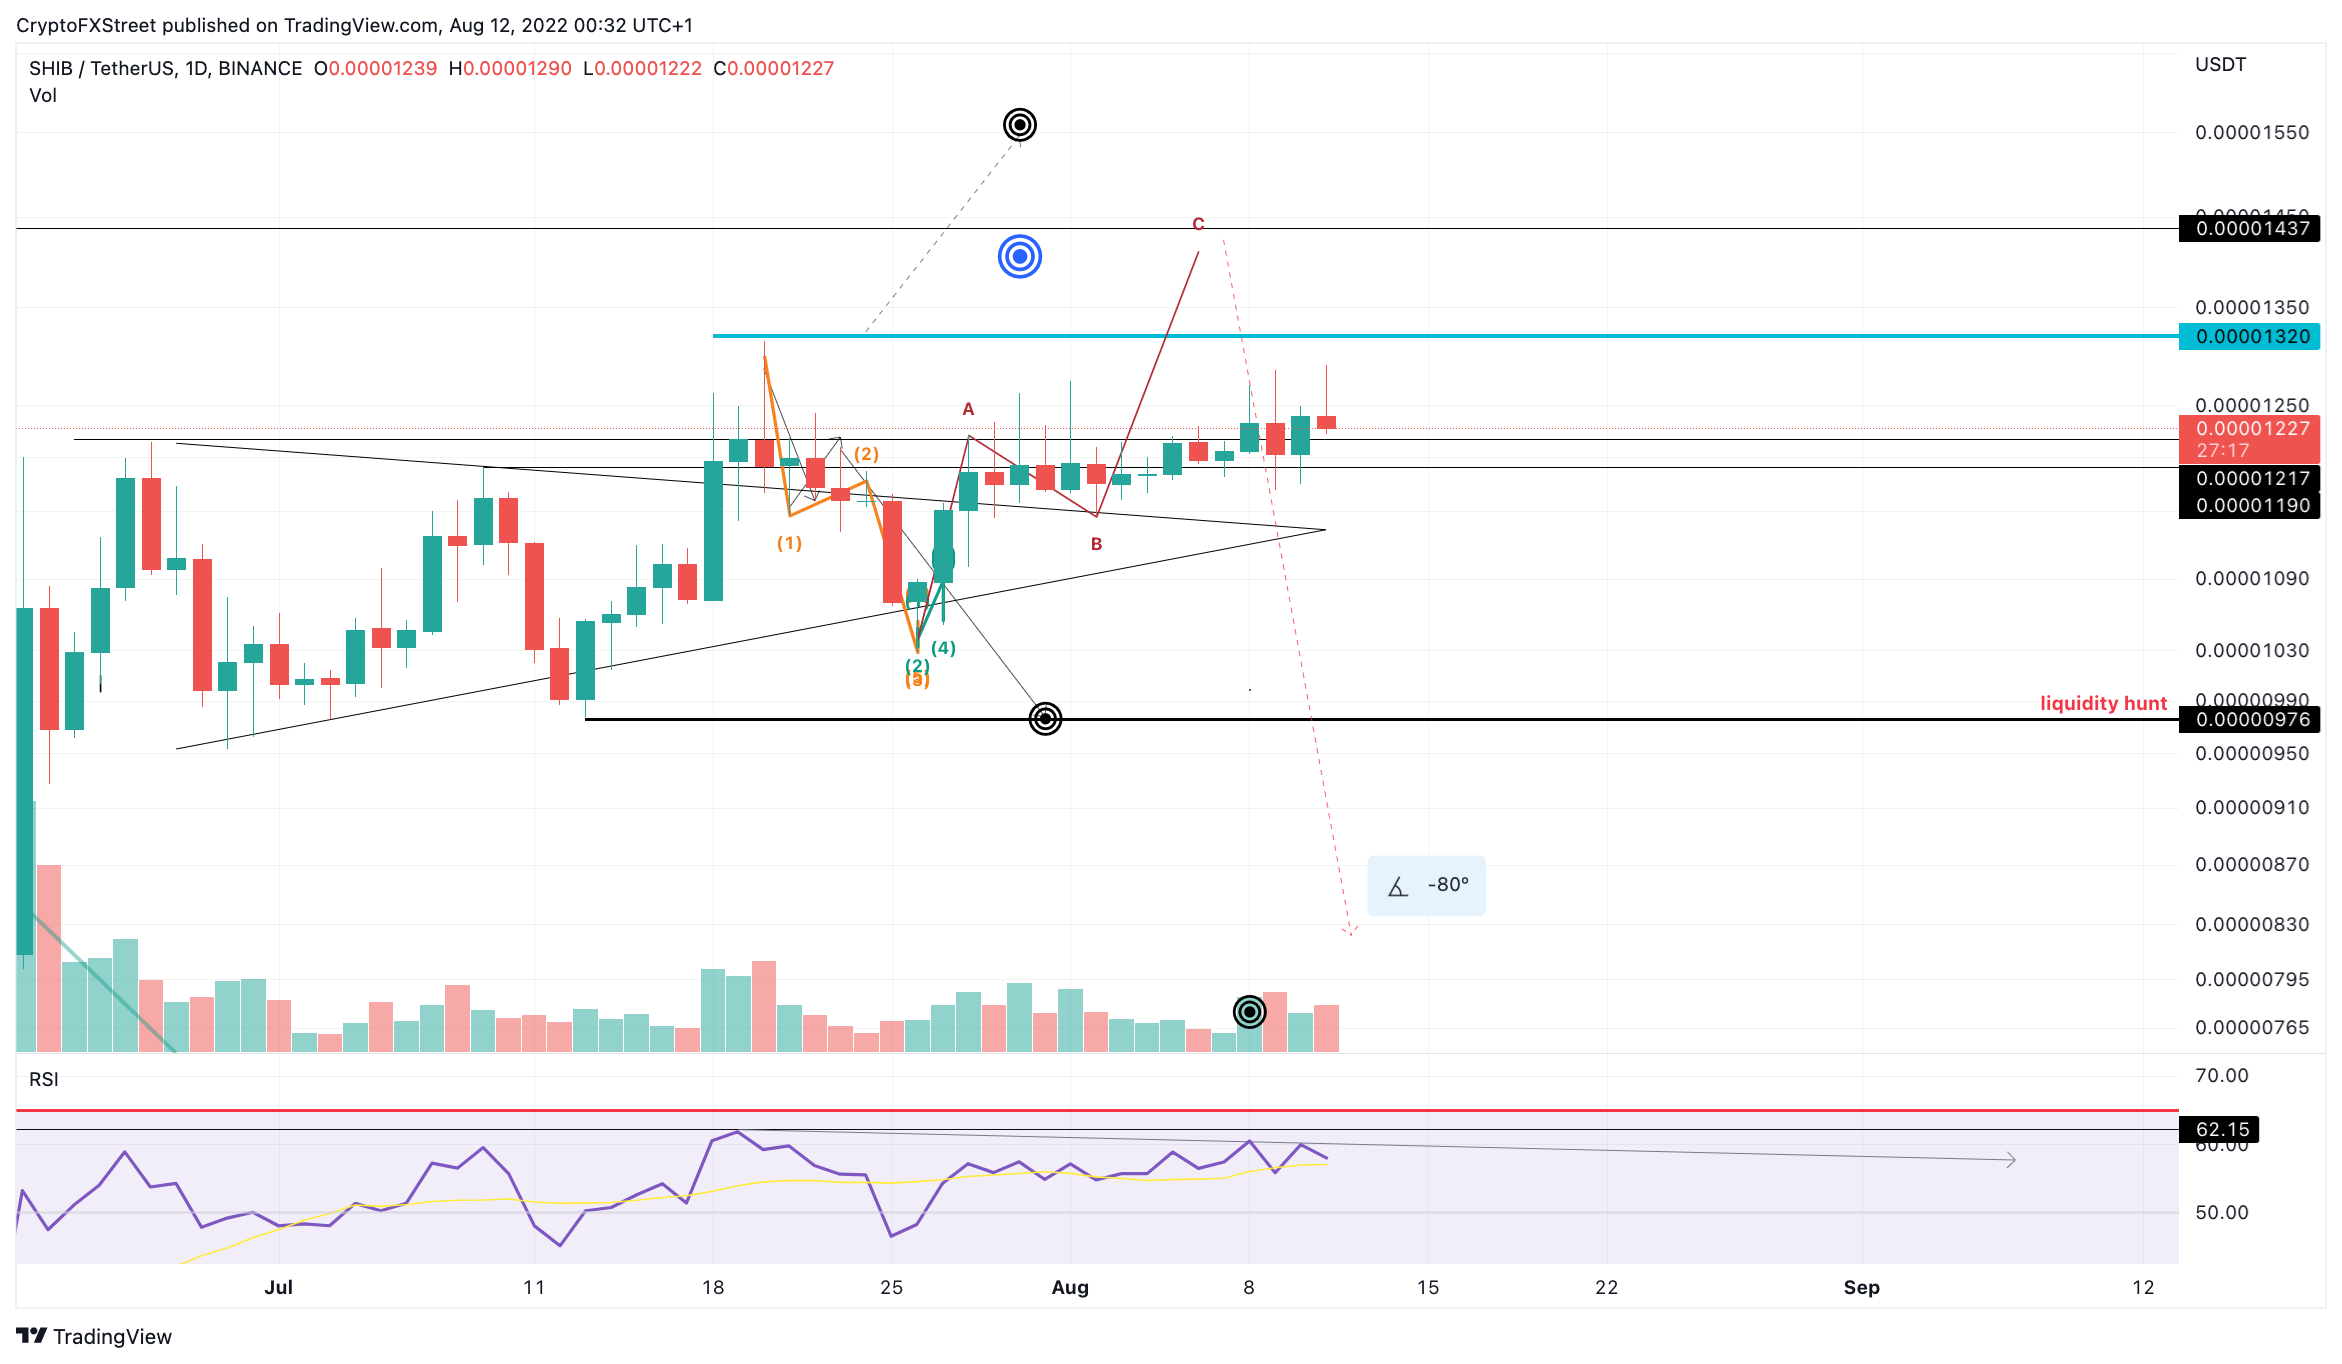
- SHIB price shows classic divergence on the daily chart.
- An early sign of uptrend weakness will be a break below $0.00001217.
Shiba Inu price shows reasons to believe in an upcoming liquidation. Key levels have been defined.
Shiba Inu price merits caution
Shiba Inu price is presenting quite the tug of war battle during the second trading week of August. Previous outlooks have prophesied on both bearish and bullish sides of the coin, and as of yet, no target has been successfully breached. Shiba Inu price has become very indecisive and will likely resolve the choppy price action with an explosive move.
Shiba Inu price currently trades at $0.00001230. However, not much has changed in terms of price in the last few days. Bulls in profit from last week’s outlook targeting the $0.00001400 zone should be very cautious. A bearish divergence has been displayed between July 19 and August 8. Such a subtle cue could catalyze a sharp decline targeting $0.00001074.
SHIB/USDT 2-Day Chart
Still, the intended target zone at $0.00001400 is within arms reach. If the target is surpassed, traders may want to consider actualizing the profit as bearish divergences tend to result in liquidations after the fact. Early signs of uptrend weakness will be a break below $0.00001217.
In the following video, our analysts deep dive into the price action of Shiba Inu, analyzing key levels of interest in the market. -FXStreet Team
Author

Tony M.
FXStreet Contributor
Tony Montpeirous began investing in cryptocurrencies in 2017. His trading style incorporates Elliot Wave, Auction Market Theory, Fibonacci and price action as the cornerstone of his technical analysis.


