This on-chain metric suggests Bitcoin price correction is unstoppable
- Bitcoin tumbles to $30,000 in search of robust support after losing support at the 200 SMA.
- The SOPR is heading fast towards one, hinting at a continued breakdown.
- Bitcoin is likely to present a buy the dip opportunity, allowing more investors to join the market.

Bitcoin is trading sub $30,000 after a hurricane-like gust of wind swept across the cryptocurrency market. The flagship digital assets had been rejected at $38,000, giving way to losses that took a pit stop at $34,000. However, the bearish outlook grew stronger, forcing BTC to test former support at $30,000.
According to the Spent Output profit Ratio (SOPR), an on-chain metric by Glassnode, the correction is bound to continue. Price action below $30,000 could bring the support at $28,000 on the test, while declines are likely to extend to $25,000 as predicted on Thursday.
Bitcoin SOPR predicts extended breakdown
Markets are psychological, hence the need to understand why certain things occur. On-chain metrics have recently become fundamental tools for understanding bearish, consolidation, and bull periods.
The SOPR is an indicator measured from network spent outputs. It is arrived at by dividing the realized value (USD) by the value at creation (USD) of an output (price sold/price paid).
A SOPR value higher than one suggests that all holders of spent outputs are transacting at a profit. On the other hand, any other value means that they are at a loss at the time of transacting. Usually, people sell when they are in profit.
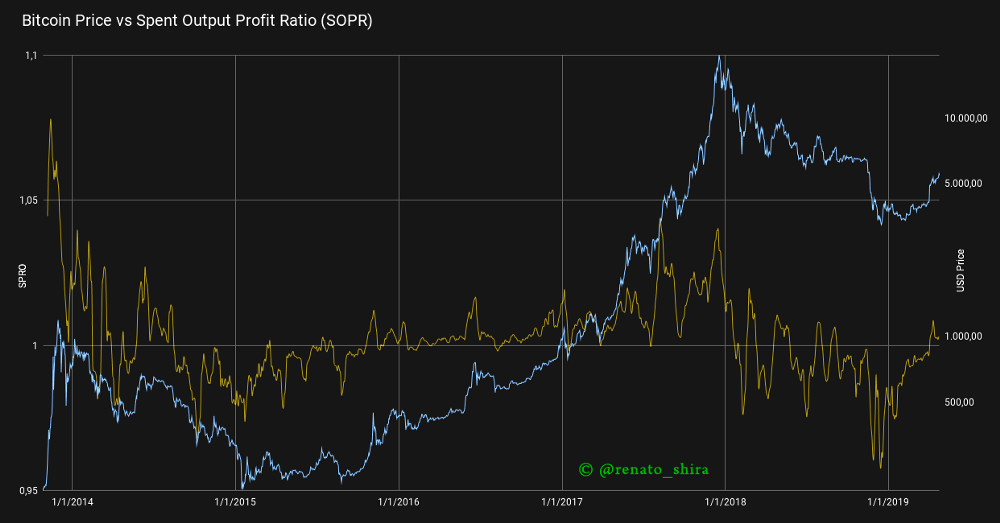
Bitcoin SOPR chart
Currently, the SOPR is declining towards one, which means less BTC is being transacted on-chain at extreme profits. The SOPR is likely to continue with the pullback eyeing the midline.
As explained recently, Bitcoin could also be nearing a reversal and would present a buy the dip opportunity. Realize that a SOPR of less than one in bull markets pushes the supply down, which leads to an increase in the price.
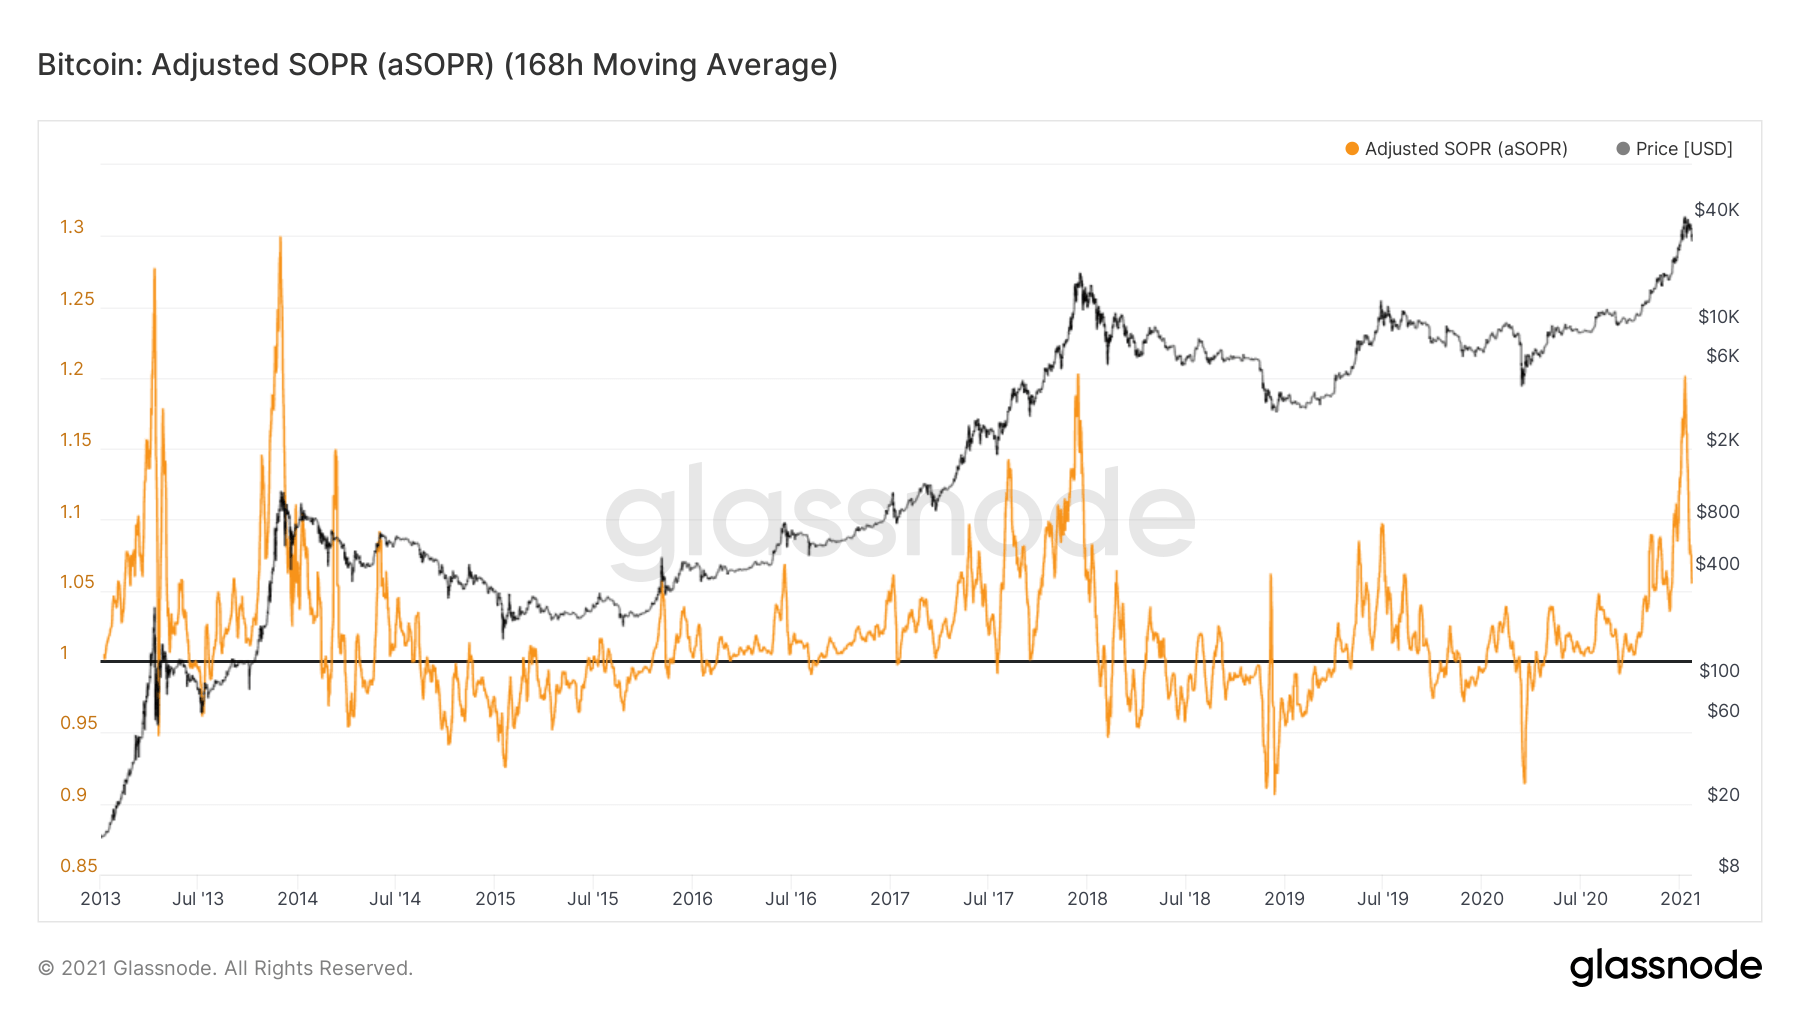
Bitcoin Adjusted SOPR chart
Bitcoin is exchanging hands at $30,500 after testing the former buyer congestion zone at $30,000. Various critical support levels have already been lost, including the symmetrical triangle support and the 200 Simple Moving Average on the 4-hour chart.
A breakdown under the lower trendline of the triangle precisely point’s Bitcoin to $25,000, as predicted on Thursday. Therefore, the technical perspective concurs with the SOPR, hinting at a continued correction before a significant reversal comes into the picture.
%20-%202021-01-22T061414.809-637468827355631325.png)
BTC/USD 4-hour chart
It is essential to realize that Bitcoin is trading under all the applied moving averages. Therefore, overhead pressure is likely to soar as odds for a bearish impulse surge.
Simultaneously, the Moving Average Convergence Divergence or MACD adds credibility to the bearish outlook by first diving into the negative region. Secondly, the 12-day moving average slipped below the 26-day moving average.
On the contrary, holding above $30,000 is likely to call for stability in the market, giving investors and bulls ample time to buy the dip. An increase in buying pressure would eventually catapult Bitcoin in a trajectory heading to $40,000.
Author

John Isige
FXStreet
John Isige is a seasoned cryptocurrency journalist and markets analyst committed to delivering high-quality, actionable insights tailored to traders, investors, and crypto enthusiasts. He enjoys deep dives into emerging Web3 tren


