Theta price projects storms on the horizon after significant sell signal
- Theta price triggers double-top pattern during cryptocurrency meltdown.
- Rally reaching five standard deviations from the mean is sitting on the precipice.
- When the fire comes, even dead cats will bounce.

Theta price advance from the 2020 low had so much momentum that the altcoin recorded five weeks in which it was five standard deviations above the 40-week simple moving average (SMA). The stellar rally topped this past week as the reversal from fresh highs triggered a double-top pattern when it traded below $11.06. In the short-term, the price may rebound, but the longer-term outlook looks challenging for bullish speculators.
Theta price has rallied with the revolution, but all rallies come to an end
As a decentralized peer-to-peer network, THETA can revolutionize the video streaming industry by offering better video delivery at lower costs. Last week, a third patent was granted for “Methods and Systems for Peer Discovery in a Decentralized Data Streaming and Delivery Network.” According to the company, the system “uses advanced algorithms to enhance the robustness and connectivity of the Theta peer-to-peer edge network, resulting in significantly improved video delivery quality.”
In little less than a year, THETA rallied over 46,000%, reaching extreme deviations from the mean in the process. Last week’s attempt at restarting the rally failed, despite the hyped Coinbase (COIN) initial public offering.
The 10-week SMA has played a significant role during the entire THETA advance from March 2020 low, and it will determine if the double top does evolve into a massive sell-off. At the time of writing, the price is at $8.83, and a weekly close below will unleash notable selling.
If selling pressure does not diminish, the next support is the 50% retracement of the 2020-2021 rally at $6.86 and then the 61.8% Fibonacci retracement at $4.90.
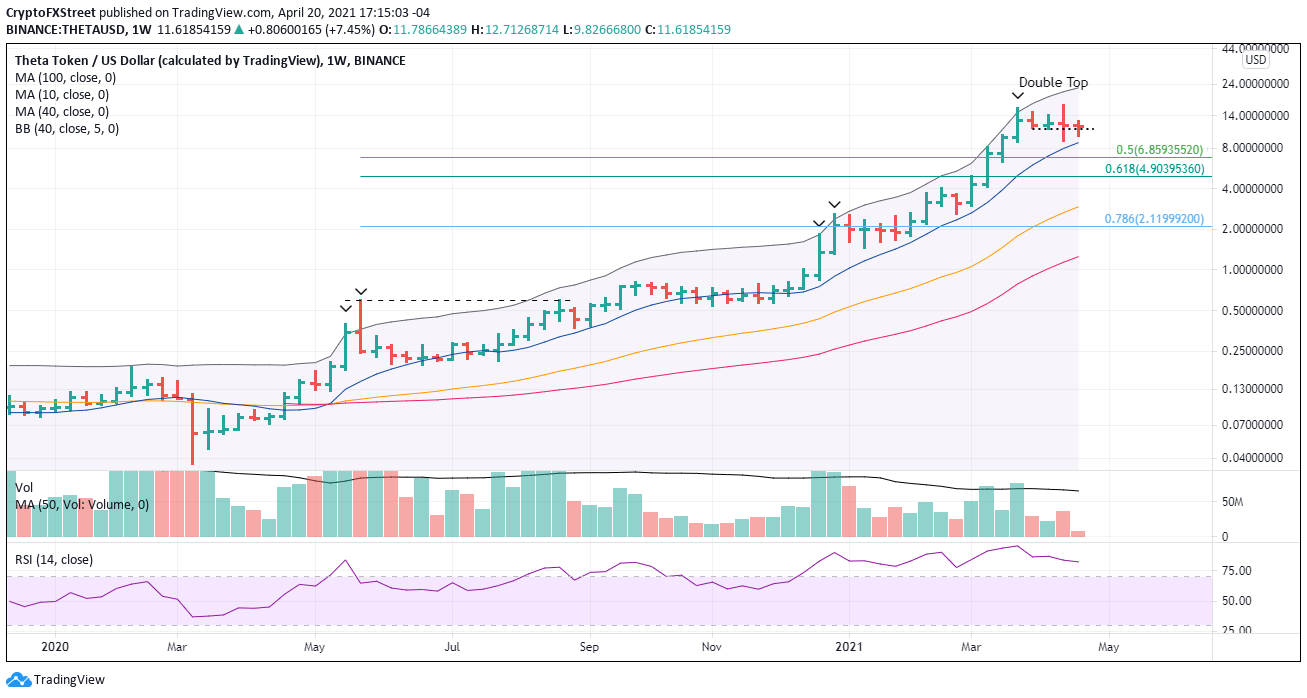
THETA/USD weekly chart
At this point, it is not possible to discern a bullish outcome for THETA. Still, speculators need to stay alert for intraday patterns that may emerge, providing high probability entry points for at least a dead-cat bounce.
Author

Sheldon McIntyre, CMT
Independent Analyst
Sheldon has 24 years of investment experience holding various positions in companies based in the United States and Chile. His core competencies include BRIC and G-10 equity markets, swing and position trading and technical analysis.



