Theta Price Prediction: THETA beginning a deep correction
- Theta price last reached five standard deviations above the mean last week.
- Historical precedent projects a decline of at least 45%.
- 10-week simple moving average (SMA) has stabilized price declines in the past.

Theta price engineered a remarkable advance of 44,160% from the March 2020 low to the March high. What makes it even more impressive is that the price has found constant support at or around the 10-week SMA since April 2020. Additionally, THETA traded five standard deviations (StdDEV) above the mean (40-week SMA) in March, putting traders on alert that a correction was near.
Theta price climbed 290% in March
Measuring the distance from the price to a moving average is a valuable tool to identify periods of extreme deviation that the naked eye can’t always pick up. In the case of THETA, the digital token has exceeded five standard deviations from the 40-week SMA just four weeks since the March 2020 low, including last week.
In May 2020, THETA reached more than five standard deviations above the mean for two straight weeks. The other time this occurred was in December 2020. In May, the altcoin crashed 65% but did find support at the 10-week SMA. Later in December, THETA dropped almost 45% but bottomed above the 10-week SMA.
Based on the previous percentages and averaging out the two to equal 55%, THETA could fall to $7.06, basically a decline of 40% from price at the time of writing. A test of the 10-week SMA would be an almost 50% decline from the current price and 60% from the March high.
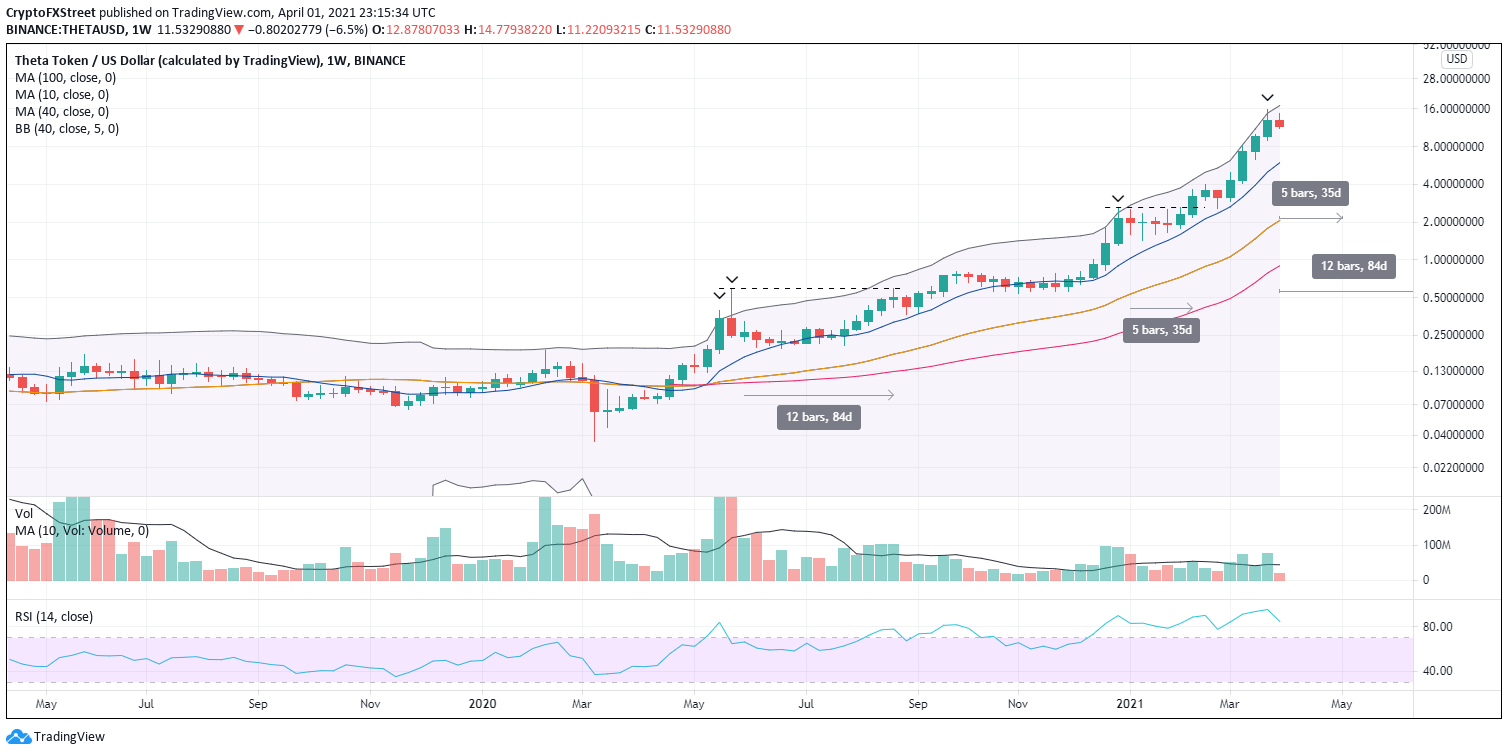
THETA/USD weekly chart
At the very least, THETA has entered a consolidation phase with the potential to extend into a notable decline. The short-term upside is limited and likely to be defined by quick intraday spikes.
Author

Sheldon McIntyre, CMT
Independent Analyst
Sheldon has 24 years of investment experience holding various positions in companies based in the United States and Chile. His core competencies include BRIC and G-10 equity markets, swing and position trading and technical analysis.


