Theta price analysis: THETA reaches all-time high levels and may face bearish correction
- THETA flashed the sell signal in the TD sequential in its 12-hour chart.
- THETA had a bullish breakout from the cup and handle pattern in the daily chart.

THETA flew up from $0.55 to $0.64 over the course of the day, reaching all-time high levels. However, the monthly chart has started flashing a sell sign.
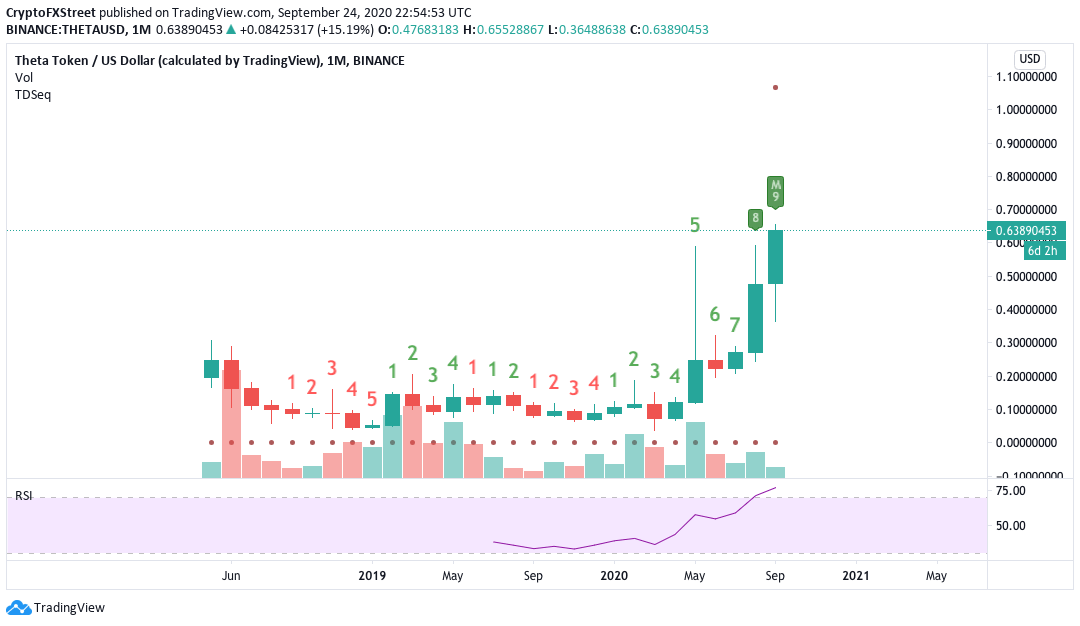
Along with the TD sequential, the relative strength index (RSI) in the monthly chart has crept into the overbought zone, showing that the asset is currently overvalued. So, are we going to see a reversal here? Let’s check out some of the other charts.
THETA/USD daily chart
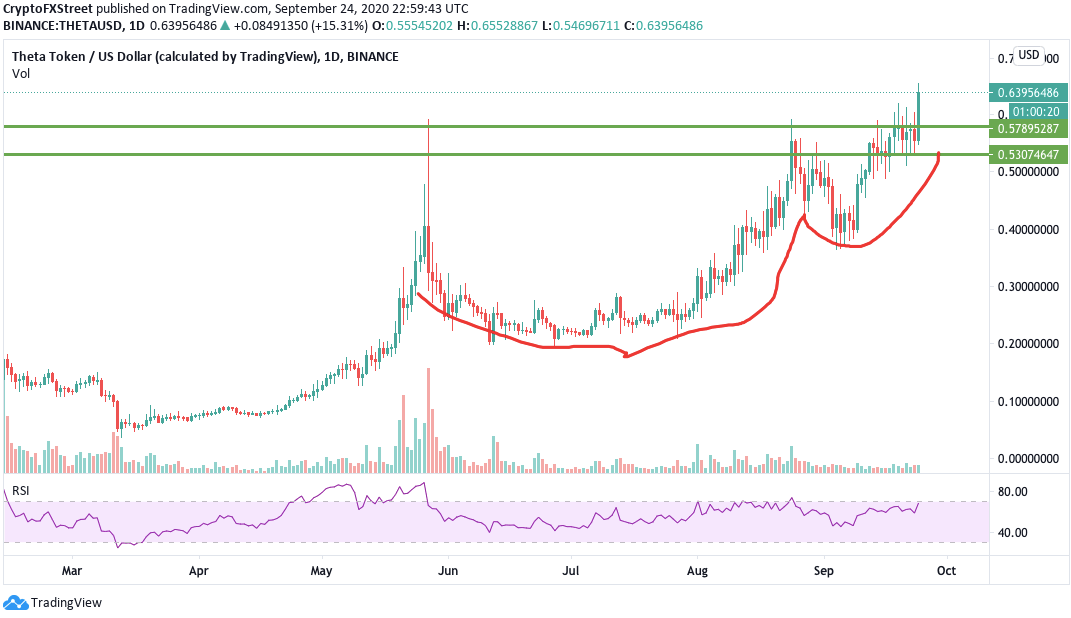
The daily chart has charted a cup and handle pattern, from which the buyers enjoyed a bullish breakout. However, the RSI is trending on the verge of the overbought zone as the price looks to open the doors for short-term bearish correction. To see how much the correction will be, let’s check the IOMAP.
THETA IOMAP
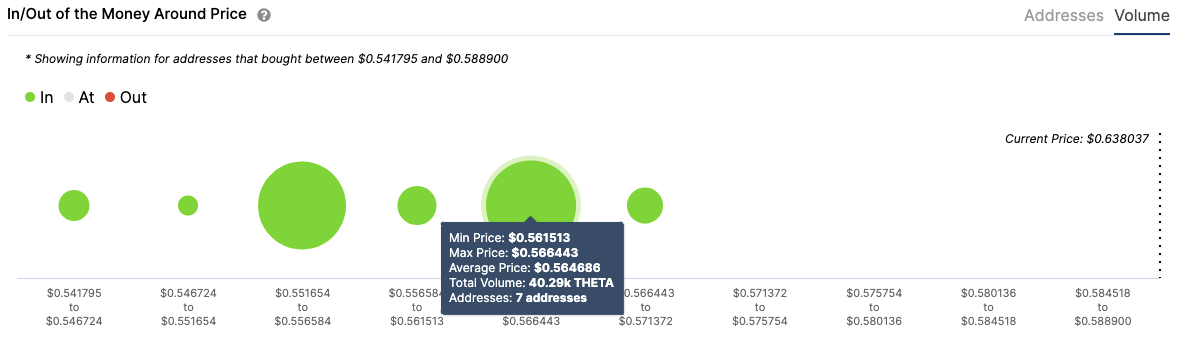
IntoTheBlock’s “In/Out of the Money Around Price” (IOMAP) model estimates that $0.564 plays a crucial role in THETA’s trend. Transaction history shows that this is the largest supply barrier underneath THETA. Previously, seven addresses had bought 40.29k THETA. On the upside, the price lacks healthy resistance levels since its currently in all-time high positions.
So, if the price does drop, it will fall till $0.564, where the healthy support wall should be able to absorb the selling pressure. However, if the bears turn out to be more relentless, the price has space to drop till $0.5545, before it encounters another healthy support level.
THETA 12-hour chart
-637365868813831010.png)
The THETA 12-hour chart shows that the MACD market momentum has reversed from bearish to bullish. However, the price has jumped above the 20-day Bollinger Band, which again indicates that the asset is presently overvalued and should face bearish correction. There is a mixture of different technical indicators, giving us a host of various clues as to what to expect next.
Verdict
So, what can we expect the price to do?
Different signs show us that we will see some short-term bearish correction as of now. Various indicators tell us that THETA is presently overvalued in these current levels. However, as you know, it's impossible to predict these things with 100% certainty. Cryptocurrencies are, after all, heavily governed by speculation. So, if the bulls do retain control, the IOMAP tells us that there is quite a lot of space growth as THETA hovers into hitherto uncharted territory.
Author

Rajarshi Mitra
Independent Analyst
Rajarshi entered the blockchain space in 2016. He is a blockchain researcher who has worked for Blockgeeks and has done research work for several ICOs. He gets regularly invited to give talks on the blockchain technology and cryptocurrencies.


