Theta Price Analysis: THETA exhibits bearish tendencies
- THETA/BTC’s 3-day chart shows that the price tends to plummet immediately after reaching a high.
- The number of new addresses entering the network has steadily dropped since reaching an August 24 high.

The weekly chart for THETA/BTC is on the verge of showing a sell signal, as per the TD sequential indicator. The relative strength index (RSI) has been hovering in the overbought zone.
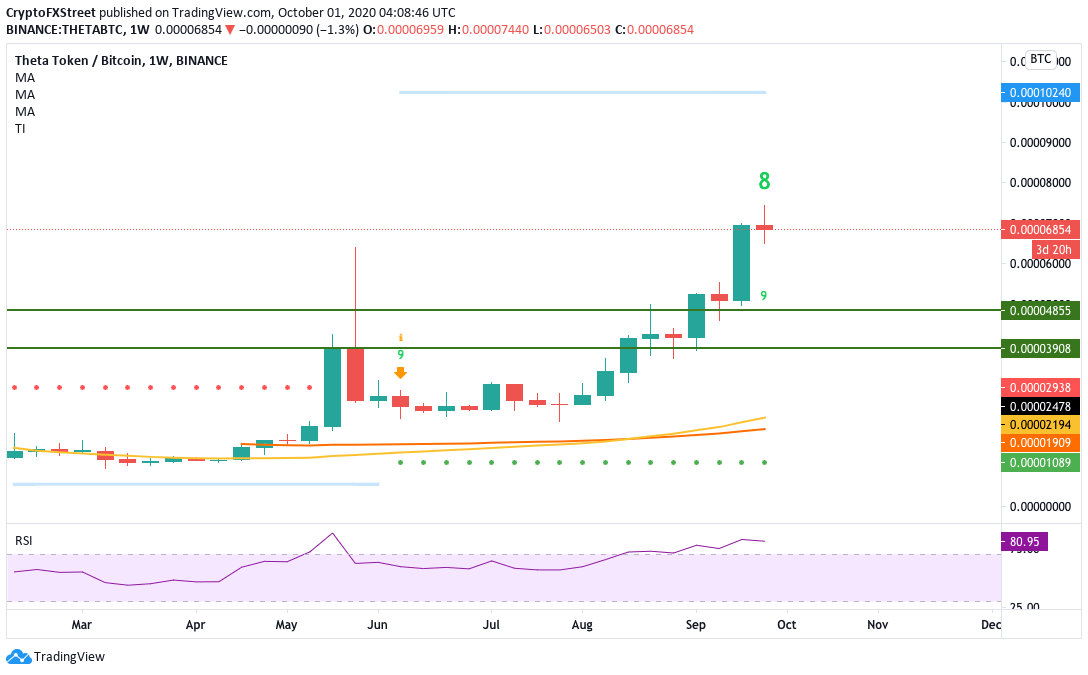
These two indicators show that we can expect some bearish price action in the weekly chart. Let’s look at the implications in the smaller time frames.
THETA/BTC 3-day chart
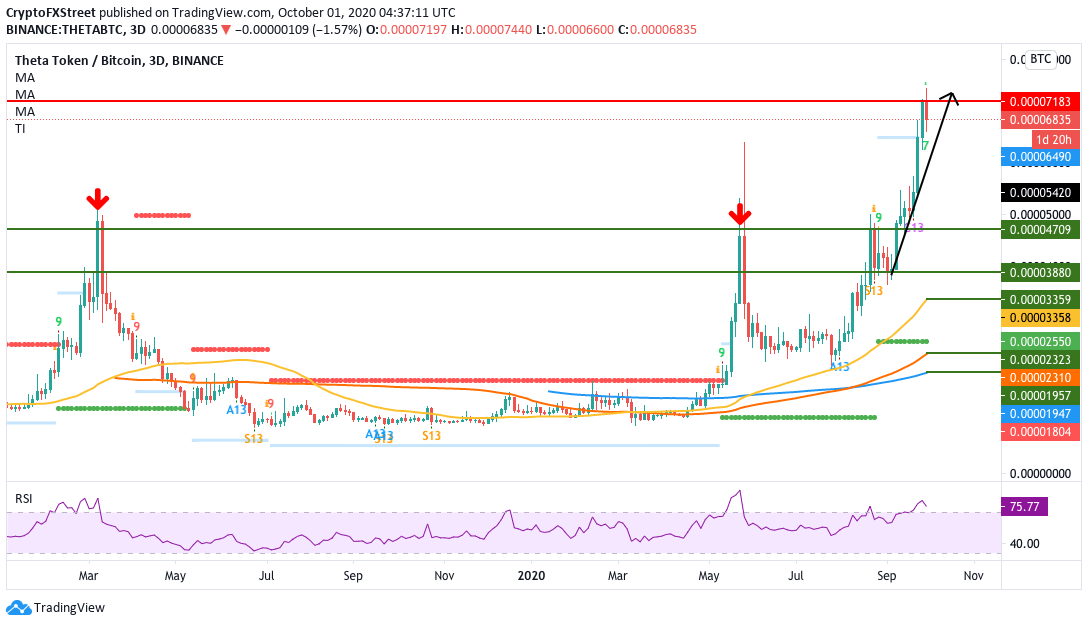
THETA/BTC has historically shown a tendency to make sharp bearish corrections after reaching a high.
Previously, in March 2019, THETA/BTC reached a high of 0.00049, following which it plummeted by 74.18% over the next two months to 0.0000127. After that, the price went through a length consolidation and reached a high of 0.000046 in late May 2020. However, the price then crashed by 47.78% and fell to 0.000024 in mid-June 2020.
Currently, THETA has reached new highs and is trending around 0.000068 BTC. Historically speaking, holders should now prep themselves for a plunge in price.
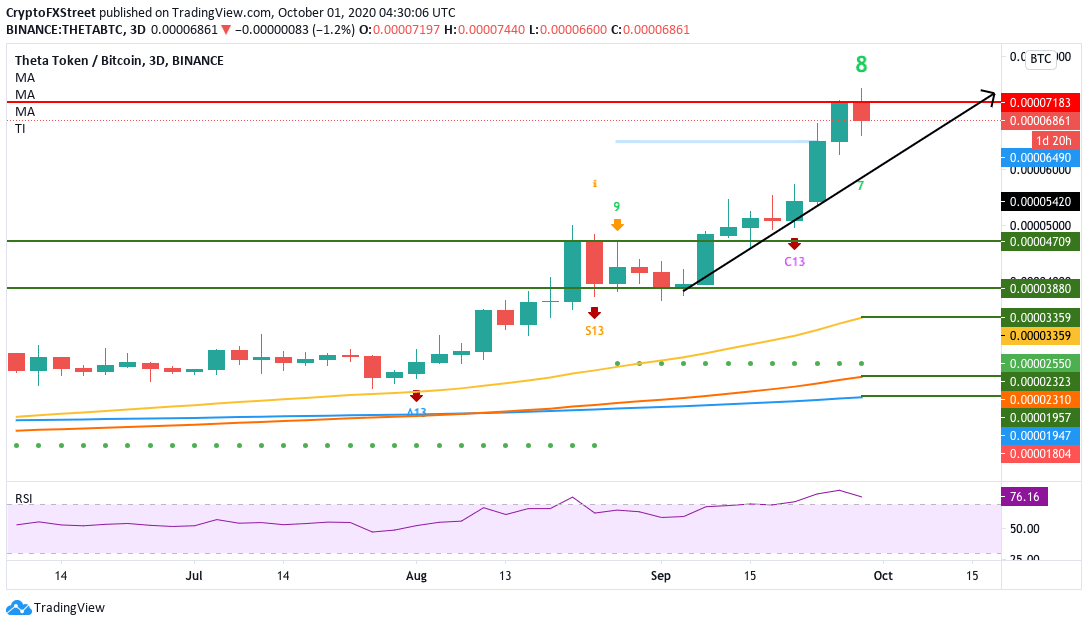
Quite like the weekly chart, is also about to flash the sell signal in the TD indicator. The RSI is also hovering in the overbought zone, which can trigger bearish price movement.
THETA/BTC 4-hour chart
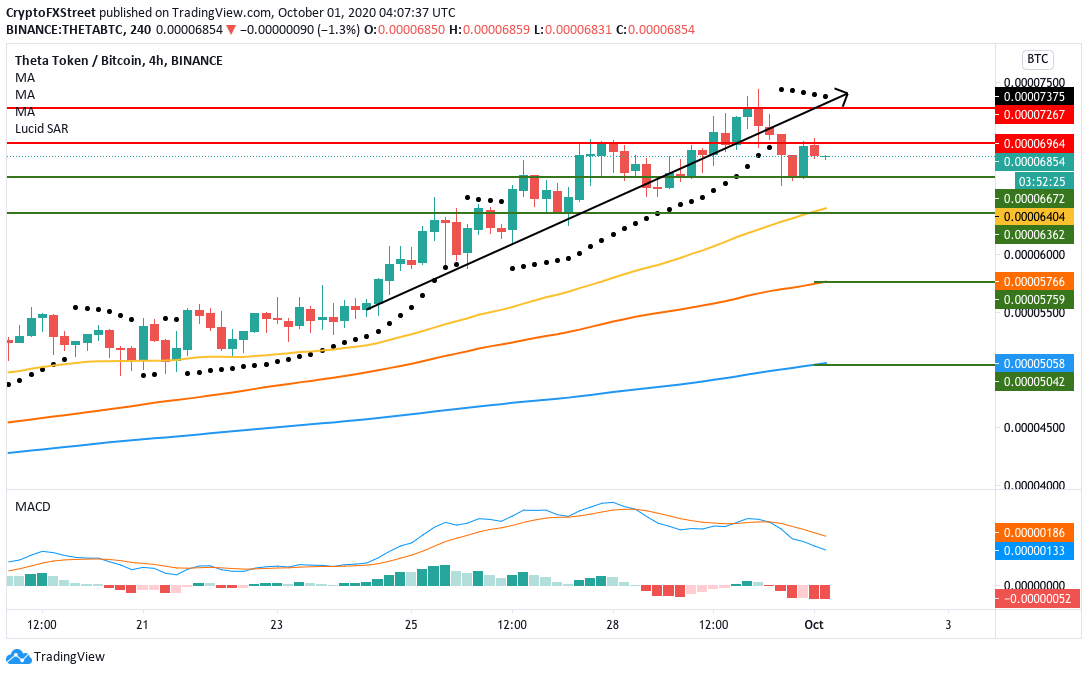
THETA/BTC 4-hour chart also shows bearish tendencies as the parabolic SAR has reversed from bullish to bearish. As shown in the chart above, the SAR reversed after the price failed at the 0.00007286 BTC resistance level and dropped below the upward trending line.
The MACD shows increasing bearish momentum, so we can expect the price drop below the 0.000067-level. If that does happen, the SMA 50 curve must hold firm to prevent any further downturn. If this support doesn’t keep, the THETA will drop down to the SMA 100.
THETA New Addresses
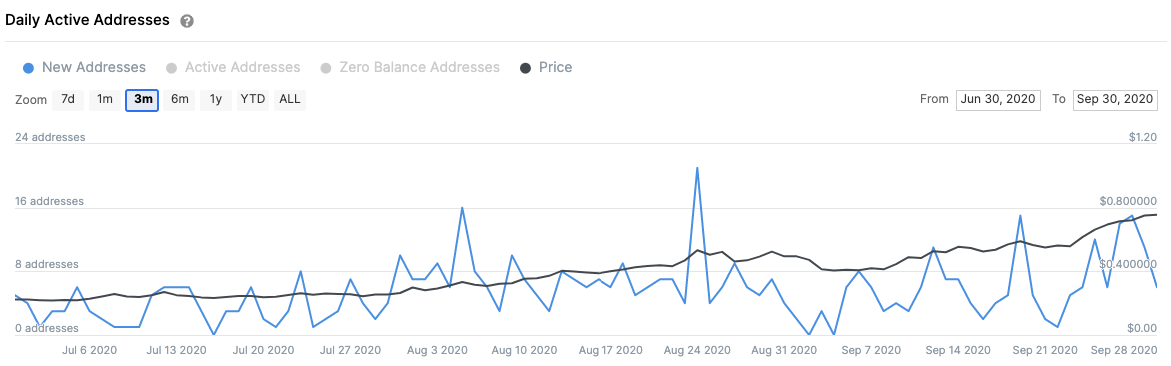
IntoTheBlock’s “Daily Active Addresses” model shows that the number of new addresses created on the THETA network topped-out on August 24 with 21 addresses per day, calculated on a 3-month trailing average. Since then, THETA’s network growth has declined by new active addresses per day. Only 6 new addresses were created at press time based on this trailing average, which can be considered a significant bearish sign for the decentralized video delivery network.
Author

Rajarshi Mitra
Independent Analyst
Rajarshi entered the blockchain space in 2016. He is a blockchain researcher who has worked for Blockgeeks and has done research work for several ICOs. He gets regularly invited to give talks on the blockchain technology and cryptocurrencies.


