These indicators show Terra’s LUNA 2.0 price will quadruple
- LUNA 2.0 price explores the possibility of a trend reversal as it sweeps the range low at $3.50.
- A recovery rally could propel LUNA to the range high at $10.24 and still have the chance of a further ascent.
- A daily candlestick close below the range low at $3.50 without a quick recovery would invalidate the bullish thesis

LUNA 2.0 price has been in a downtrend since May 30 and has finally reached the lower limit of its range, suggesting that a reversal is likely. Investors need to be careful because this bullish outlook could fail if bears keep LUNA below the range low.
LUNA 2.0 ready for a reversal
LUNA 2.0 price has finally swept the lower limit of the $3.50 to $10.20 range formed on May 28. After a brief move above the range high on May 30, LUNA was expected to take a U-turn and sweep the range low.
As of June 8, LUNA price has officially tagged the $3.50 support level, indicating that a shift in narrative is around the corner. Going forward, if the ranges are to hold, LUNA's reboot should recover quickly above the range low at $3.50 and start rallying higher.
The first stop for this move would be the midpoint of the range at $6.85. This run-up would constitute a 96% ascent. However, the ideal scenario would include LUNA 2.0 price attempting to revisit the range high at $10.20.
This climb would represent a 190% gain and is likely where the short-term ceiling is present for LUNA bulls. However, considering the brutal sell-off from its all-time high at $30, the $10.24 level is hardly a place for rest.
If the bulls have high conviction, they are likely to push LUNA 2.0 price to revert to the mean. Drawing a Fibonacci retracement tool from $30 to $3.50 shows that the midpoint of this crash is at around $16.75. From the current position, this would result in a 392% gain for the average investor.
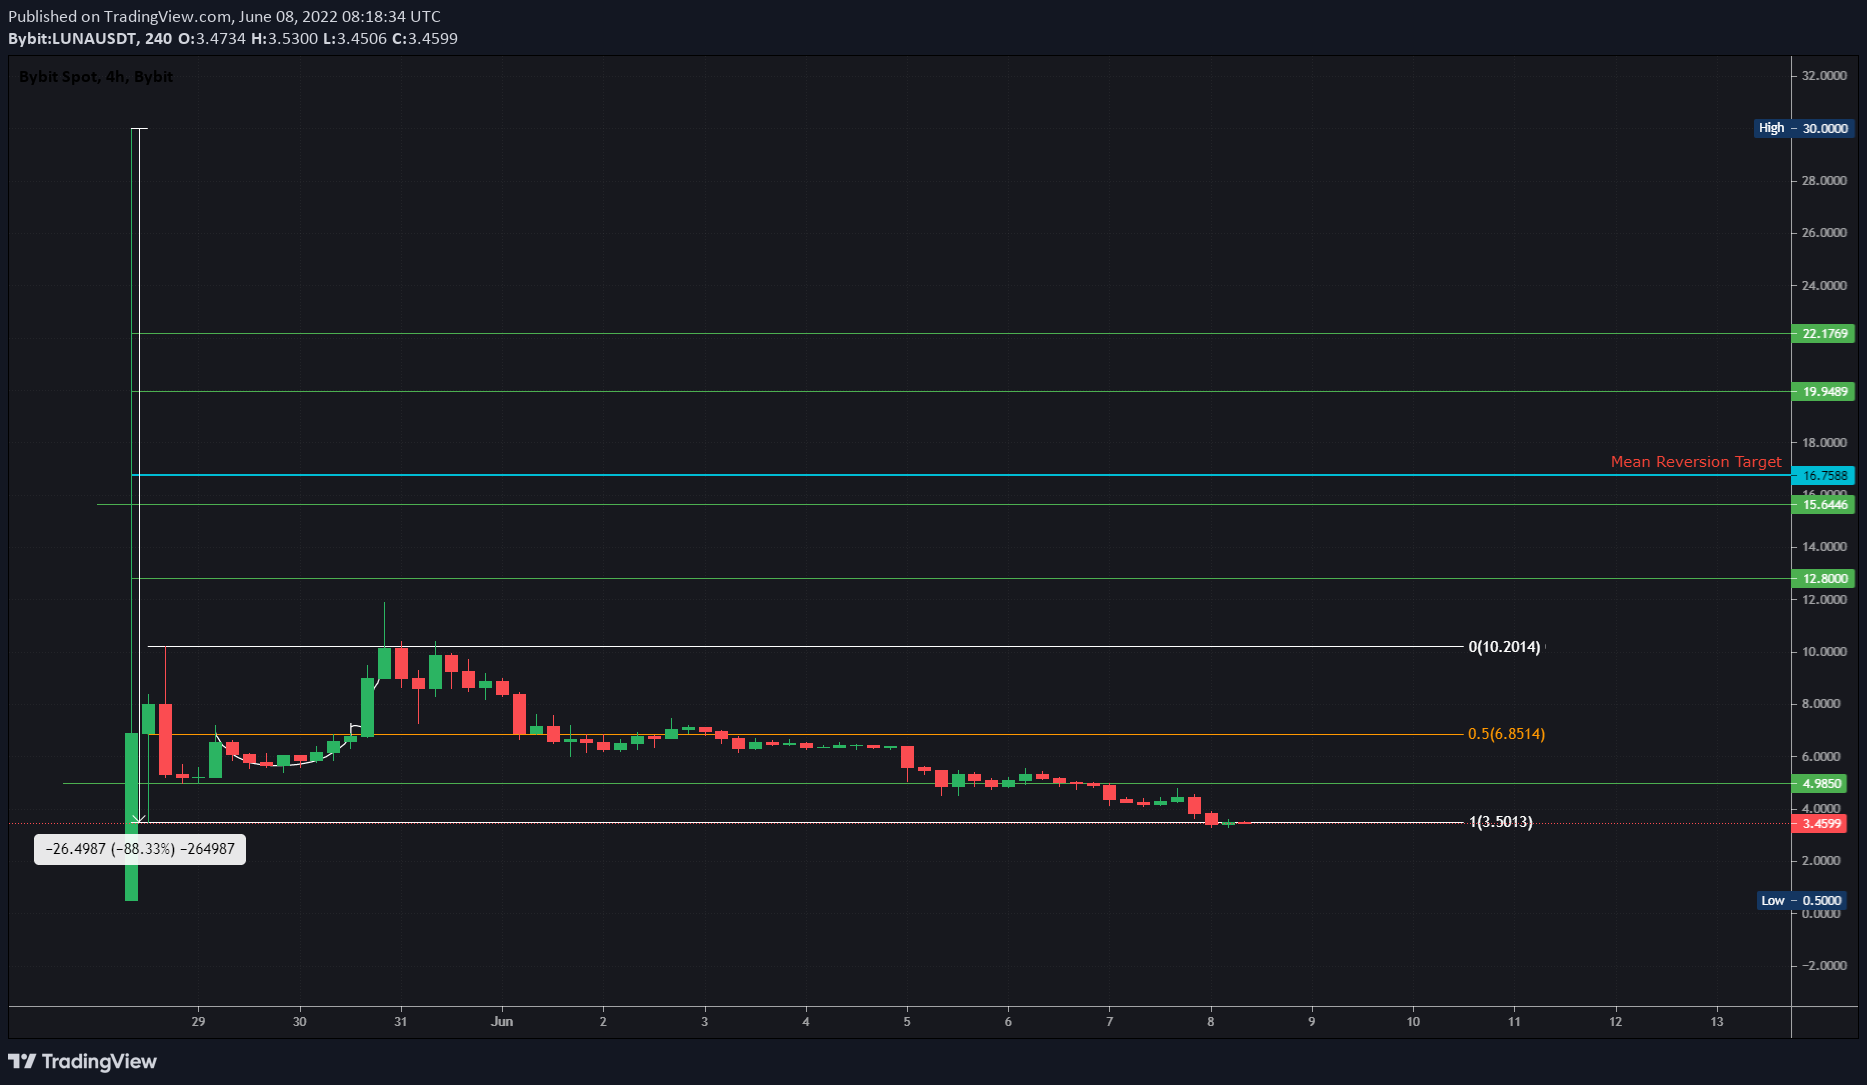
LUNA/USDT 1-hour chart
Further supporting a trend shift for LUNA 2.0 price is the Relative Strength Indicator (RSI). This index is a momentum-based oscillator that helps monitor both the current, as well as historical, strengths and weaknesses of a particular market.
After a massive crash, the RSI is hovering below 30 aka the oversold zone. Often, when an asset reaches the oversold zone, there is a shift in momentum from bears to bulls, suggesting that the buyers are taking over. Ultimately, this leads to a reversal of the underlying asset’s price.
Interestingly, this outlook falls in line with the technicals, which are also forecasting a shift in trend after the sweep of the range low at $3.50.
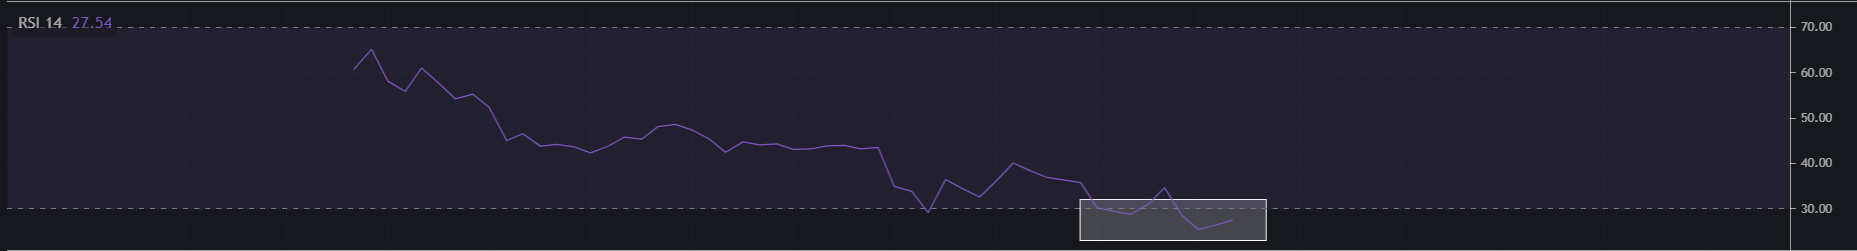
Relative Strenght Index
Adding credence to the optimistic narrative for LUNA price is the Awesome Oscillator indicator, which is used to measure the market momentum. More importantly, this indicator is forming ‘bullish twin peaks’.
Bullish twin peaks occur when there are two peaks below the zero line. The second peak is higher than the first peak and is followed by a green bar. Additionally, the trough between the two peaks must remain below the zero line.
For LUNA 2.0, however, the Awesome Oscillator is yet to print a green line in the second peak.
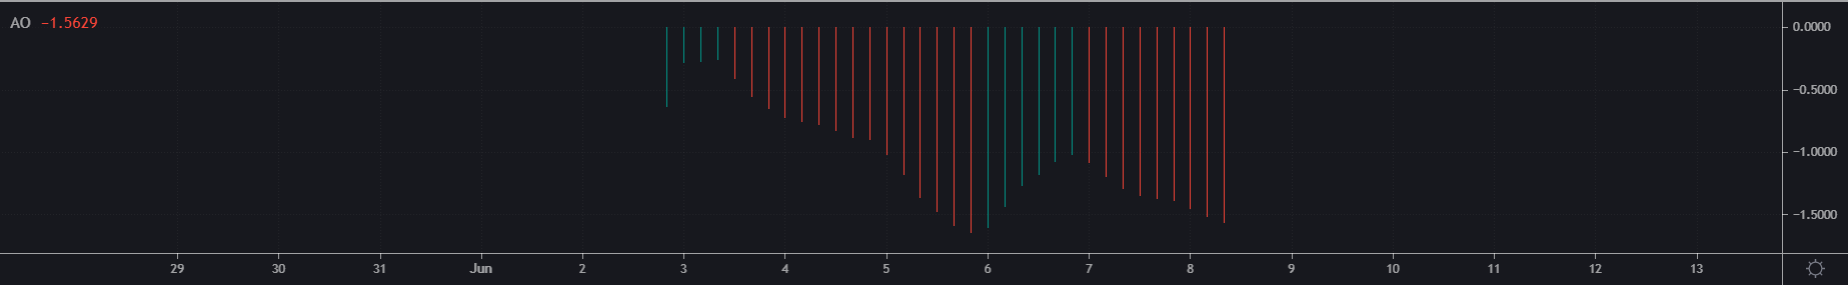
Awesome Oscillator
While the outlook seems overly bullish for LUNA 2.0 price, a daily candlestick close below the range low at $3.50 without a quick recovery would invalidate the bullish thesis. In such a case, LUNA could crash to its listing price at $0.50.
Author

Akash Girimath
FXStreet
Akash Girimath is a Mechanical Engineer interested in the chaos of the financial markets. Trying to make sense of this convoluted yet fascinating space, he switched his engineering job to become a crypto reporter and analyst.


