The Graph Price Prediction: GRT stares at 70% upswing after breaching crucial level
- The Graph price sliced through the $0.974 resistance barrier, hinting at a move higher.
- GRT will face a major headwind around $1.255, but shattering it will open the path to $1.675.
- A breakdown of the $0.760 support level will invalidate the bullish thesis.

The Graph price showed a strong move that shattered a crucial resistance level on August 20. This ascent could be a precursor to further gains in the near future.
The Graph price contemplates a new swing high
The Graph price rallied nearly 70% since August 9. However, its recent run-up on the daily time frame pushed through the $0.974 resistance level. If this daily candlestick closes above the said barrier, it will serve as initial confirmation of a new uptrend’s start.
In such a case, GRT will likely retest $0.974 or continue its ascent to the immediate supply ceiling at $1.255. If the bid orders push the Graph price to produce a decisive close above the said level, it will open the path to $1.675.
If such a move were to occur, it would represent a 72% upswing from $0.974.
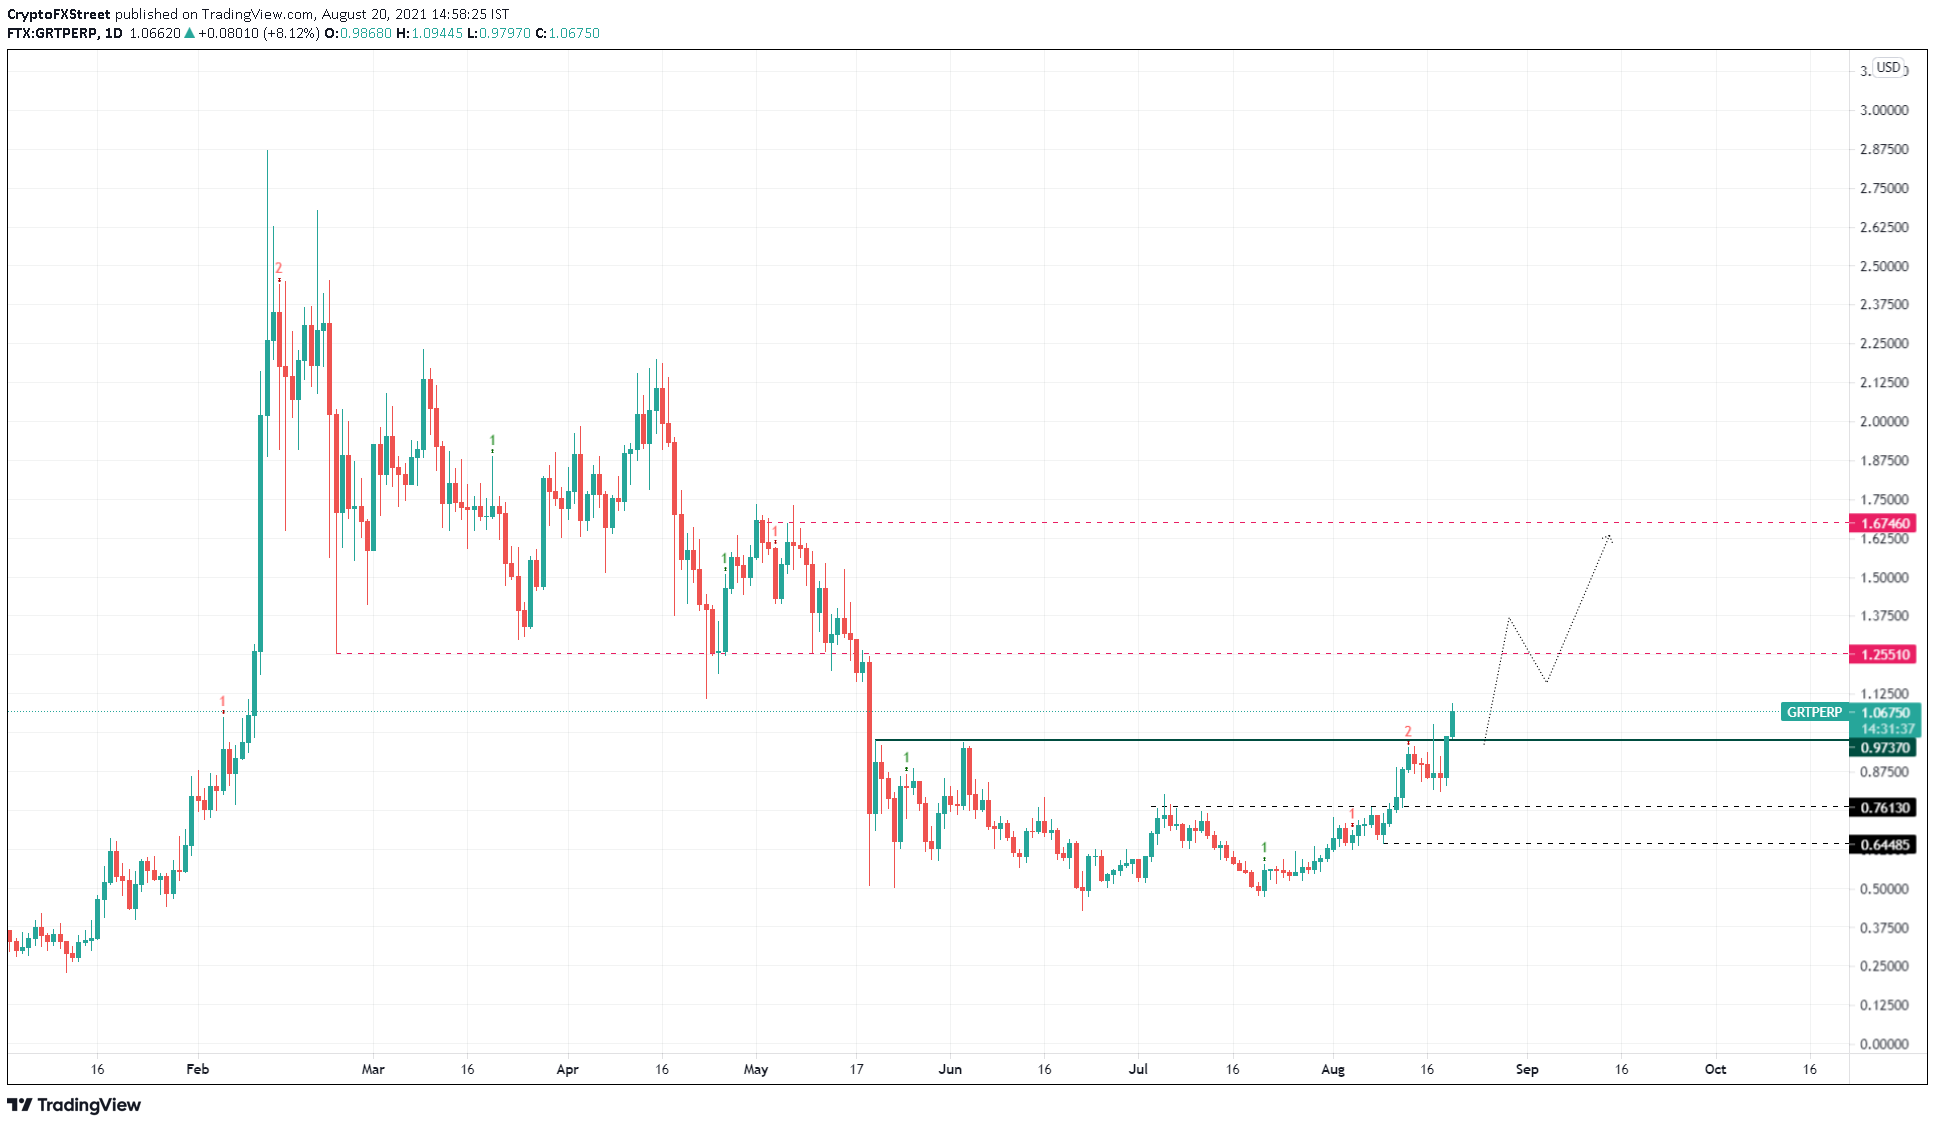
GRT/USDT 1-day chart
While the upswing seems reasonable, investors need to watch out for bulls’ exhaustion. Such a development might happen after The Graph price retests the $1.255 resistance level. If bulls fail to follow through, there is a high chance GRT might continue to head lower and, in some cases, retest $0.974.
If the buyers fail to make a comeback, GRT could head as low as $0.761, a breakdown of which will invalidate the bullish thesis. This move could trigger profit booking among panicking investors, pushing GRT to the next stable support level at $0.645.
Author

Akash Girimath
FXStreet
Akash Girimath is a Mechanical Engineer interested in the chaos of the financial markets. Trying to make sense of this convoluted yet fascinating space, he switched his engineering job to become a crypto reporter and analyst.


