The Graph Price Prediction: GRT eyes 22% drop to retest crucial demand barrier
- The Graph price is consolidating near the upper trend line of a descending triangle pattern.
- A 22% drop toward the lower trend line seems likely after getting rejected by the hypotenuse.
- Breakdown of the horizontal support level at $1.30 will most likely trigger a 54% sell-off.

The Graph price shows the inability of buyers to push beyond the consolidation pattern’s upper boundary. This failure could drag GRT toward the next immediate demand barrier.
The Graph price initiates reversal
The Graph price has created the third lower high since the second week of February. During this period, GRT has bounced twice off the horizontal support level at $1.30. Extending the trend lines that connect these swing highs and series of lows shows the formation of a descending triangle pattern.
Regardless of where it is formed, this technical formation is bearish. A breakdown of the flat demand barrier at $1.30 will confirm a 54% breakout to $0.59. This target is determined by adding the distance between the pivot high and the first swing low to the breakout point.
The daily chart shows the Graph price’s fresh rejection at the upper trend line, suggesting a lack of bullish momentum that has triggered a downtrend. The likely course of action for GRT is to head toward $1.30, which is a 22% drop.

GRT/USD 1-day chart
Based on IntoTheBlock’s In/Out of the Money Around Price (IOMAP) model, the supply barriers are stacked and in large numbers as compared to the support levels. The only stable demand barrier that could prevent a sell-off is at $1.69. Here roughly 1,350 addresses hold 32 million GRT tokens.
Therefore, a sudden spike in selling pressure could easily put these investors underwater, triggering a crash.
So long as the Graph price manages to stay inside the consolidation pattern, things don’t look bleak. However, breaching the $1.30 level would turn this into a highly bearish scenario that could warrant a drop to the immediate demand barriers at $1.05, $0.77, and $0.59.
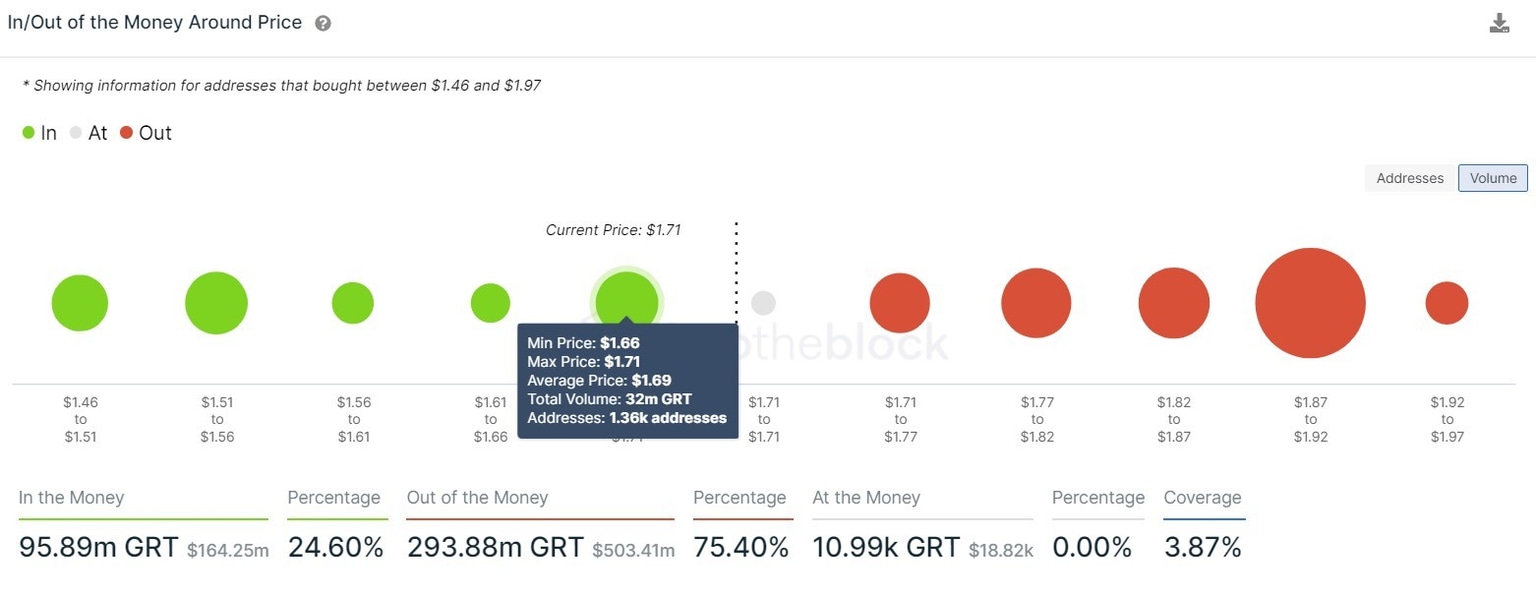
The Graph IOMAP chart
Further supporting the bearish outcome is a 10% decrease in whales holding 10,000 to 100,000 GRT tokens. This decrease suggests that whales are uninterested in the Graph price, indicating that they might be reallocating or booking profits.
%2520%5B09.14.49%2C%252001%2520Apr%2C%25202021%5D-637528457130959782.png&w=1536&q=95)
The Graph holder distribution chart
The outlook might turn bullish if the Graph price slices through the upper trend line invoking a decisive close above $1.89.
If this were to happen, GRT bulls could further propel the token by 42% toward $2.57.
Author

Akash Girimath
FXStreet
Akash Girimath is a Mechanical Engineer interested in the chaos of the financial markets. Trying to make sense of this convoluted yet fascinating space, he switched his engineering job to become a crypto reporter and analyst.


