Tezos price shows signs of potential consolidation down to $6.6
- Tezos price is contained inside an ascending wedge pattern on the 4-hour chart.
- The digital asset could get rejected again from the upper trendline resistance.
- A breakout would lead Tezos to new all-time highs.

Tezos has just formed a new all-time high on April 16 at $7.48 but the digital asset didn’t see any kind of continuation which gives bears the upper hand. Several indicators show XTZ could be on the verge of a correction.
Tezos price faces significant selling pressure
On the 4-hour chart, Tezos is trading inside an ascending wedge pattern and just got rejected from the upper trendline again.
The Parabolic SAR indicator has turned bearish again and shows that Tezos is at a sell level. In the past week, this indicator has been reliable which adds credence to the bearish outlook. The nearest bearish price target is the lower trendline support at $6.6.
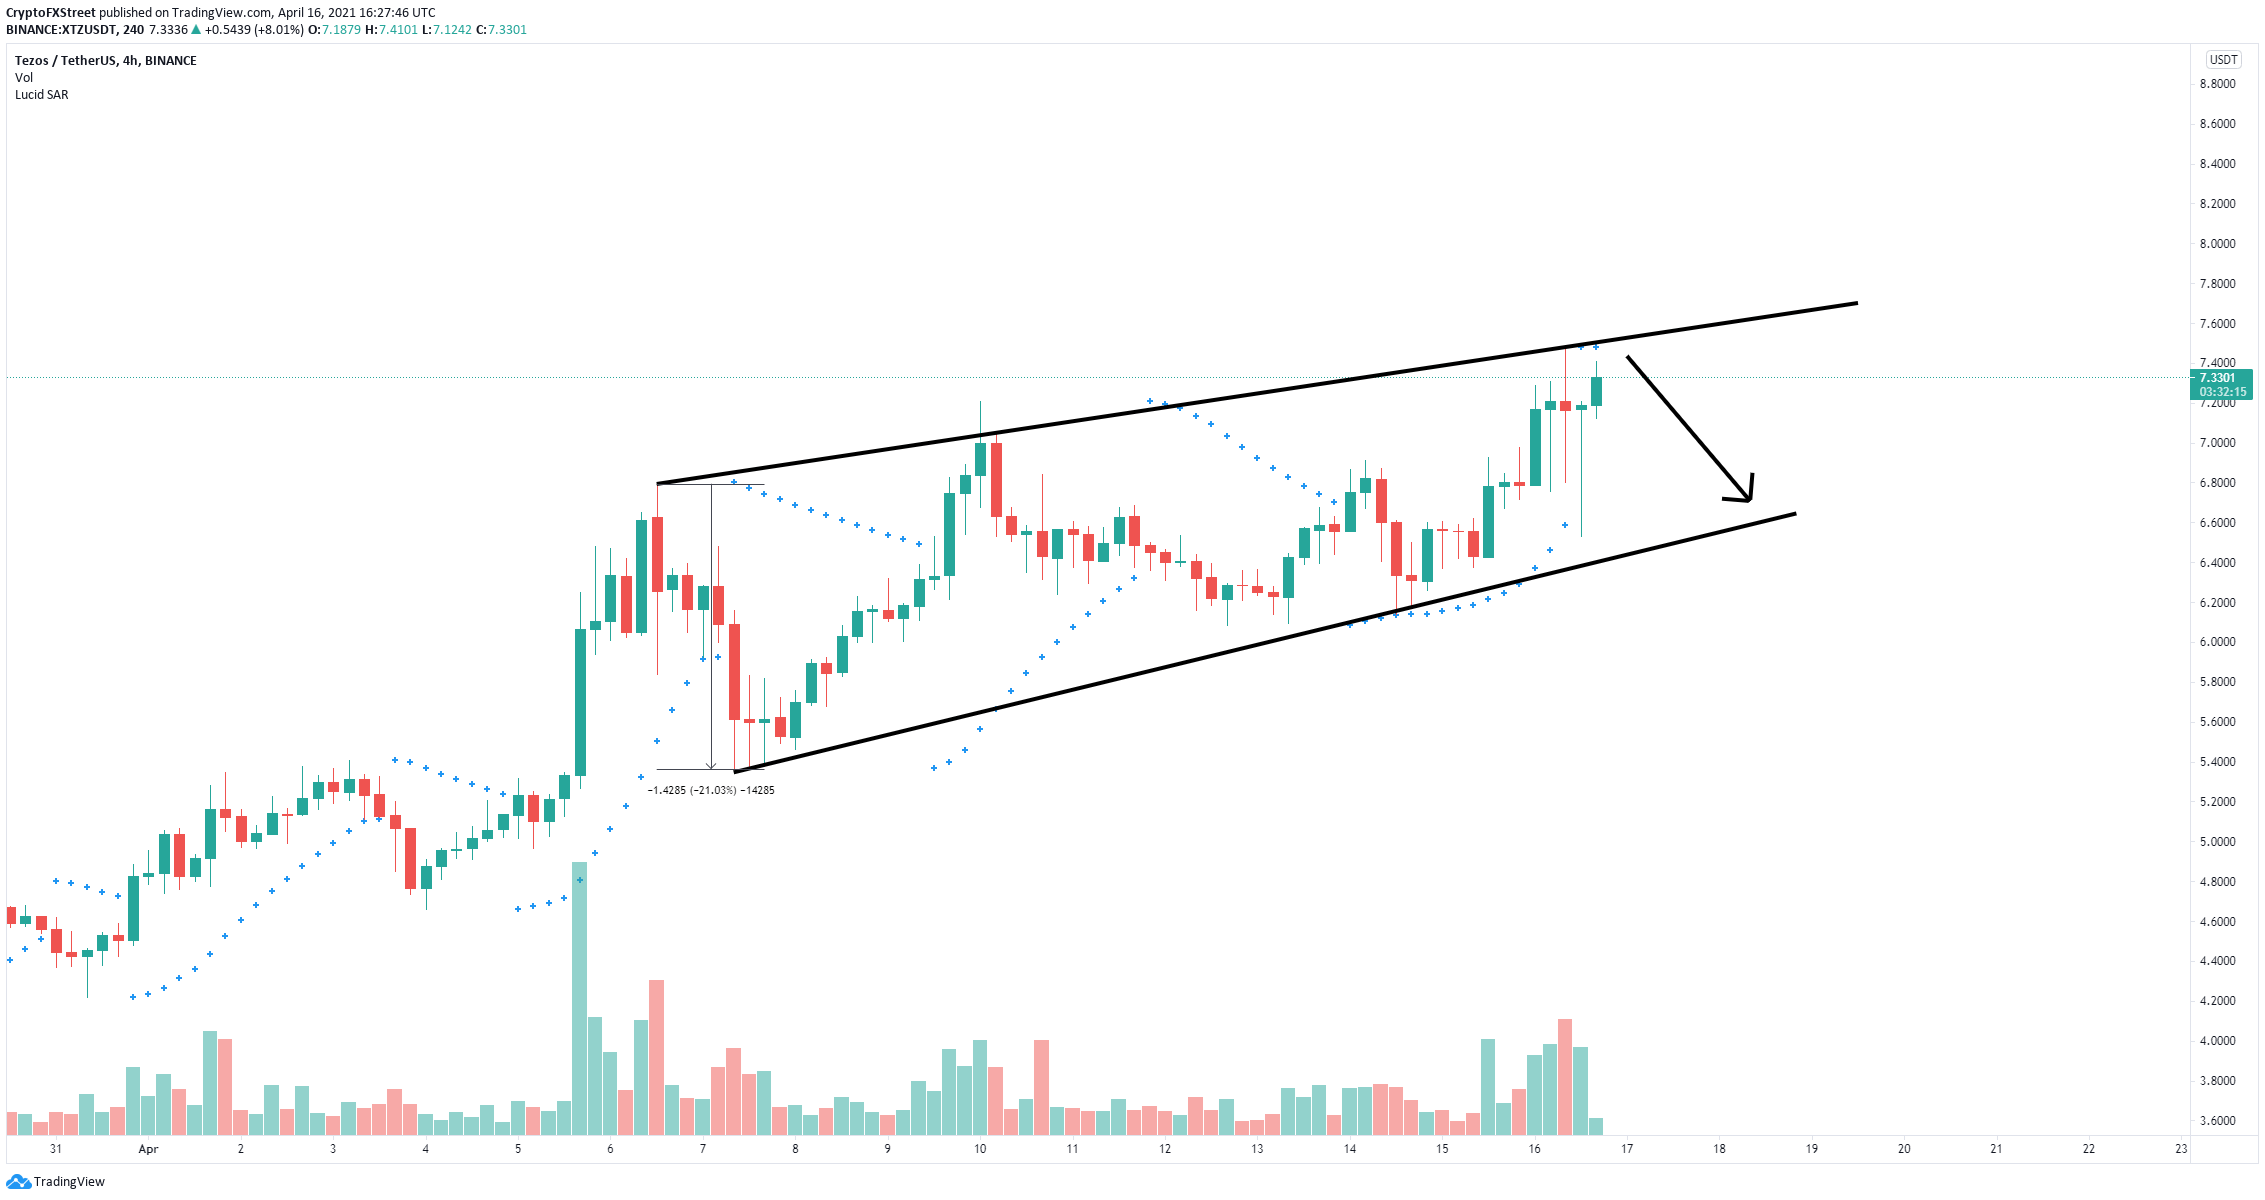
XTZ/USD 4-hour chart
However, the current price of Tezos is closer to a breakout than anything else. The key resistance level at $7.55 is not far. A 4-hour candlestick close above it will confirm a breakout that has a 21% upswing target.
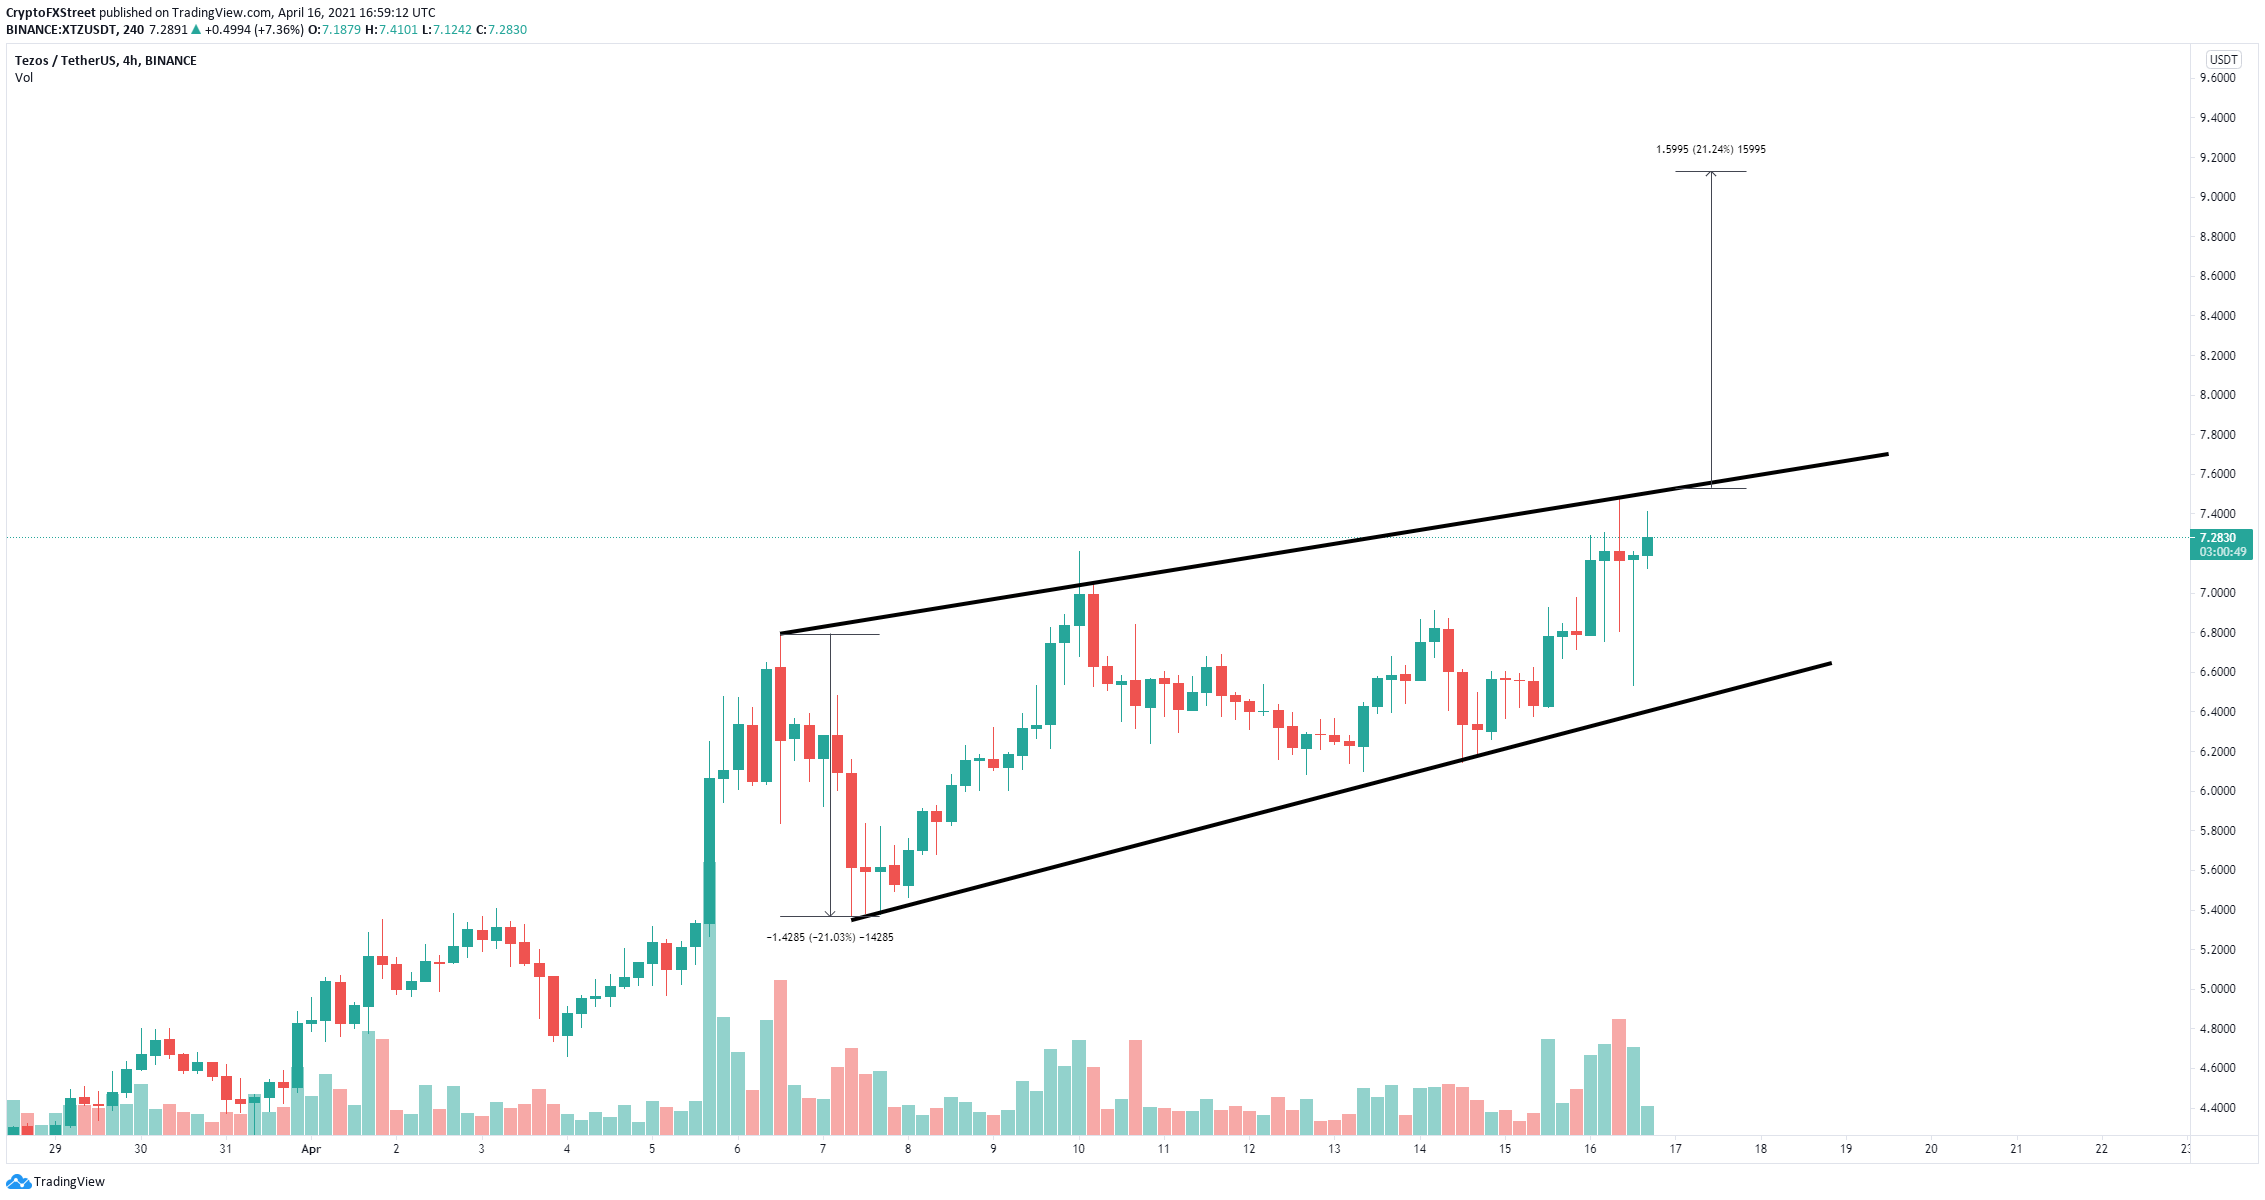
XTZ/USD 4-hour chart
This price target is calculated by measuring the distance between the beginning of the upper trendline and the lower one. The 21% move will take Tezos to $9.1 in the long-term and $8 as an initial psychological price target.
Author

Lorenzo Stroe
Independent Analyst
Lorenzo is an experienced Technical Analyst and Content Writer who has been working in the cryptocurrency industry since 2012. He also has a passion for trading.


