Tezos Price Forecast: XTZ at the Launchpad ready for a colossal technical breakout
- Tezos appears to have secure formidable support, paving the way to ongoing recovery.
- Price action above the 100 SMA would cement the bulls’ influence over the price.
- Trading above the descending parallel channel’s upper edge could see a massive upswing toward $5.
- Resistance at $4 will either sabotage or delay the upswing toward $0.5.

Tezos is embracing a bullish impulse following the correction from the monthly high of $4.64. Declines from the first week of March occurred within the confines of a descending parallel channel, as illustrated on the chart. Support at $3.6 allowed bulls to shift their focus upward. Meanwhile, XTZ is moving closer to a breakout, eying highs beyond $5.
Tezos uptrend must overcome this crucial hurdle
XTZ is trading at $3.95 amid the persistent push by the bulls to hit higher highs. The 100 Simple Moving Average (SMA) on the 4-hour chart caps the immediate upside. Overcoming this hurdle is critical to the bulls because it clears the path for a potential technical breakout.
Note that the Moving Average Convergence Divergence (MACD) validates the strengthening bullish front. A MACD crosse into the positive region will bolster buyers to higher levels. Besides, the MACD line (blue) has settled above the signal line, suggesting that XTZ is in the hands of the bulls.
On the other hand, Tezos is trading in the upper zone of a descending parallel channel. The middle support seems to have been strongly reinforced; thus, the least resistance path is upwards. Simultaneously, a break above the channel’s upper boundary may trigger massive buy orders, which will intensify the tailwind and catalyze the upswing toward $0.5.
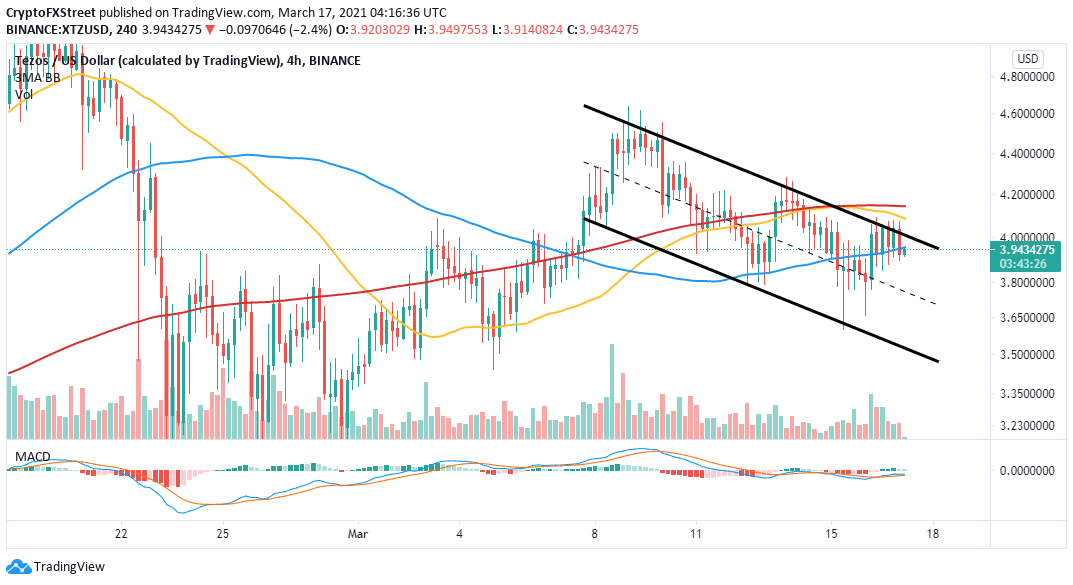
XTZ/USD 4-hour chart
The Parabolic SAR has also validated the bullish outlook. The indicator recently moved below the price, adding credence to the uptrend. As long as the Parabolas (dots) stay under the price, Tezos will continue with the breakout.
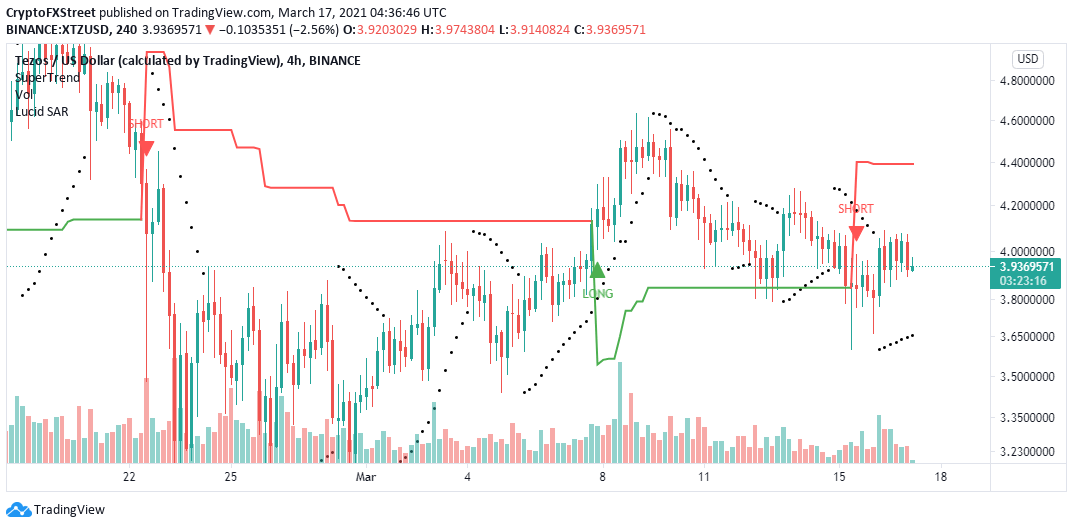
XTZ/USD 4-hour chart
Looking at the other side of the fence
Despite the improving technical picture based on the above analysis, Tezos is not out of the woods yet based on the 4-hour SuperTrend indicator. This technical indicator has recently flipped bearish by sending a signal to short Tezos. Therefore, there is a bearish cloud hovering above XTZ, likely to hinder the upswing.
Author

John Isige
FXStreet
John Isige is a seasoned cryptocurrency journalist and markets analyst committed to delivering high-quality, actionable insights tailored to traders, investors, and crypto enthusiasts. He enjoys deep dives into emerging Web3 tren



