Terra’s LUNA price remains at risk of crashing hard
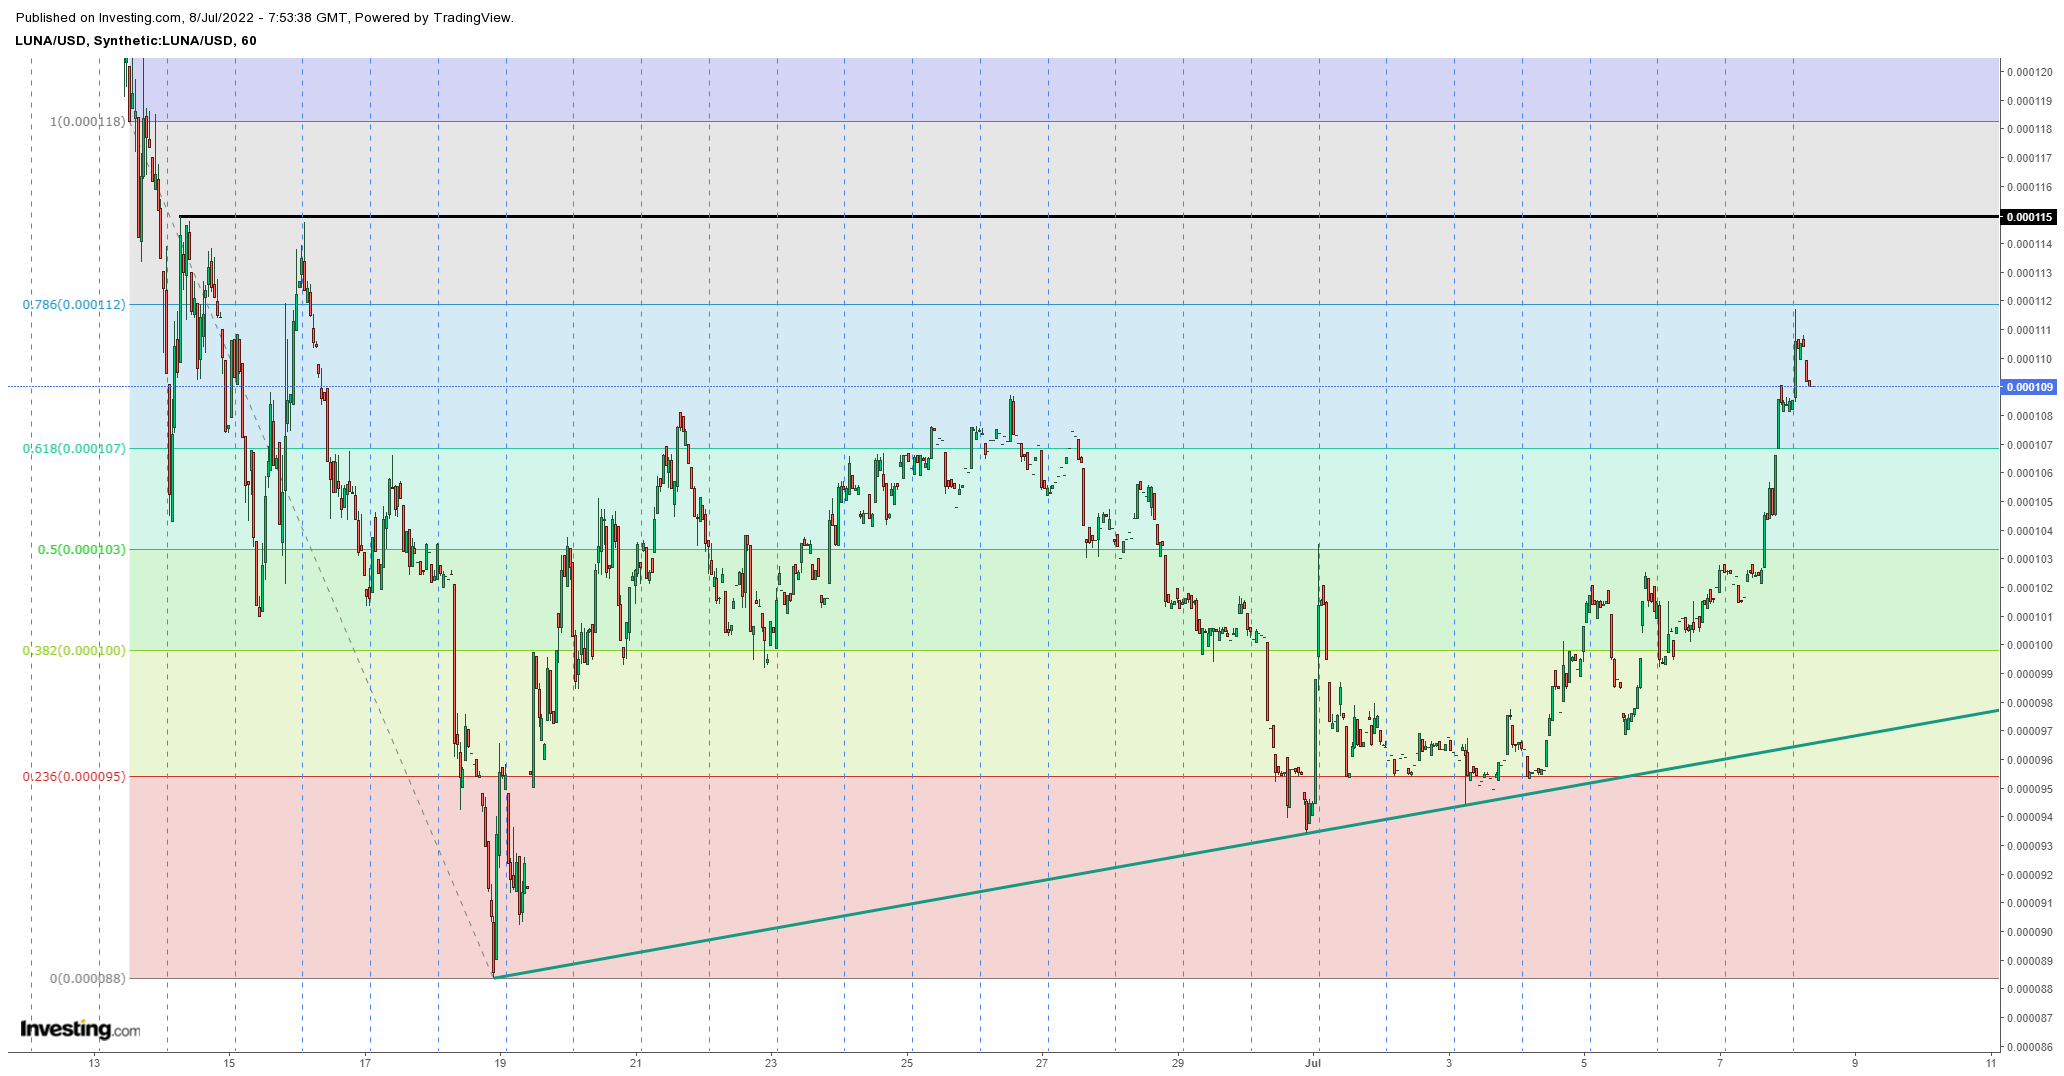
- Terra price almost rallied to the 78.6% Fibonacci level of the June decline, at $0.000112, in early ASIA PAC trading.
- Since then, profit-taking has seen a fade and risks a collapse to the 23.6% Fibonacci, at $0.000095, and10% drop.
- The nervousness in LUNA price, with violent moves in swings within hours, shows it should not be traded by the weak-hearted.

Terra (LUNA) price is fading a tad in European trading as the ASIA PACIFIC session saw a rally initially continuing from Thursday evening towards $0.000112, and the 78.6% Fibonacci level of the mid-June decline. The move started during US trading hours on Thursday as equities rallied strongly, and the risk-on theme dominated in several asset classes. Now sentiment has changed, LUNA price has pulled back and there is a risk of a full collapse back to $0.000097 for a loss of over 10%.
LUNA price at risk of paring back incurred gains from Thursday
Terra price has been printing solid gains since the start of July, with a gain of over 17% booked in total. Thus far, the good news for LUNA price action is that it was in dire need of some relief after the battering it took in the first half-year of 2022. Technically it all made sense with excellent support at $0.000095 or the 23.6% Fibonacci level, holding quite well and then a steam roller rally up towards $0.000112, or the 78.6% Fibonacci level, and all on the back of dollar strength.
LUNA price, however, sees a fade unfolding this morning in the European session, which could spell trouble. Bulls will not bother buying below $0.000107, for example, at the 61.8% Fibonacci level, and will instead want to wait for a lower level to reenter the rally. This makes the steep rally unsustainable and could trigger a full paring back towards $0.0001000 near the 38.2% Fibonacci level, or support along the green ascending trendline near $0.000098.
LUNA/USD hourly chart
As already mentioned above, a few Fibonacci levels are set up to be quite interesting. Certainly, the $0.000107 level at 61.8% is key, bolstered by the fact it is where the market performed an evening gap between the close of one candle and the open of the next candle. A brief dip below the 61.8% Fibonacci level could fill that gap and be used as an entry point for bulls to rally up to the next target at $0.000115, which is a very technical level going forward.
Author

Filip Lagaart
FXStreet
Filip Lagaart is a former sales/trader with over 15 years of financial markets expertise under its belt.


