Can Terra’s LUNA price recover after an 88% crash?
- LUNA price shows an opportunity and two ways how traders can profit from it.
- Investors can expect the altcoin to reverse and trigger its recovery rally to $3.5 or higher.
- A daily candlestick close below $1.69 will invalidate the bullish thesis for Terra.

LUNA price has been consolidating in a tight range since June 30 and shows no signs of directional bias. However, investors should be prepared for a quick and volatile move to emerge as soon as Bitcoin develops a bullish bias to retest the 200-week Simple Moving Average (SMA).
LUNA 2.0 price and its state
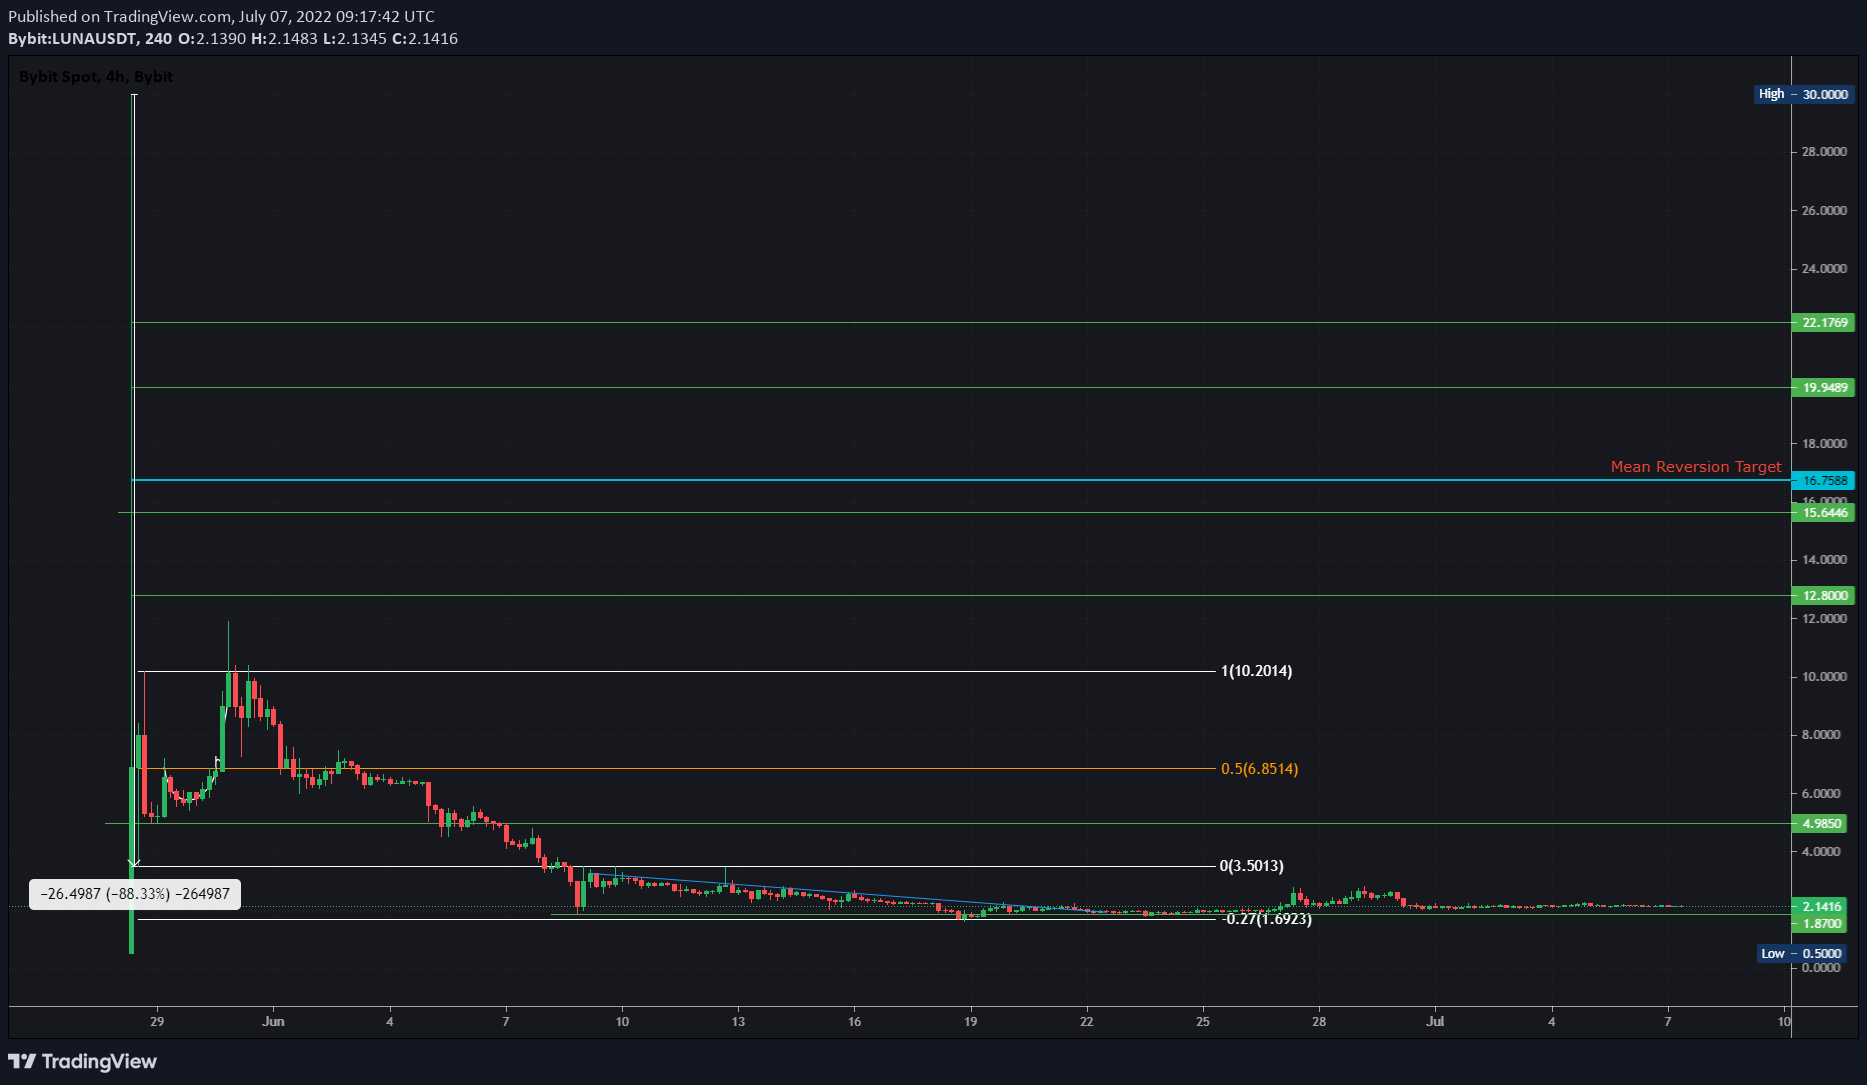
LUNA price – or the newly launched version of LUNA – was extremely volatile after it launched. The altcoin rallied from $0.5 to $30 in a matter of hours but retraced 88% equally quickly to $3.5. Even after this catastrophic fall, the altcoin remained highly volatile and largely uncorrelated to the large crypto market.
This characteristic is what made LUNA 2.0 interesting. The altcoin created a range, extending from $3.5 to $10 and swept the highs. However, the bullish momentum had by then been exhausted, and the gains ceased, and price started pushing lower.
After slipping below the range low at $3.5, LUNA 2.0 set equal highs around this level in an attempt to recover but failed. Since then, Terra has been consolidating and is currently trading at $2.13.
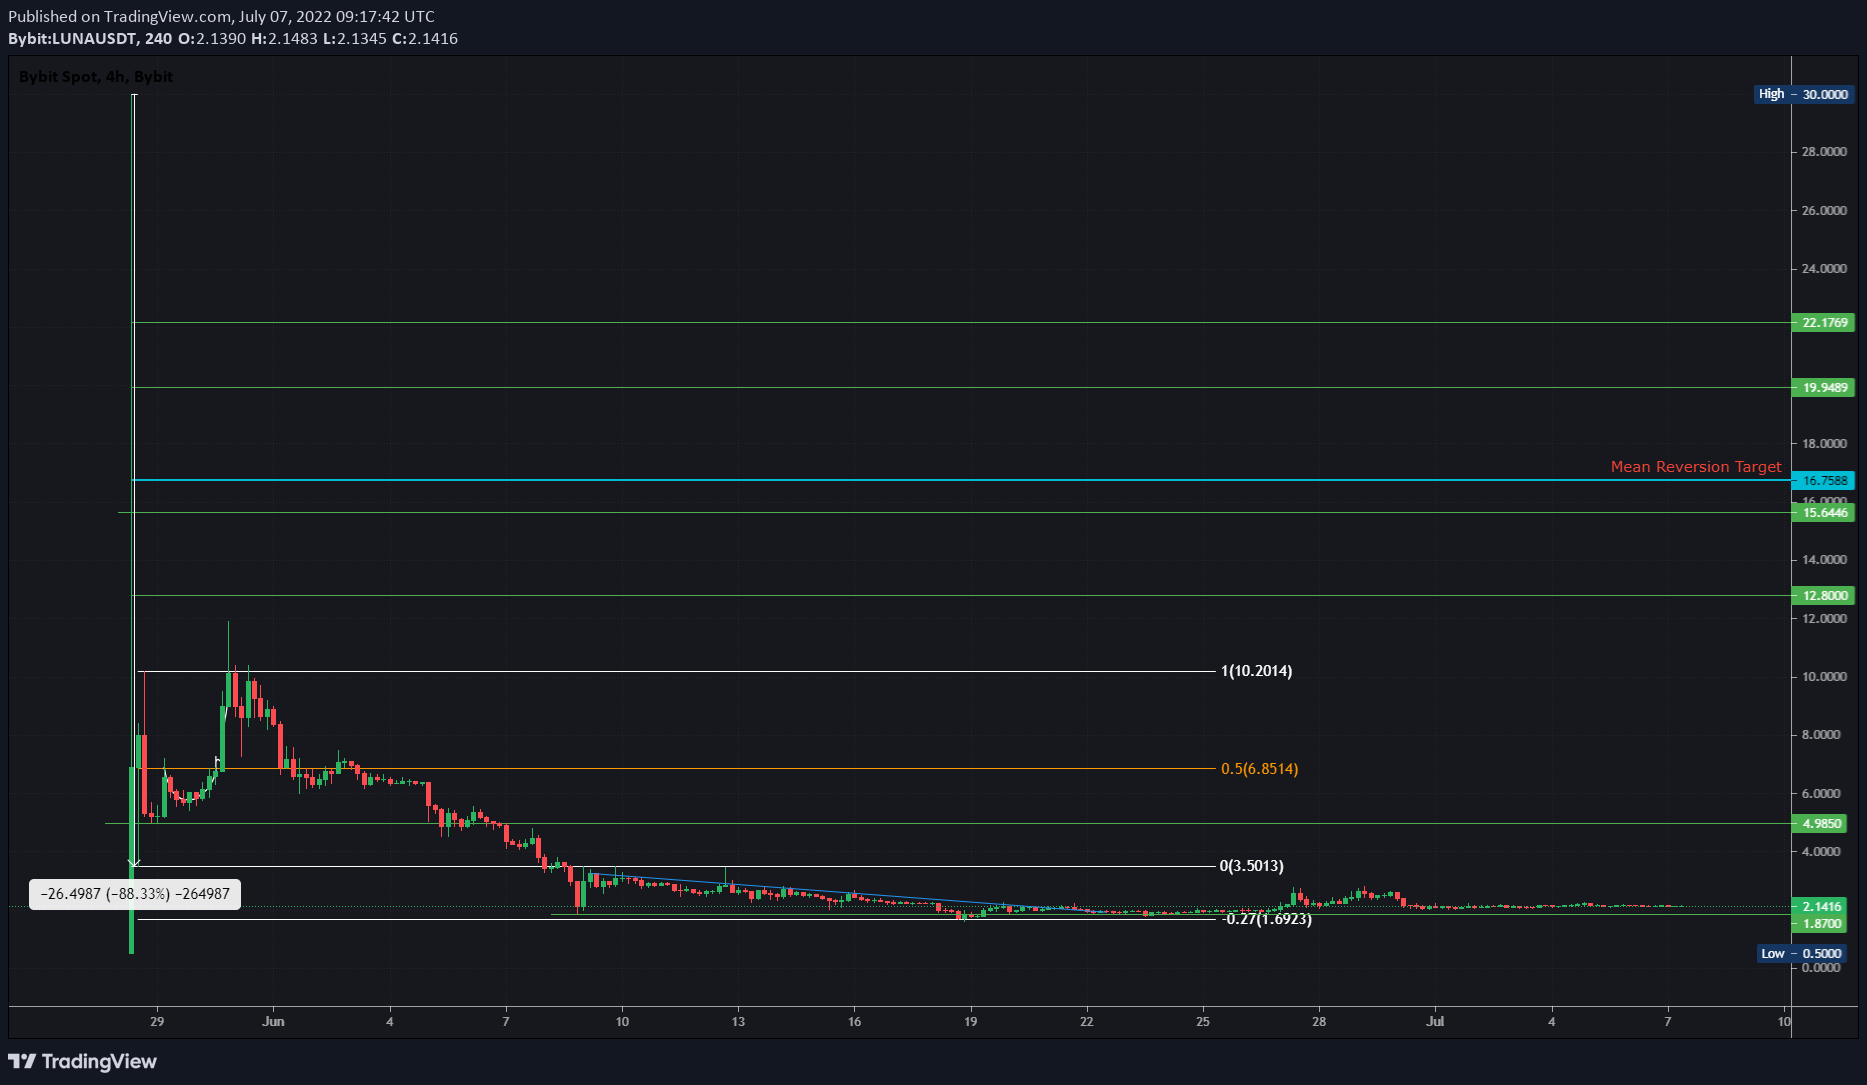
LUNA/USDT 4-hour chart
Mean reversion and an opportunity to hit it big
The mean reversion concept, in a general sense, indicates that extremes normalize ie., things at extremes tend to return to the mean.
The best example is electrons in an atom. When they are blasted with neutrons, they get excited and move to a higher state, but since that state is unstable, they expel energy in the form of photons and then return to their original state, where they are stable.
This phenomenon is used in lasers and is true for most cases in nature.
With respect to trading, when an asset’s price explodes violently in one direction, it is unsustainable and returns to the mean. This is the reason why stock markets have cycles or bull and bear runs.
It is a simple and intuitive concept that can be applied to easily understand realized profits.
Check out the example shown below for RUNE and BTC.
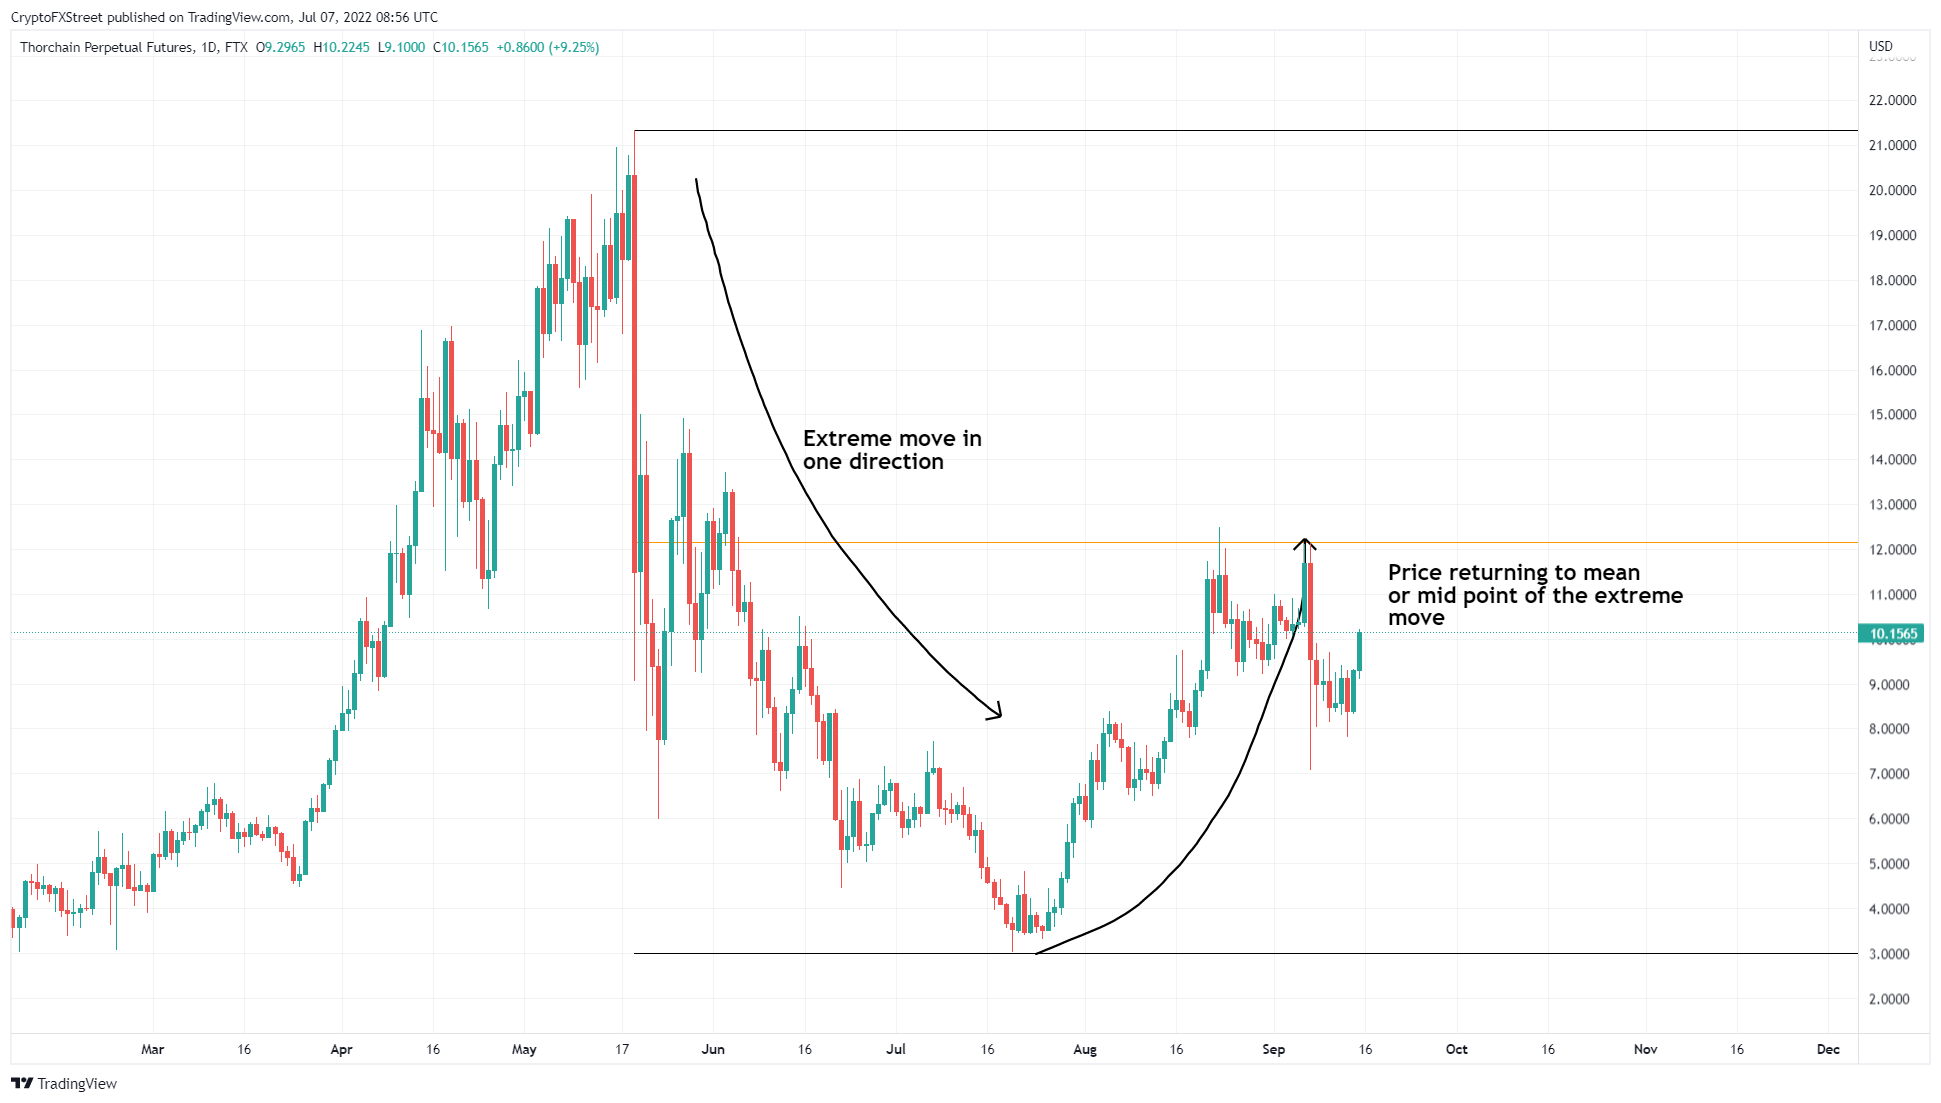
RUNE/USDT 1-day chart
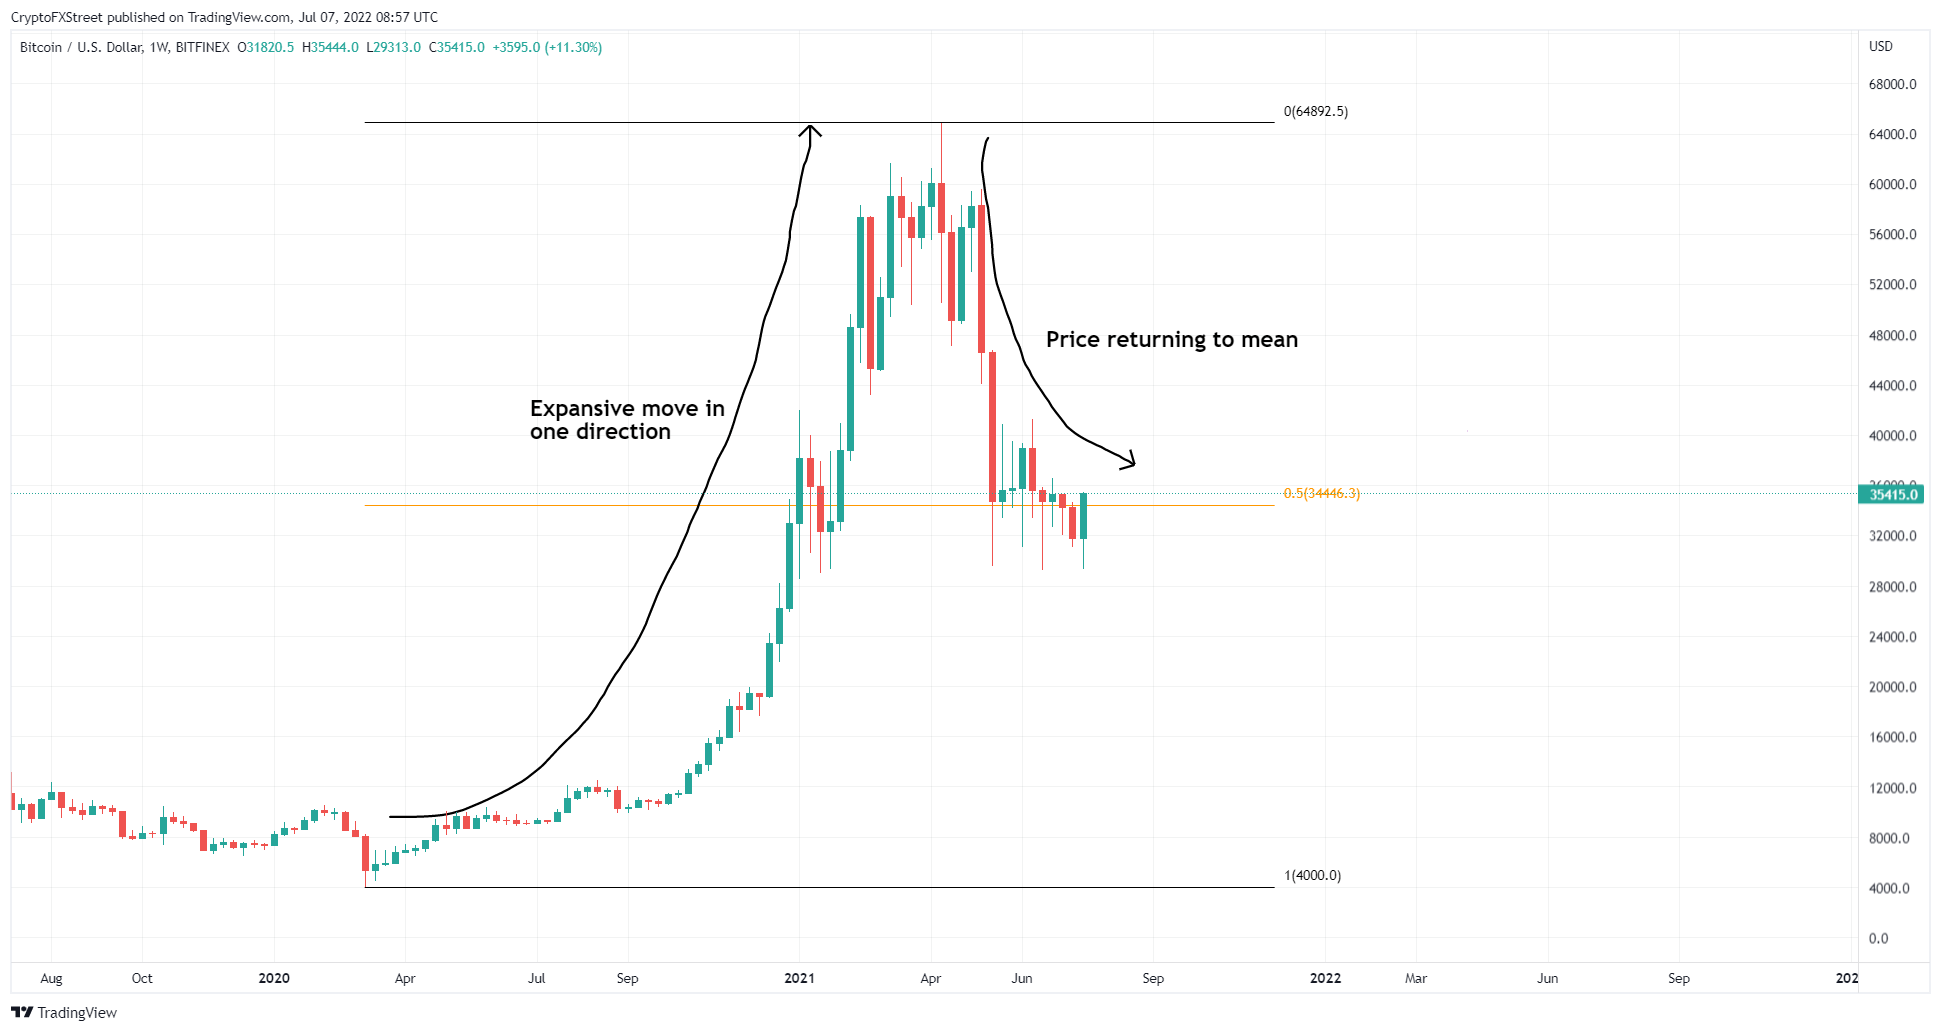
BTC/USDT 1-week chart
Long-term trading strategy for LUNA 2.0
So, if one can identify the end of an expansive move, it is not hard to guess where the price will head next and how to capitalize on it.
For LUNA 2.0, the price rallied from $0.5 to $30, but dropped 88% soon after, which is a mean reversion in and of itself. However, the next rally pushed it from $3.5 to $10, which though a reversion fell short of the mean of the 88% down move.
Using the Fibonacci Retracement tool from $30 to $3.5 shows that the mean is $16.75, which is the long-term target for traders. If these levels seem out of reach, let’s speculate on the potential returns.
- If LUNA price returned to $6.85, the midpoint of the $3.50 to $10 range, this move would amount to a 220% ascent.
- A move to $10 would represent a 375% upswing.
- If LUNA 2.0 reversed trend and reached the $16.75 level, that would constitute a 680% gain.
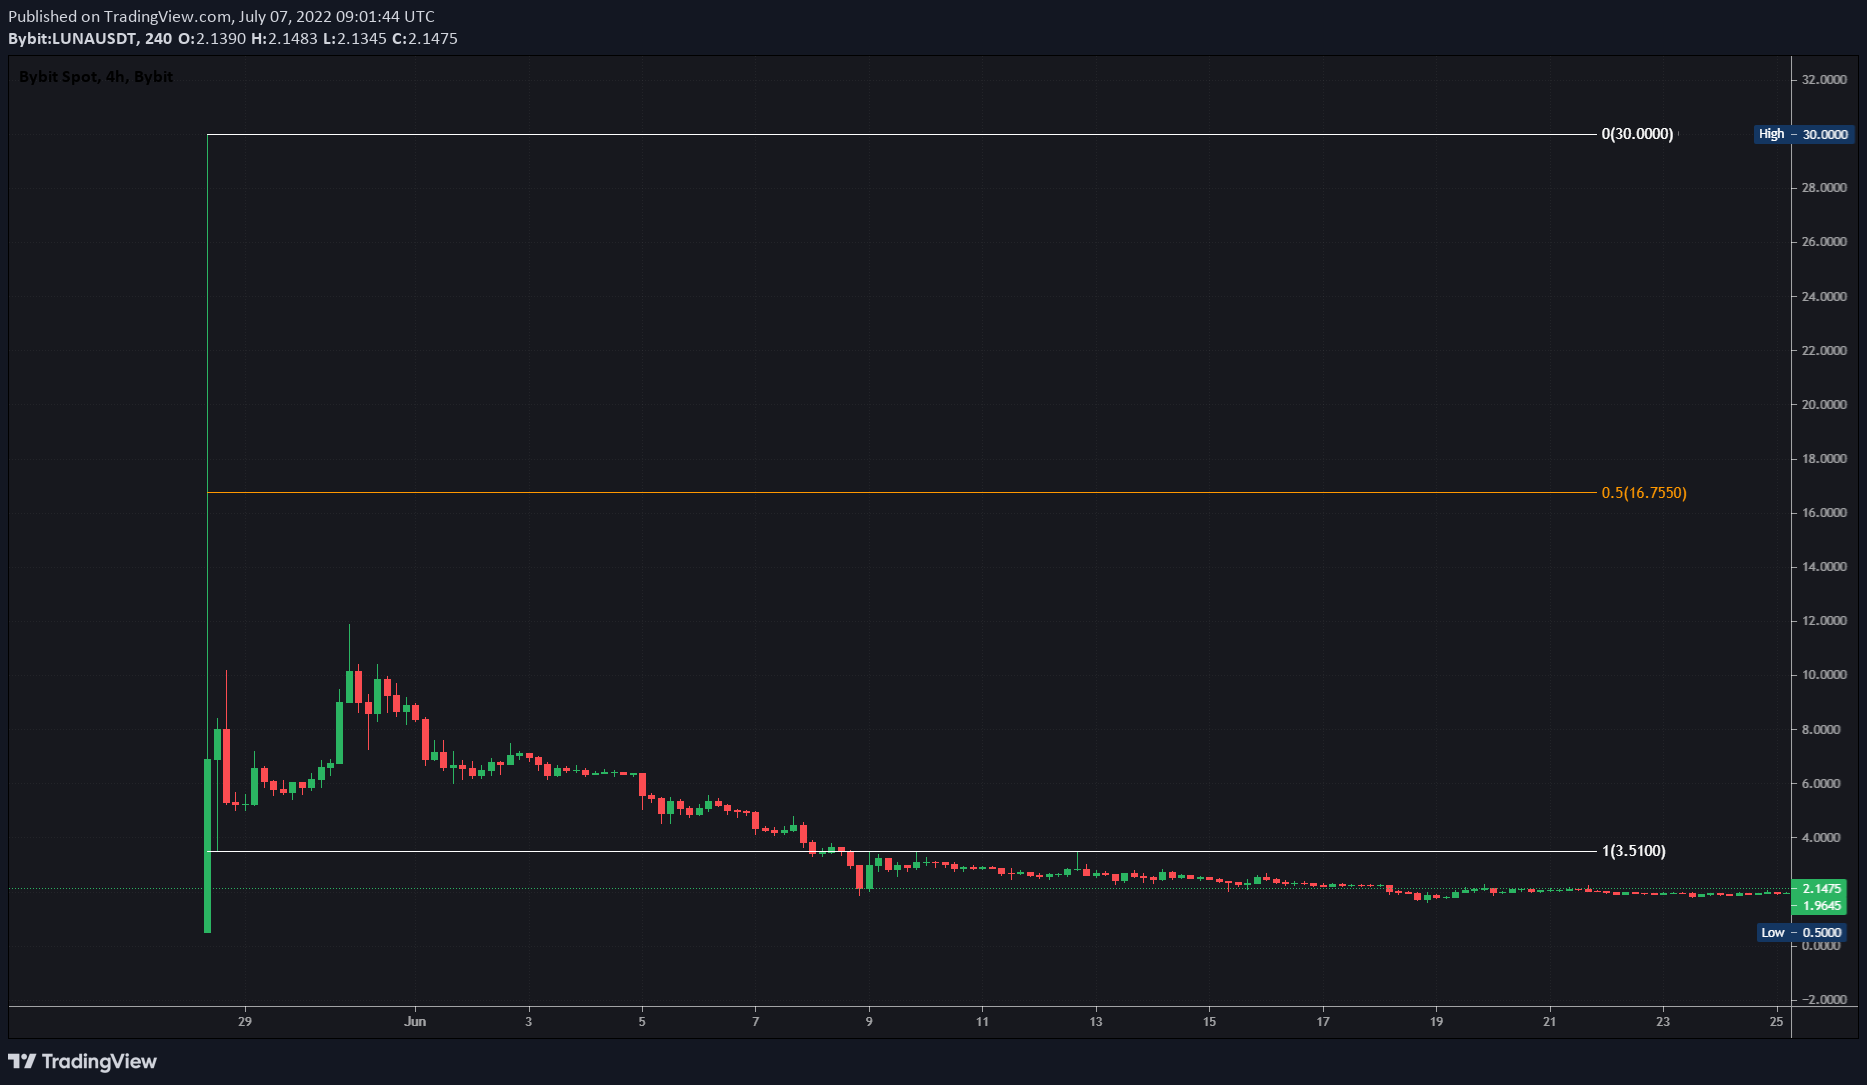
LUNA/USDT 4-chart
Investors should note that these returns are for spot purchases and would be many times over if one were to use leverage trading and margin.
LUNA/USDT 1-day chart
Why would LUNA 2.0 rally that much and will it really happen?
- Well, apart from the mean reversion, a look at LUNA Classic or LUNC could also provide a clue as to where LUNA 2.0 will go. This altcoin has rallied 378% since May 31.
- Usually, altcoins rally because of capital rotation. One can assume that if the capital that is already trading LUNC pivots to LUNA 2.0, there would be a sudden spike in demand, triggering a potential rally such as the one discussed above.
- Moreover, Bitcoin price could resume its recovery rally and tag the 200-week SMA at $22,500, which would give the whole altcoin market some added oomph and act as a catalyst for a rallys in other coins.
Disclaimers to consider
- If Bitcoin price fails to continue its run-up and resumes its downswing, LUNA and the larger altcoin ecosystem could start to sell-off. In such a case, our bullish thesis would be invalidated.
- If the capital rotation does not happen, it would indicate that investors are not interested in LUNA 2.0 and hence, the rally could prematurely stop at $3.5 or $5 and might never go to $10 or higher.
- If the LUNA price produces a daily candlestick close below $1.69, it will create a lower low and invalidate the bullish thesis. Such a development would see the altcoin head toward its listing price of $0.5.
Author

Akash Girimath
FXStreet
Akash Girimath is a Mechanical Engineer interested in the chaos of the financial markets. Trying to make sense of this convoluted yet fascinating space, he switched his engineering job to become a crypto reporter and analyst.



