Technical Weekly - Mind the gap

The cryptocurrency markets were mixed in early Monday Asia trading after the prices of bitcoin have barely touched the 7300 area over the weekend. The leading cryptocurrency has been trading above the psychological 7000 levels for almost three weeks. We've seen a slight increase in the downward pressure of BTC price in the short-term. However, we believe we are still very far from any significant selloff, although anything below the 7000 levels could increase the chance of triggering a more noticeable sentiment shift.
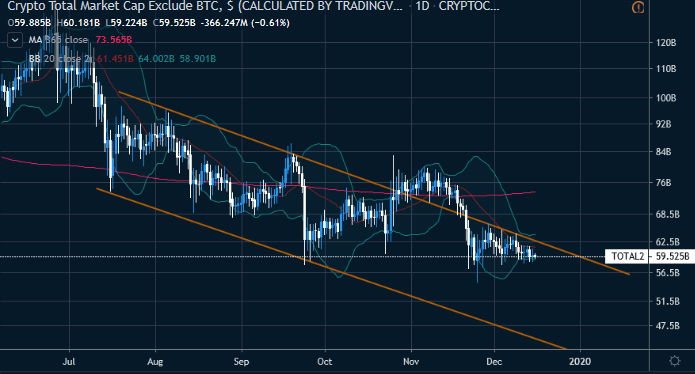
In the altcoin space, ETH and XRP were traded about half of a percent lower on Monday, while XTZ, ALGO, and LINK were in the green. Volatility is expected to pick up in the altcoin space. The Crypto Total Ex-BTC Market Cap (figure 1) has been hitting the upper end of the half-year downward channel, which has posed as significant resistance. The Bollinger squeeze also indicates the probability of an upcoming volatility increase.
Figure 1: Crypto Total Market Cap Ex-BTC (Source: Tradingview)
What You Missed
-
Ethereum's institutional appetite could be one of the focuses next year. Fidelity Digital Assets said the firm might support ETH if there's a demand in the market. Tom Jessop, President at FDAS, told The Block that the firm had done a lot of research on Ethereum, but institutional investors' demand to allocate capital to is still relatively low compared to BTC.
-
Switzerland believes that creating a digital currency for public use would pose risks to financial stability. During a National Council meeting on Friday, the government said, "Universally accessible central bank digital currency would bring no additional benefits for Switzerland at present." However, a CBDC that is restricted to limited financial market players would appear to be a more "promising strategy."
Price Analysis
BTCUSD
-
BTCUSD still hasn't cleared its daily trendline resistance as the pair retests the support at 7000 levels (figure 2).
-
While the charts may not be very inspiring at the moment. CME Futures has produced a 3-hour gap down on Monday. The upper end of the gap is at 7240 (figure 3).
-
Momentum-wise, we've seen room for the price to go marginally lower. The trends suggest that the 9-day RSI and the ultimate oscillator are likely to follow the stochastics into the oversold area, before having a significant rebound in price.
-
The OKEx BTC Long/Short Ratio has reached 1.19, the highest level in three weeks. The higher the ratio, the higher the potential profit for the short positions. The Ratio surge strengthened the case of having a price retreat in the short-term.
-
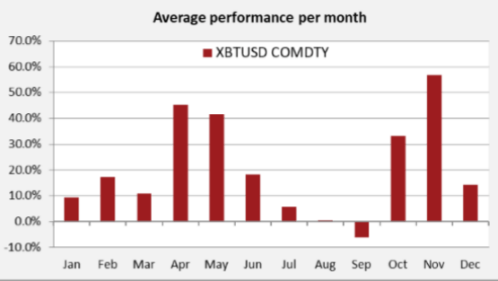
In a longer-term view, data from Bloomberg and Sentix shows BTC has an average of 15% monthly gains in December since July 2010, before entering a relatively calmer 1Q. It would be interesting to see if that seasonal pattern is going to repeat before the halving event next May.
Figure 2: BTCUSD Daily Chart (Source: FX Street)
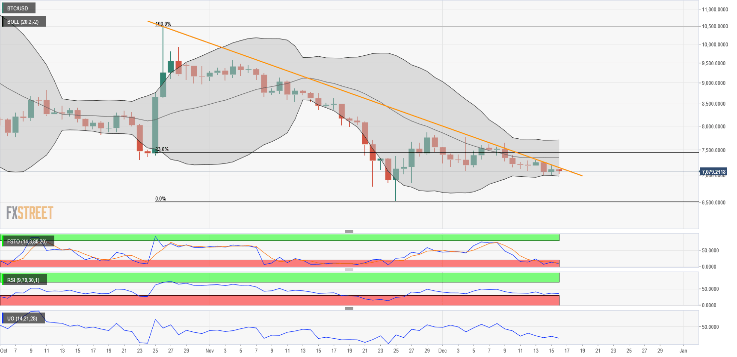
Figure 3: Bitcoin CME Futures 3-Hour Chart (Source: Tradingview)
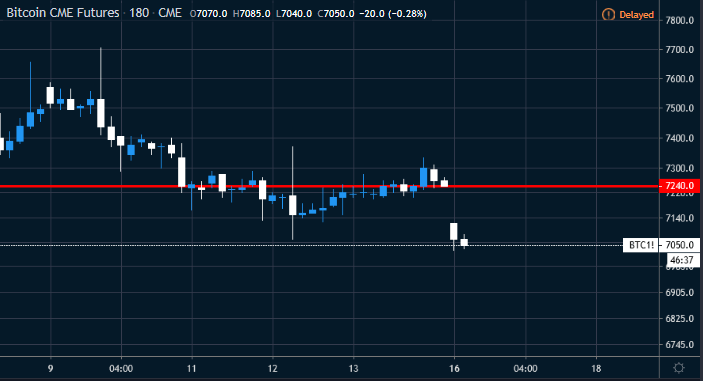
Figure 4: OKEx BTC Long/Short Ratio (Source: OKEx)
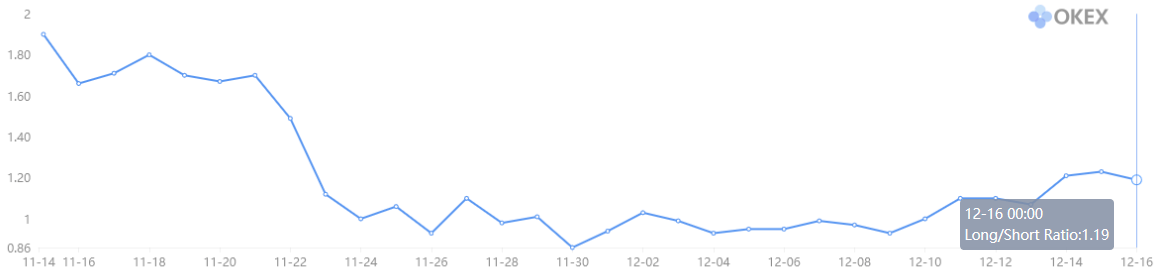
Figure 5: BTC Seasonal Performance Pattern Since 07/2010 (Source: Sentix; Bloomberg)
TRXUSD
-
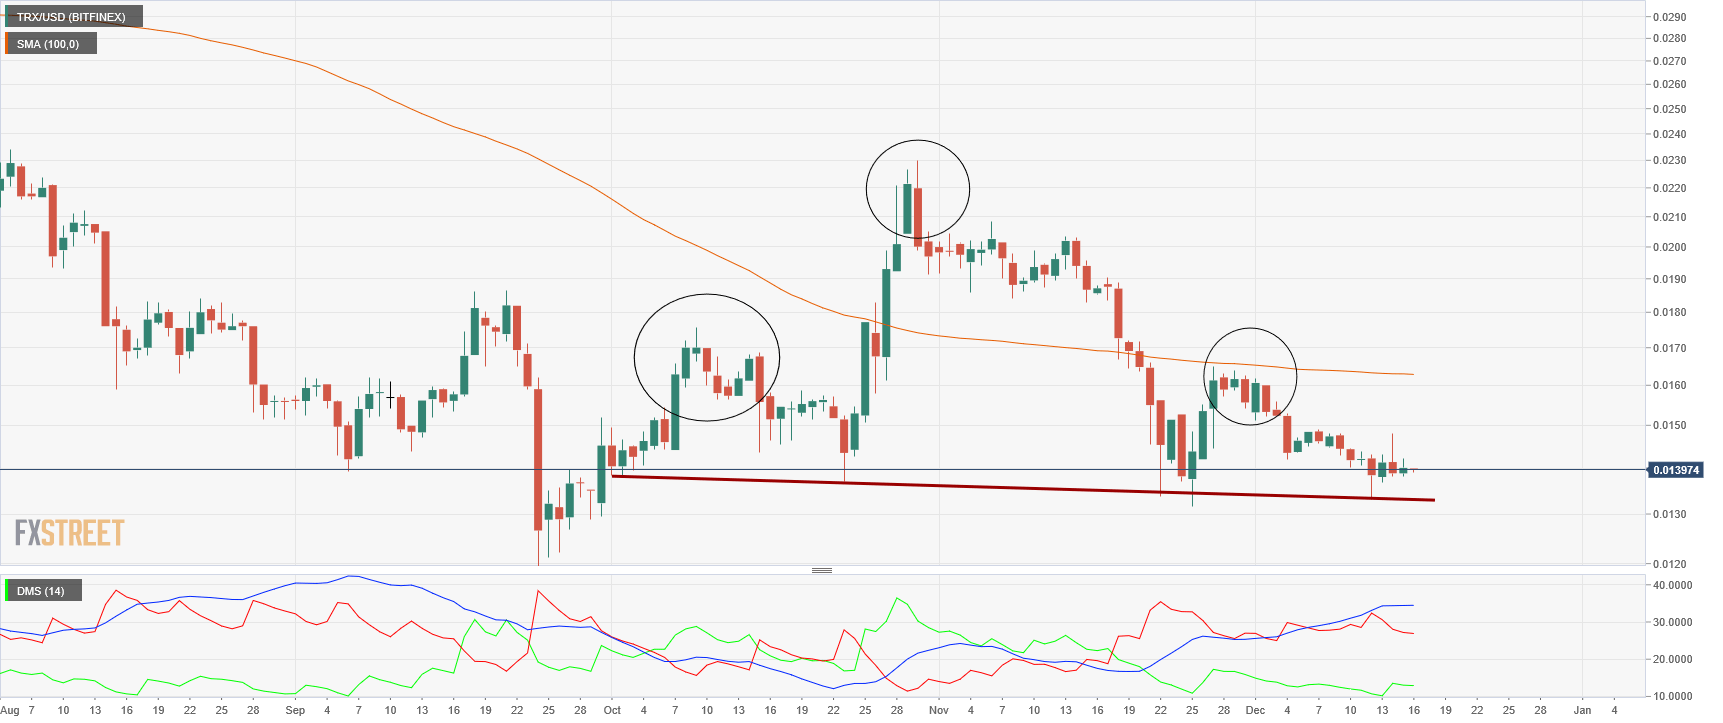
TRXUSD may pose to have a reversal to the downside as the pair has formed a daily head and shoulders pattern, with the neckline at around 0.0129.
-
While an imminent correction should not be ruled out, the lack-of-momentum situation has caused the price stalled at current levels. Both the +DM and -DM lines were flat at the moment.
-
The earlier failed attempt of breaking the 100-day moving average has turned previous support into resistance.
Figure 6: TRXUSD Daily Chart (Source: FX Street)
DASHUSD
-
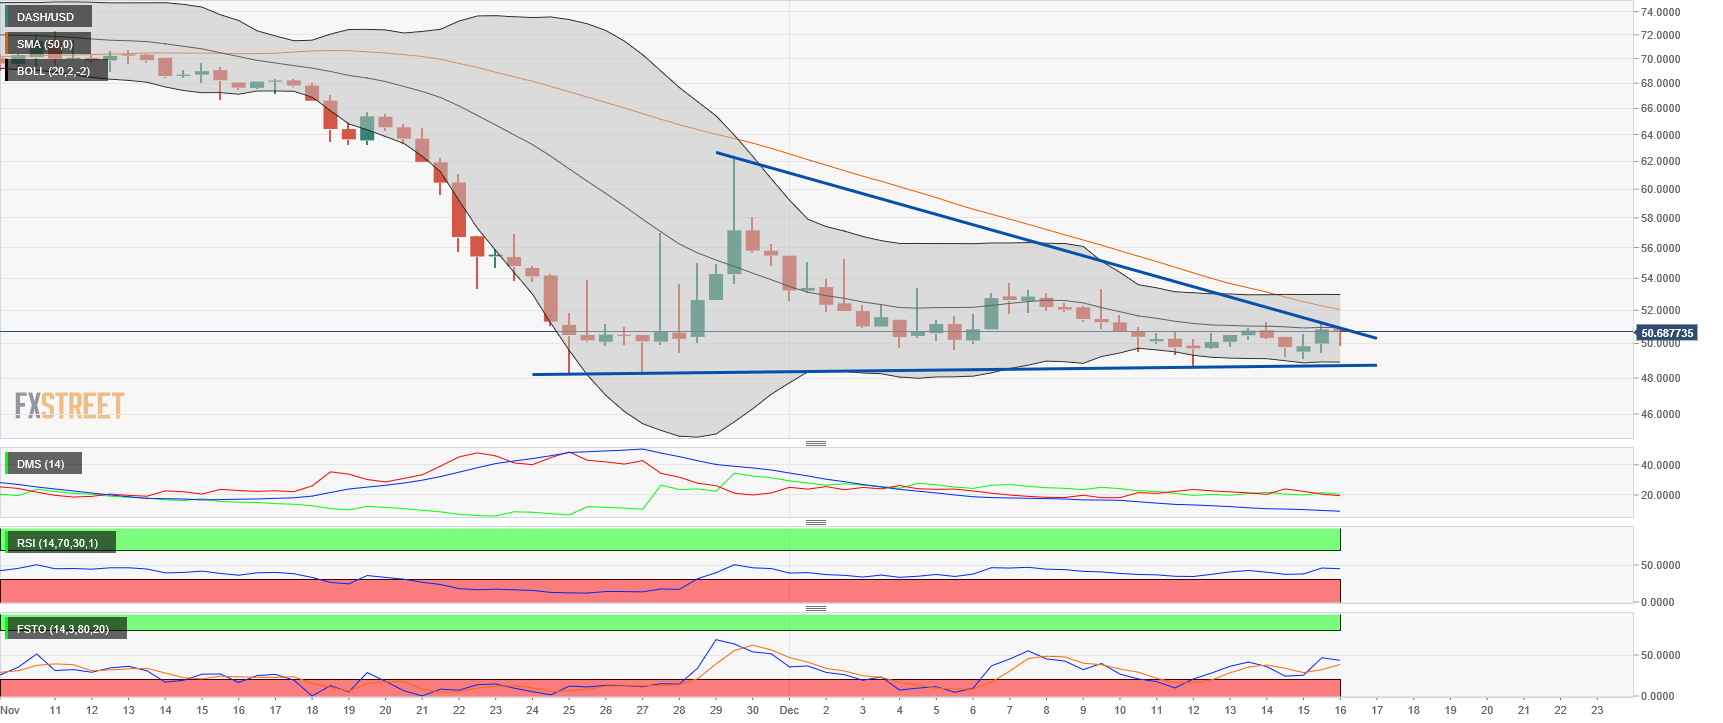
DASHUSD sets to produce a breakout as the pair is about to complete a 12-hour triangle pattern.
-
The recent price actions may strengthen the bias more to the downside, as the 20-SMA seems like a reasonable resistance level.
-
Besides, momentum indicators have yet to show signs of picking up. If more considerable positive momentum is seen from here, that could boost the chance of having a decisive breakout.
Figure 7: DASHUSD 12-Hour Chart (Source: FX Street)
XTZUSD
-
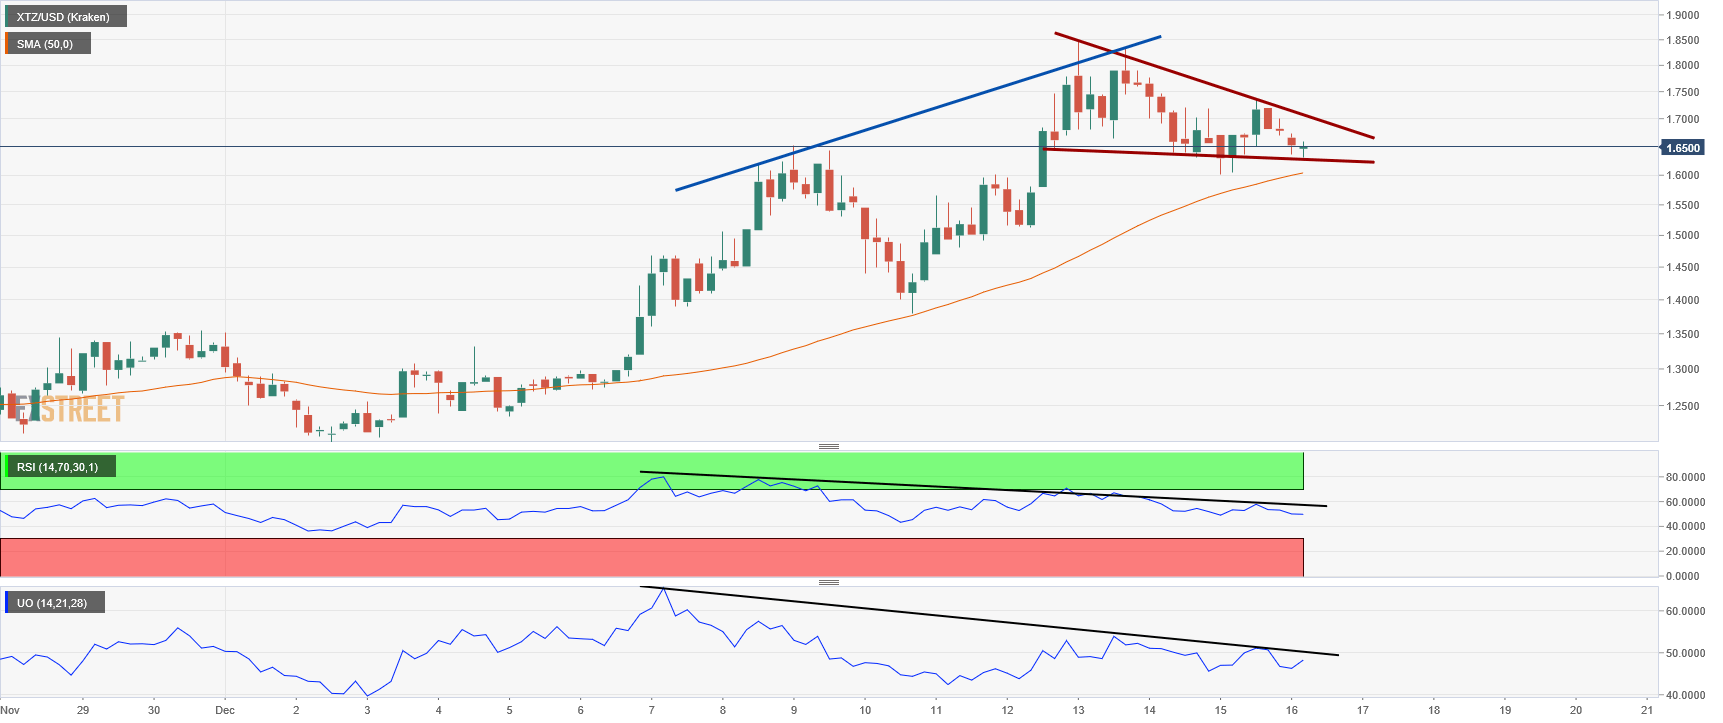
Tezos has been the primary focus in the altcoin space as the prices of XTZ has been outperformed leading altcoins recently. However, indicators suggest that the rally may have run out of steam.
-
The ultimate oscillator and the RSI have shown bearish divergence with the price. At the same time, the pair has initially formed a descending triangle pattern (red lines) at the top.
-
50-SMA could be the first key level. If that level is compromised, that could trigger more profit- taking activities before the year-end.
Figure 8: XTZUSD 4-Hour Chart (Source: FX Street)
Author

Cyrus Ip
OKEx
Cyrus Ip has the privilege to work with OKEx as a Research Analyst, where he found some of the brightest talents in the crypto space.


