Technical weekly: Brewing a big move

Key Takeaways
Technical indicators suggest that BTC prices could see some significant moves after weeks of range trading.
XRP is set to have a breakout with the bias more on the positive side.
ETH bulls may have to take a break in the upper 180 handles.
Market Overview
The cryptocurrency markets were undecided after the prices of BTC were unable to produce a daily close above the USD 7200 levels over the weekend. The leading crypto has not closed above such levels since March 11. However, the support in the USD 7000 area seems to remain solid.
In our past publication <OKEx Technical Weekly: April 14 2020,>, we have highlighted that the resistances at USD 7200 remained significant, and the neckline of the previous head and shoulders remained in focus this week.
While traders and investors have been looking for directions ahead of the highly anticipated bitcoin reward halving event, which is expected to happen in Mid-May, new data shows that volatility of BTC prices is set to increase drastically. This volatility increase could occur within a short period.
A survey from Sentix shows that the Bitcoin Super Neutrality Index reached a 26-week high. Patrick Hussy, Managing Director at Sentix, explained that some big BTC price actions occurred after the last time BSNI hit a new high, which moved BTC prices by USD2500, and this could be the case for the current market. However, Hussy added that the direction of the movement could not be determined with such data.
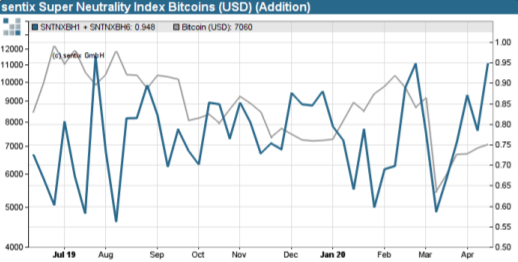
Source: Sentix
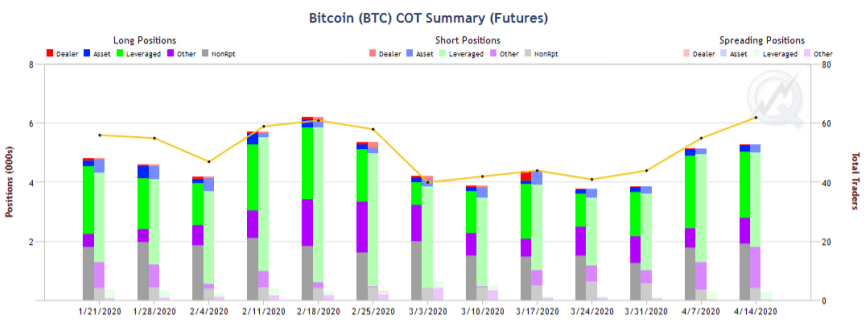
Source: CME Group
Meanwhile, institutional investors seem to have taken a more proactive approach in the BTC market, as the crypto community counting down for the halving event. Data from CME shows that the open interest of futures has been increasing. However, asset managers and leveraged accounts seem to have a spread view. Asset managers have increased their short positions, while leveraged names have closed some of their shorts.
Price Analysis - BTC/USDT - Big moves anticipating?
Technical indicators suggested that markets could see some bold price actions in BTC, as the Bollinger bands further squeezed on the daily chart. That echoes Sentix’s finding that mentioned earlier in this article. The price volatility could increase in the future, though, the direction of the breakout is undetermined.
While the neckline remained in focus, momentum seems to be slowing, with the RSI has been moving in a downward channel. If a breakout of the channel is seen, it could strengthen the case of having a positive breakout of the price.
In a medium/longer-term view, the difficulty ribbon remained in a squeeze, which could mean the current price levels could still be ideal for accumulations. A new uptrend has started in early January after the difficulty ribbon squeeze in late December.
Level-wise, if the price can be stabilized above the neckline, it could set the foundation for testing the 7700 levels. The lower levels of 6500 is another critical area to watch.
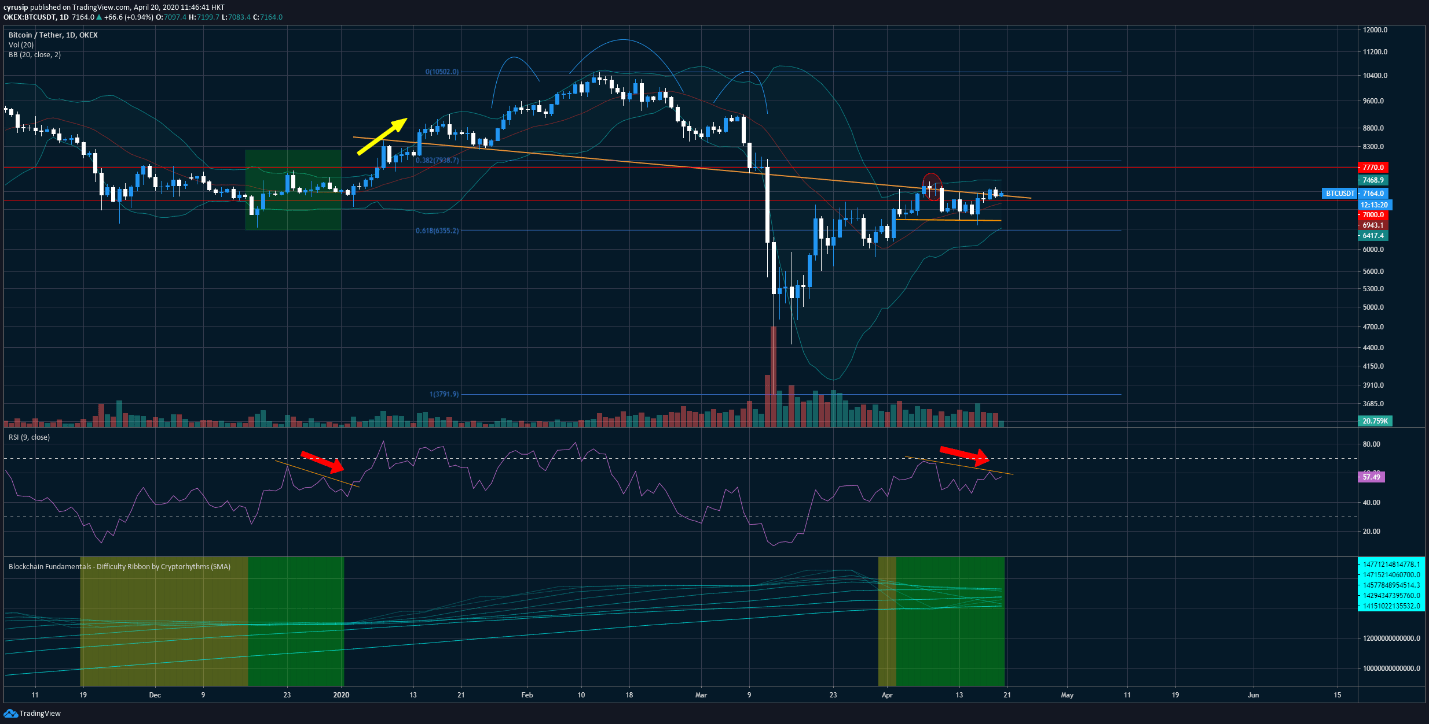
Source: OKEx; Tradingview
XRP/USD – Breakout in the making?
XRPUSD has been trading below its daily 38.2% Fibonacci Retracement for more than a week. As the pair has been moving closer towards the triangle pattern end, it's expected to produce a breakout.
The additional squeeze of the Bollinger bands also indicates the price volatility is expected to increase.
The momentum indicator has produced a reversal from the recent downtrend, suggesting the strength has been building up. On top of that, a u-shaped bottom has initially formed in the slow stochastic, that could be another indication of potentially having a positive price breakout.
The 38.2% FR at 0.196 is the first level to watch. If seen, it could set the stage for retesting 0.213 to 0.215. Meanwhile, 0.187 could be the lower level to watch.
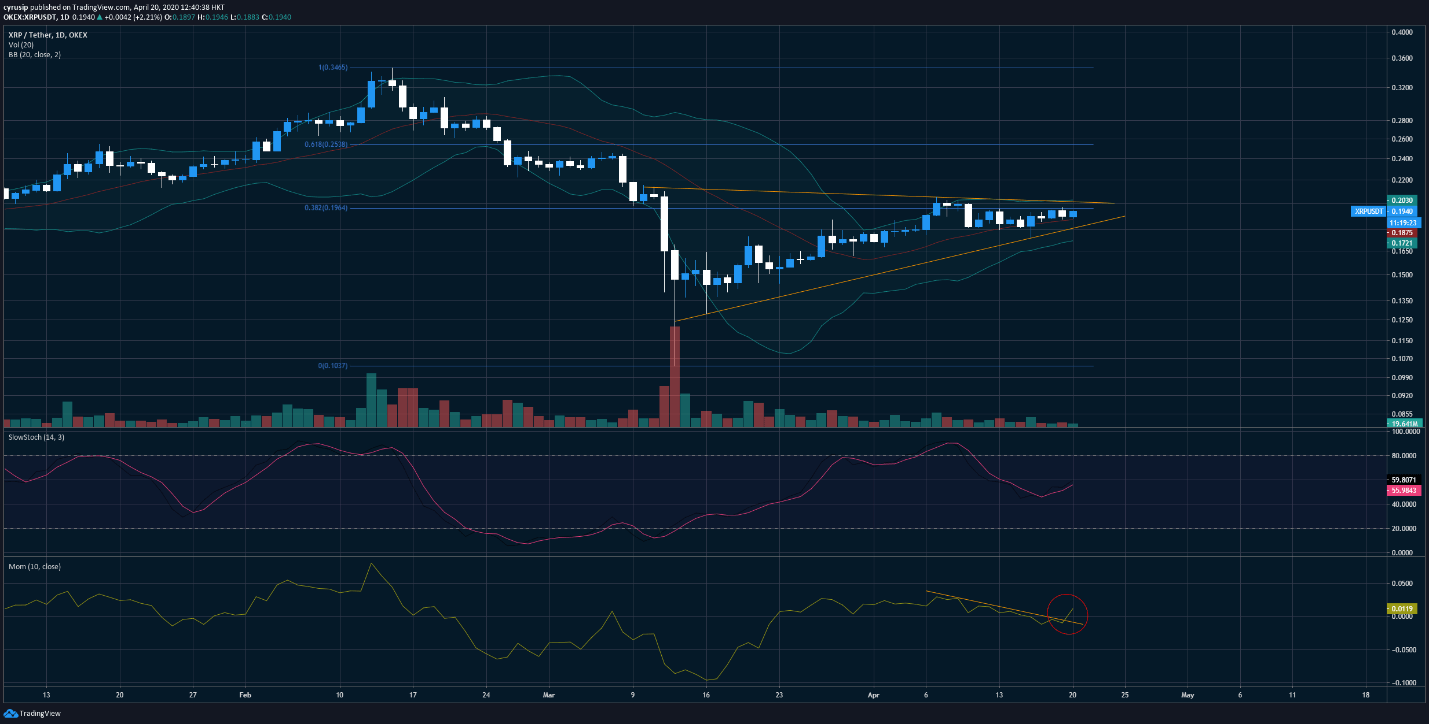
Source: FX Street
ETH/USD – Bull needs a break?
In our last edition of OKEx Technical Weekly, we have confirmed ETHUSD’s positive breakout after forming an ascending triangle pattern.
However, ETH bulls may need to take a break, as a bearish crossover in the stochastic oscillator seems in the making, suggesting that the rally momentum seems started to slow down. Meanwhile, the slow stochastic seems to form a double top.
Although the bulls may need to take a short break, that does not mean the medium-term rally is ending. As the ultimate oscillator remained in the March-April uptrend, a short-term correction may represent a buying opportunity.
The 100-day MA around the 184 area could be the first level to watch, and the channel support located near 170. Besides, the 38.2% FR near 163 could be another focus.
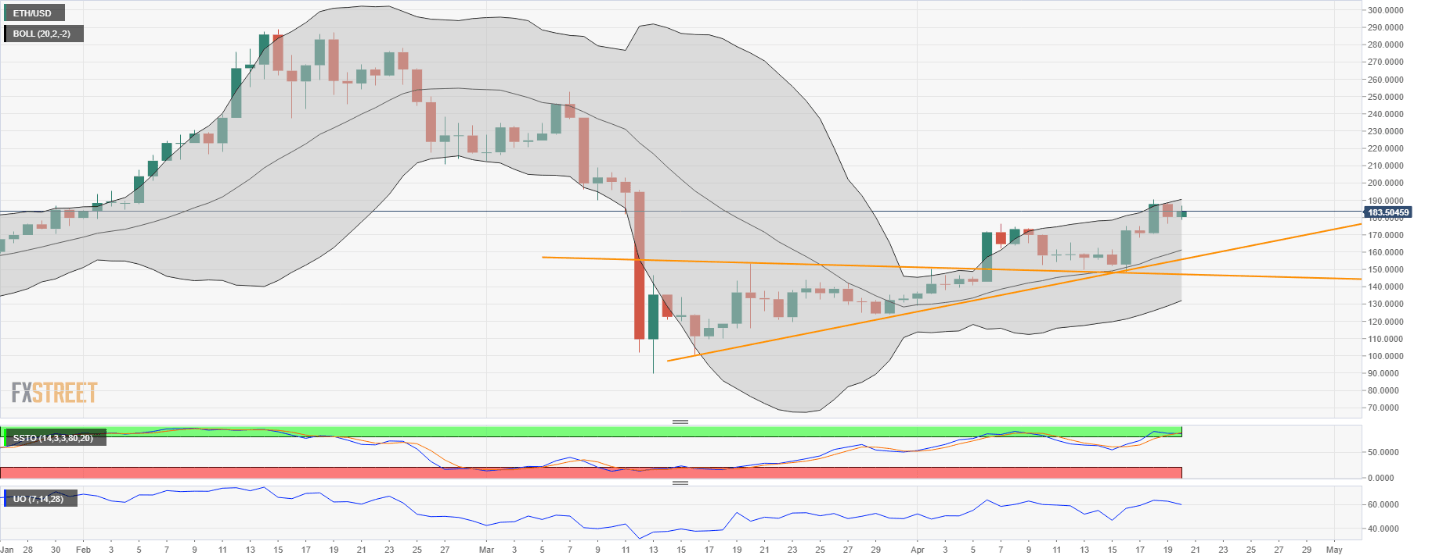
Source: FX Street
ZEC/USD – Rally is getting tired?
ZEC was one of the top-performing altcoins during the Monday Asia session, traded almost 6% higher against USD.
However, there could be a turn for the bulls here, as the RSI is at levels consistent with the prior two periods of correction before.
A turn now, if seen, would increase the chance of the price to test the triangle neckline, to see if it's able to turn the previous resistance to support.
The first level to watch could be 42. If compromised, it could strengthen the case of retesting 38.
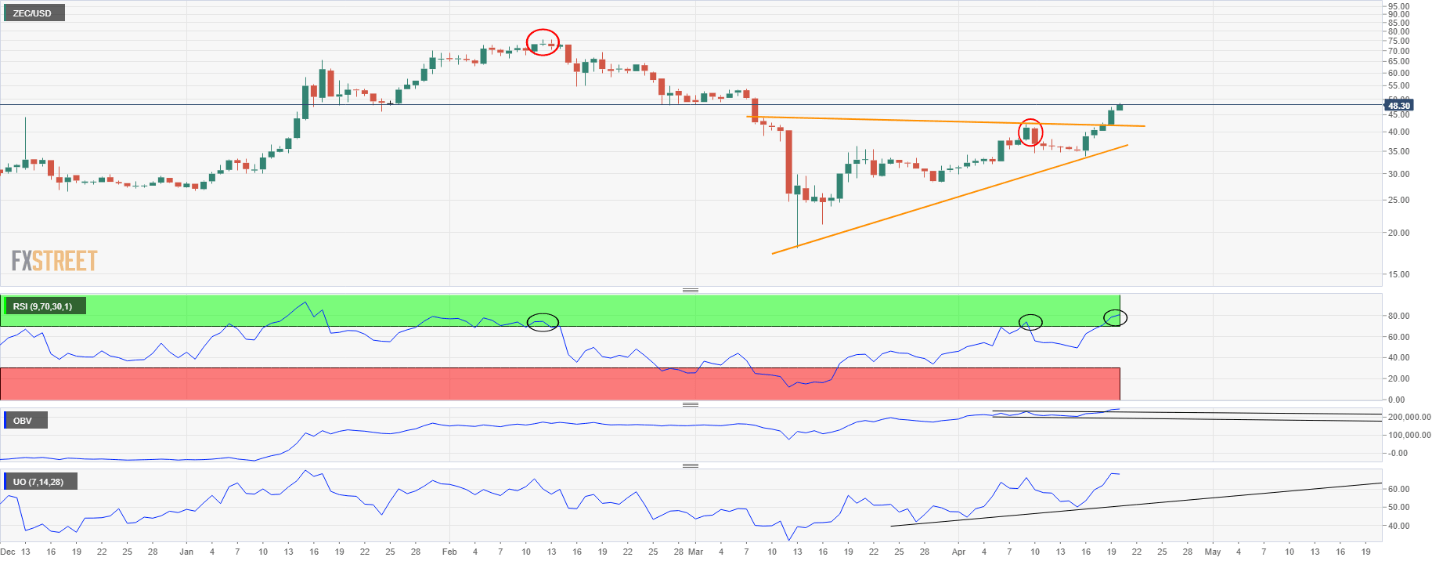
Source: FX Street
Author

Cyrus Ip
OKEx
Cyrus Ip has the privilege to work with OKEx as a Research Analyst, where he found some of the brightest talents in the crypto space.


