SUI Price Forecast: Bears aim for 40% crash
- Sui price edges down on Tuesday after falling nearly 15% the previous week.
- Coinglass’s OI-weighted funding rate data is negative, suggesting potential downward pressure on Sui price.
- A daily candlestick close above $3.76 would invalidate the bearish thesis.

Sui (SUI) price edges down, trading around $3.54 on Tuesday after falling nearly 15% the previous week. The technical outlook and Coinglass’s OI-weighted funding rate data are negative, suggesting potential downward pressure on Sui’s price.
Sui price is poised for a downleg as it faces resistance around 200-day EMA
Sui price broke below an ascending trendline (drawn by connecting multiple daily close levels since November 26) on January 19. However, it recovered slightly to retest the broken trendline the next two days, but it was rejected, leading to a crash of 29% until Sunday. At the time of writing on Tuesday, it continues to trade down, facing rejection from its 200-day Exponential Moving Average (EMA) at $3.76.
If Sui continues its correction, it could extend the decline to test its next support level at $2.34, crashing nearly 40% from its current level.
The Relative Strength Index (RSI) on the daily chart reads 39, indicating strong bearish momentum not yet in oversold conditions, leaving more room to extend the decline.
The Moving Average Convergence Divergence (MACD) indicator also shows a bearish crossover, suggesting a sell signal. Rising red histogram bars below the neutral zero line suggest that Sui’s price could continue its downward momentum.
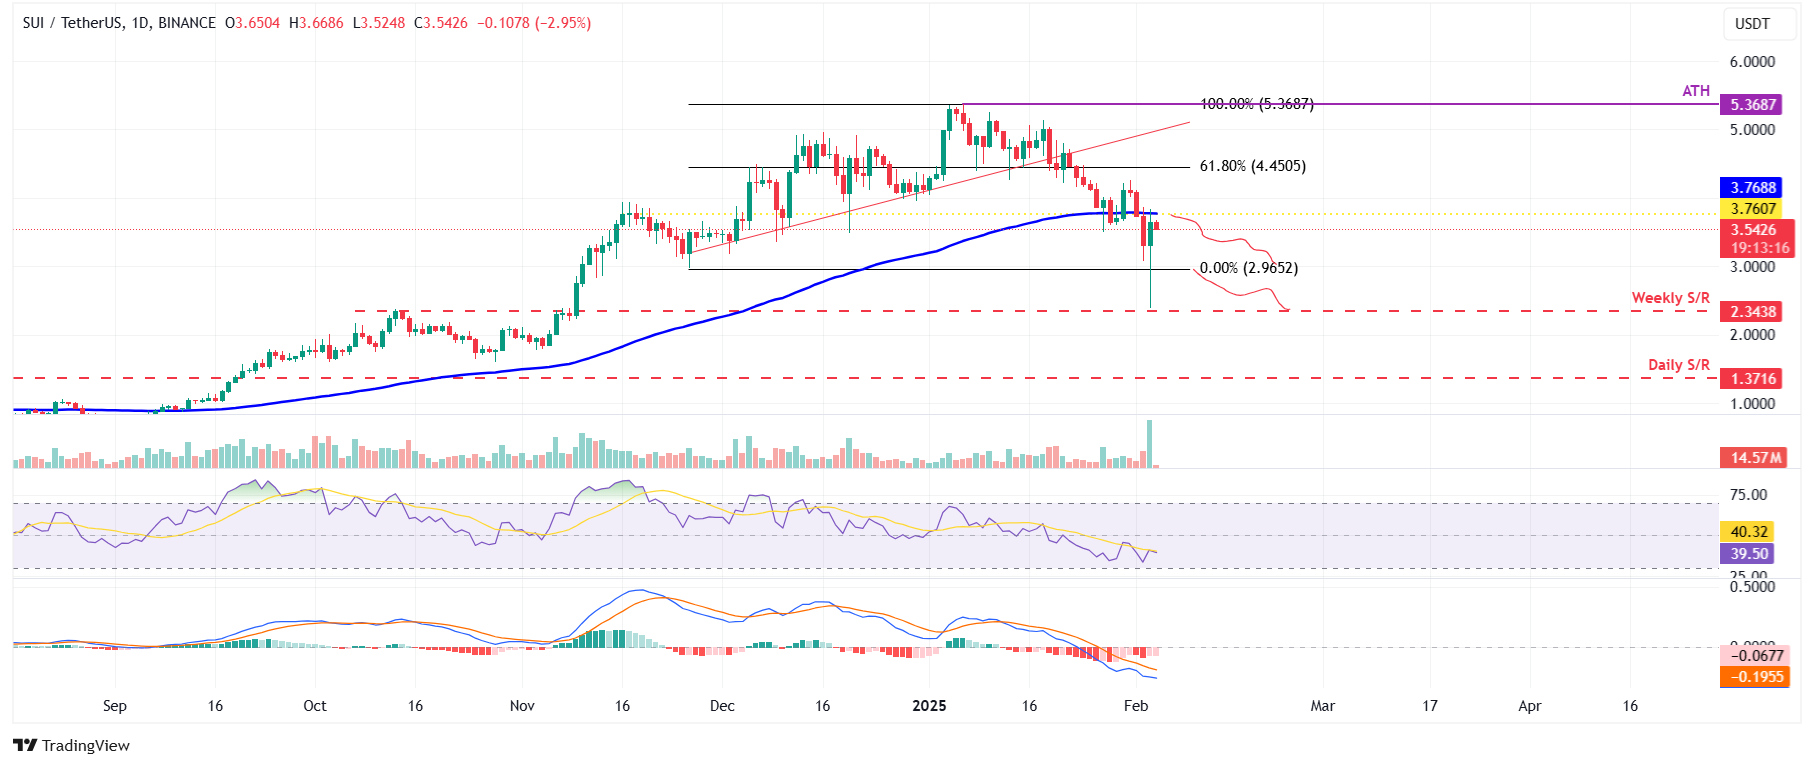
SUI/USDT daily chart
According to Coinglass’s OI-Weighted Funding Rate data, the number of traders betting that the price of SUI will slide further is higher than those expecting it to increase.
This index is based on the yields of futures contracts, which are weighted by their open interest rates. Generally, a positive rate (longs pay shorts) indicates bullish sentiment, while negative numbers (shorts pay longs) indicate bearishness.
In the case of SUI, this metric stands at -0.0281%, reflecting a negative rate and indicating that shorts are paying longs. This scenario often signifies bearish sentiment in the market, suggesting potential downward pressure on Sui’s price.
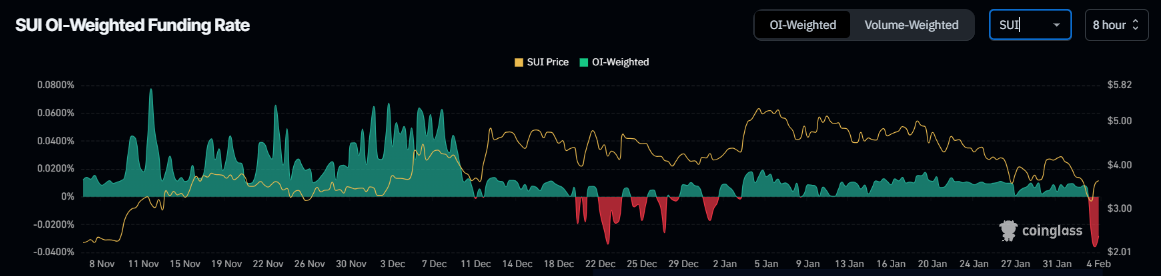
SUI funding rate chart. Source: Coinglass
However, If Sui closes a daily candlestick above its 200-day EMA at $3.76, the bearish thesis would be invalidated, leading to a price recovery to retest its next resistance level at $4.45.
Author

Manish Chhetri
FXStreet
Manish Chhetri is a crypto specialist with over four years of experience in the cryptocurrency industry.