Pepe Price Forecast: Recent dips liquidate over $20 million in leverage trades
- Pepe price hovers around $0.000010 on Tuesday after falling by more than 23% the previous week.
- The recent correction in the frog-based meme coin saw the liquidation of over $20 million in two days.
- On-chain data shows signs of weakness as PEPE’s funding rates are negative and the NPL indicator falls sharply.

Pepe (PEPE) hovers around $0.000010 on Tuesday after falling more than 23% the previous week. The recent correction in the frog-based meme coin has liquidated over $20 million in two days. Moreover, on-chain metrics show weakness as PEPE’s funding rates are negative, and the Network Realized Profit/Loss (NPL) indicator falls sharply, indicating a further decline.
Pepe traders face massive wipeout
Pepe price declined more than 11% on Sunday and continued its fall, reaching the November 5 low of $0.000007 on Monday during the Asian session but recovering quickly to close 2% higher on that day. This correction triggered a wave of liquidations, resulting in over $20 million in liquidations in two days, according to data from CoinGlass.
Strong liquidations like this could spark Fear, Uncertainty and Doubt (FUD) among the frog-based meme coin investors and could cause a rise in selling pressure, leading to a further decline in its price.
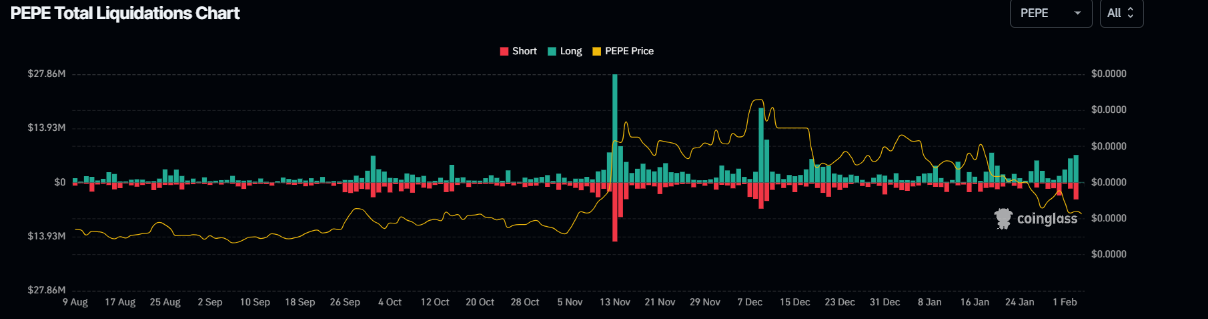
Pepe Total Liquidations chart. Source: Coinglass
Pepe’s on-chain metrics hint at further downleg
Pepe's on-chain metrics show signs of weakness and hint at further downleg. Coinglass’s OI-Weighted Funding Rate data shows that the number of traders betting that the price of PEPE will slide further is higher compared to those expecting it to increase.
This index is based on the yields of futures contracts, which are weighted by their open interest rates. Generally, a positive rate (longs pay shorts) indicates bullish sentiment, while negative numbers (shorts pay longs) indicate bearishness.
In the case of Pepe, the metric stands at -0.0059%, reflecting a negative rate and indicating that shorts are paying longs. This scenario often signifies bearish sentiment in the market, suggesting potential downward pressure on the frog-based meme coin.
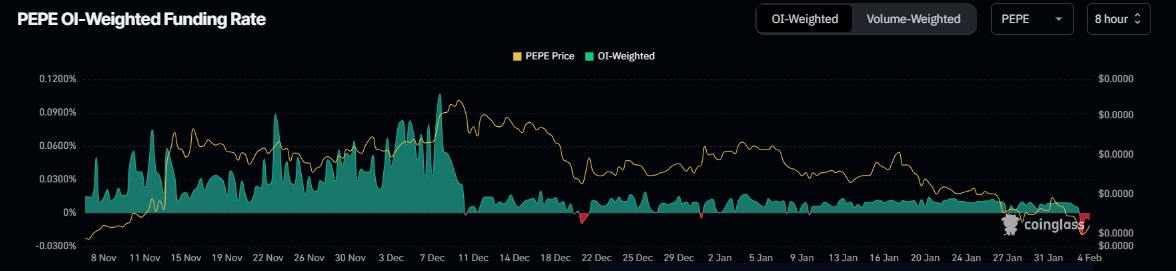
Pepe Funding rate chart. Source: Coinglass
On-chain data provider Santiment’s Network Realized Profit/Loss (NPL) indicator computes a daily network-level Return On Investment (ROI) based on the coin’s on-chain transaction volume. Simply put, it is used to measure market pain. Strong spikes in a coin’s NPL indicate that its holders are, on average, selling their bags at a significant profit. On the other hand, strong dips imply that the coin’s holders are, on average, realizing losses, suggesting panic sell-offs and investor capitulation.
In Pepe’s case, the NPL indicator dipped from -1.32 million to -48.36 million from Saturday to Monday. This negative downtick indicates that the holders were, on average, realizing losses and increasing selling pressure.
%20[08.28.30,%2004%20Feb,%202025]-638742400450936574.png)
Pepe Network Realized Profit/Loss chart. Source: Santiment
Pepe Price Forecast: Bears aim for 40% crash
Pepe price faced rejection around a descending trendline (drawn by connecting multiple highs since early December) on January 18. It declined nearly 47% in the next two weeks, closing below its 200-day Exponential Moving Average (EMA) at $0.000014. At the time of writing on Tuesday, it continues to edge down around $0.000010.
If PEPE continues its correction and closes below $0.000010 on a daily basis, it could extend the decline by nearly 40% from current levels and retest its August 5 low of $0.000010.
The Relative Strength Index (RSI) on the daily chart reads 32 and points downwards, indicating strong bearish momentum not yet in oversold conditions, leaving more room to extend the decline.
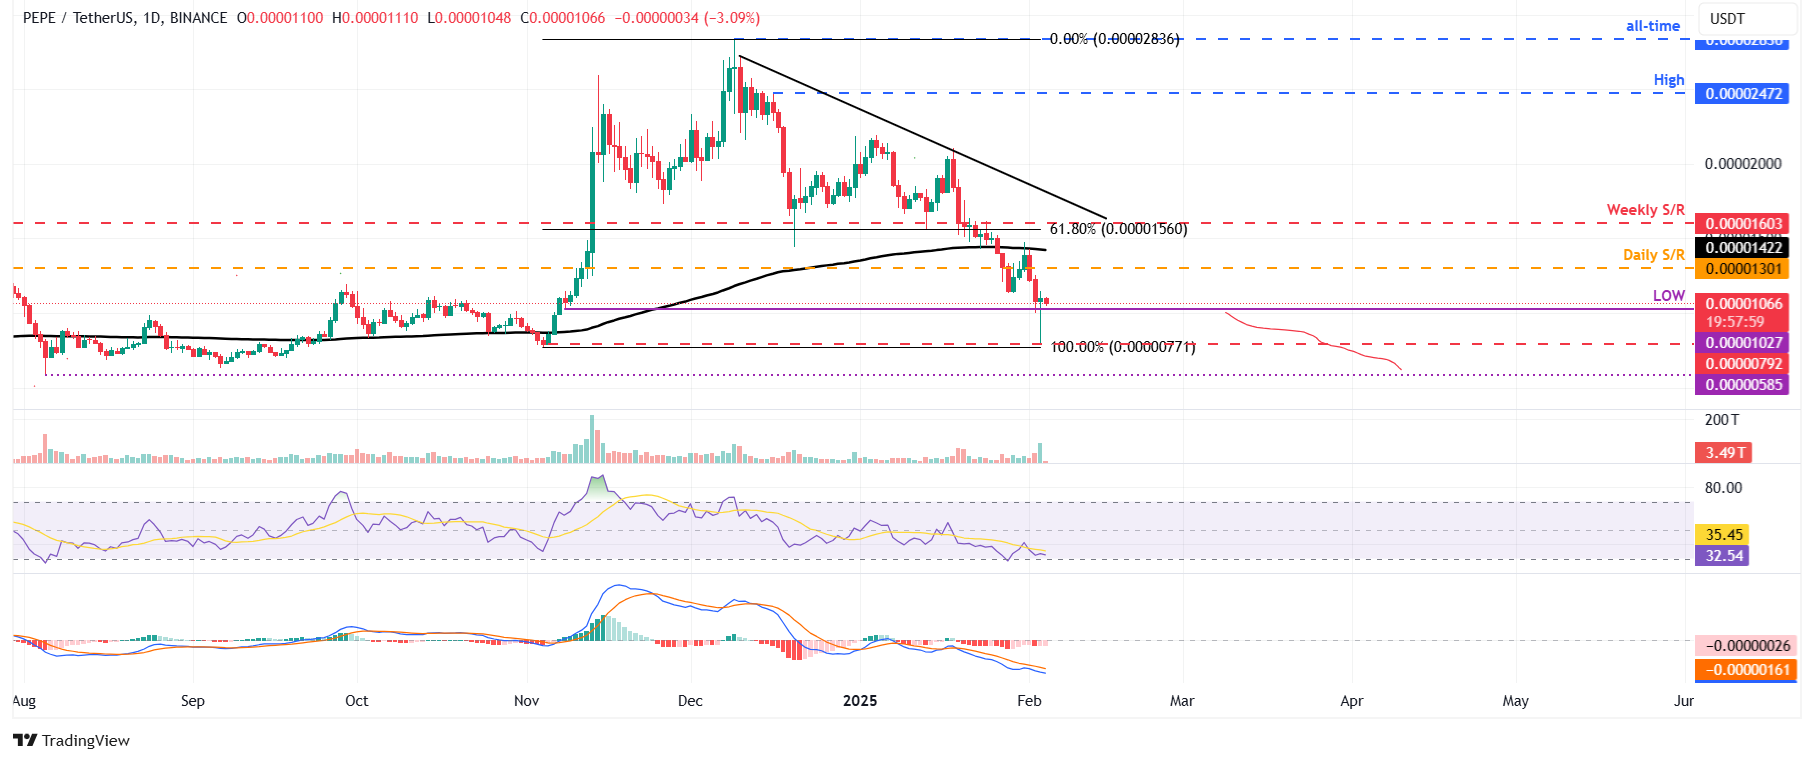
PEPE/USDT daily chart
Author

Manish Chhetri
FXStreet
Manish Chhetri is a crypto specialist with over four years of experience in the cryptocurrency industry.


